 Open Access Article
Construction and performance of a simple and efficient g-C3N4 photocatalytic hydrogen production system†
Yun Xu *,
Xuewei Wang,
LingFeng Zhu,
Ran An,
Zhulin Qi,
Haisu Wu,
Tifang Miao
 ,
Longfeng Li
 * and
Xianliang Fu*
College of Chemistry and Material Science, Key Laboratory of Green and Precise Synthetic Chemistry and Applications Ministry of Education, Anhui Province Key Laboratory of Pollutant Sensitive Materials and Environmental Remediation, Huaibei Normal University, Huaibei, Anhui 235000, China. E-mail: xuyun88@163.com; lilongfeng@chnu.edu.cn; tio2@foxmail.com
First published on 8th November 2021
Abstract
Surface and bulk structure modification is an effective strategy to improve the photocatalytic performance of g-C3N4 (CN). In this work, dilute NaOH solution was used in situ to regulate the CN structure for enhanced photocatalytic hydrogen evolution reaction (HER). Characterization results indicate that after treatment with dilute NaOH solution, the surface of CN was hydroxylated, resulting in the change of CN structure and the increase of BET specific surface area. Furthermore, some Na+ ions can be intercalated into the framework of CN, and form the Na–N bond. These modifications boost the HER activity of CN. The test carried out in 7.5 mM NaOH solution shows the highest activity and it is almost 3.7 times higher than that performed in water. Control tests indicate that hydroxides of other alkali and alkali earth metals such as LiOH, KOH, Ca(OH)2, and Ba(OH)2 have similar promotion effects. This work demonstrates a valid and simple way to enhance the HER activity of CN through performing the reaction in a weakly alkaline solution.
1. Introduction
Photocatalytic technology, which can degrade pollutants and convert solar energy into chemical energy by sunlight, is one of the most promising technologies to address the environmental and energy issues.1,2 Although many photocatalysts have been reported in the past few decades for photocatalytic hydrogen evolution reaction (HER),3–5 developing a simple route to enhance the HER performance of a photocatalyst is still a challenge. g-C3N4 (CN) composed by non-metallic elements has been widely used in photocatalytic HER, carbon dioxide reduction, nitrogen fixation and other reactions in recent years.6–12However, CN prepared by traditional methods with urea, melamine, dicyandiamide and thiourea as precursors has some defects, such as lack of active sites for surface reaction, high recombination rate of photogenerated electron hole pairs, low charge carrier transfer efficiency, and low specific surface area. These insufficiencies seriously limit its application in photocatalysis. In order to improve the photocatalytic performance of CN, numerous methods including nanostructure design, elemental doping, and construction of heterojunctions with other semiconductor materials have been developed.13–19 For example, Na, K, Co, Ga, Pt, Ag, B, F, P, and S atoms were introduced into the structure of CN by multiple step calcination14–22 and enhanced photocatalytic activity were achieved. Among them, Na doping is a very popular strategy as it is cheap and easy to get, and without introduce any pollution. In recent years, many articles about Na doped CN have been reported (Table S1†).23–25 The doping process results in the distortion of CN plane, which leads to a more porous structure, more mass transfer channels and an enlarged specific surface area. However, the biggest problem of the above methods is that the introduction steps are complex and often need to be processed in multiple steps, and impurities may be introduced in the final products.
In this work, we describe a new method to enhance the photocatalytic activity of CN by controlling the solution conditions. When the photocatalytic HER performance of CN is tested, adding an appropriate amount of NaOH to the reaction system can significantly enhance the photocatalytic activity. More importantly, this method is simple, efficient and universal. It can also achieve good hydrogen production effect by using other alkali metal or alkaline earth metal hydroxides to regulate the hydrogen production solution.
2. Experiment
2.1 Preparations of photocatalysts
All reagents were of analytical grade and used without further purification.2.2 Characterization
X-ray power diffraction (PXRD) were measured on the Bruker D8 Advance X-ray diffractometer by using Ni-filtered Cu Kα radiation (λ = 1.5406 Å). The Fourier transform infrared spectroscopy (FTIR) was characterized by the spectrometer (Nicolet 6700) with the range from 4000 to 400 cm−1. The morphology of the samples was studied by a scanning electron microscope (SEM, Hitachi SU8200) and transmission electron microscope (TEM, JEOL JEM 2100F). X-ray photoelectron spectroscopy (XPS) was performed on an ESCALAB 250 photoelectron spectrometer (Thermo Fisher Scientific) by using Al K α X-ray beam. UV-Visible diffuse reflection spectra were obtained on UV-Vis diffuse reflectance spectrophotometer (UV-Vis DRS, TU-1950, Persee) with BaSO4 as the reference. Photoluminescence (PL) emission spectra were investigated on a fluorescence spectrometer (JASCO FP-8300) excited by 400 nm light at room temperature. The photocurrents were conducted in Na2SO4 aqueous solution (0.2 M) under λ ≥400 nm by an electrochemical workstation (CHI 660E, Chenhua). A standard three-electrode cell was used with Ag/AgCl electrode as the reference, Pt plate as the counter electrode, and FTO glass supported sample (0.5 × 0.5 cm2) as the working electrode. The N2 adsorption–desorption isotherms of some prepared samples were measured at 77 K on an automated gas adsorption analyzer (Autosorb iQ, Quantachrome).2.3 Photocatalytic HER tests
Visible-light-driven HER tests were performed on a commercial reaction cell (MC-SPH2O-AG, Beijing MerryChange Technology CO., LTD) connected to an online gas chromatograph (GC7900, TianMei, Ar as carrier gas, TCD as detector, column type: 5A molecular sieve). The oven and the TCD temperature are 80 and 120 °C, respectively. Automatic sampling system (spH2O) was used to inject the samples through an online six-way valve. No purge was used after the injection. A 300 W Xe lamp equipped with an optical filter (PLS-SEX 300, λ ≥400 nm) was used as the light source, and the average visible light intensity was about 100 mW cm−2 recorded by a PL-MW2000 spectroradiometer (Perfect Light Co.). In a typical run, a three-component system consisting of 10 mg of CN molecules as photocatalyst, 400 mg of EDTA-2Na (as sacrificial reagent), NaOH (with different molar amounts: 0, 2.5, 5, 7.5, 10 and 20 mM) is used to regulate hydrogen production solution in 50 mL of water (1 wt% Pt). The solution temperature was controlled at ca. 10 °C by water cooling system. The suspension was stirred for 30 min in the dark before turning on the lamp. During the HER test, the evolved H2 was measured every 30 min by online GC. For further characterization, the resulted photocatalyst was collected after the HER test and denoted as x mM NaOH/Pt–CN, where x stands for the concentration of the NaOH solution.3. Results and discussion
3.1 Characterization the structure changes of CN
As depicted in Fig. 1a, two peaks were observed at 27.7 and 13.0° in the PXRD patterns of pristine CN and as-prepared NaOH/CN, which can be attributed to the (100) and (002) diffraction of CN.26 In addition, another peak can be observed at 21.7° in the NaOH treated sample, and the peak intensity changed with the increase of NaOH concentration, indicating that the crystal structure of CN was altered in NaOH solution, this can be proved by the change of the infrared spectra. As depicted in Fig. 1b, with the addition of different concentrations of NaOH, a small peak appeared at 3400 cm−1, which belonged to the –OH group, indicating that hydroxylation occurred on the surface of CN.26,27 SEM images can also clearly observe the structural changes. The untreated CN presents a disordered and overlapping layered structure (Fig. 2a). In contrast, using 2.5 mM NaOH to treat CN (Fig. 2b), it can be observed that the lamellar CN on the surface has obviously curled, and some of them even converted to a relatively clear pore structure, When the molar amount of NaOH is increased to 7.5 mM (Fig. 2c), a more obvious pore structure can be observed, and the diameter of pores relatively larger.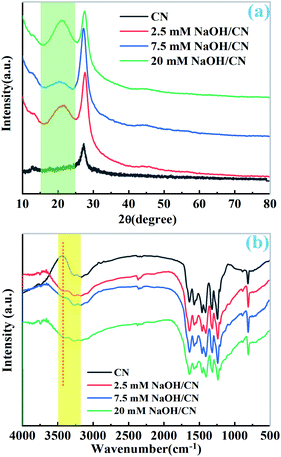 | ||
| Fig. 1 (a) The PXRD patterns of pristine CN and x mM NaOH/CN, (b) the IR spectra of pristine CN and x mM NaOH/CN. | ||
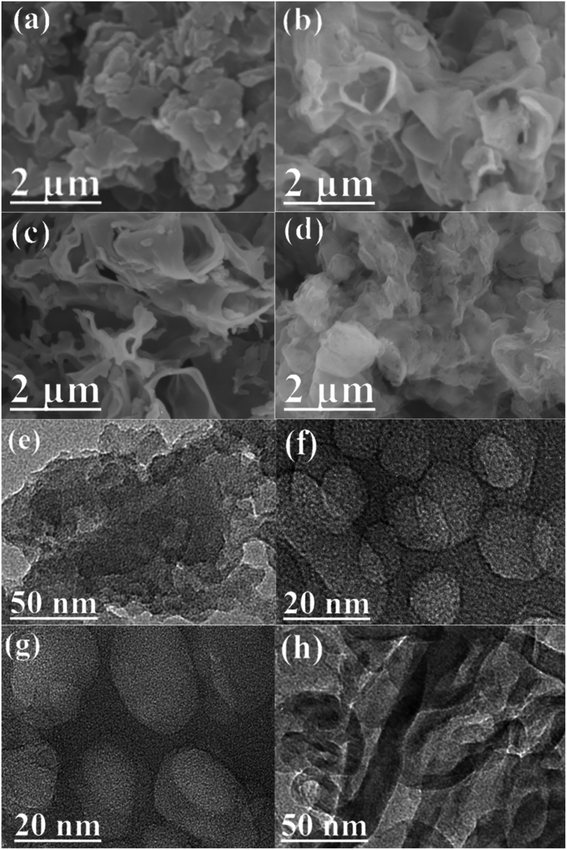 | ||
| Fig. 2 SEM images of (a) 2.5 mM NaOH/CN, (b) 5 mM NaOH/CN and (c) 7.5 mM NaOH/CN. (d) 10 mM NaOH/CN; TEM images of (e) 2.5 mM NaOH/CN, (f) 5 mM NaOH/CN and (g) 7.5 mM NaOH/CN, (h) 10 mM NaOH/CN. | ||
At the same time, TEM data also proved these changes. The layered structure of the pristine CN was stacked with each other. With the increase of NaOH molar ratio, the number of pores like structure increased, and the fusion of pores formed macrospores, as shown in Fig. 2e–g.
The results indicate that after NaOH treatment, the structure of CN exfoliates and pores are formed through hydroxylation and sodium intercalation, which leads to the change of bulk structure and may increase the specific surface area of CN.
The N2 adsorption–desorption isotherms of the samples were determined, and the BET specific surface area were determined. The BET specific surface areas of CN, 2.5 mM NaOH/CN and 7.5 mM NaOH/CN were 24.2, 24.4 and 54.4 m2 g−1, respectively, as shown in Fig. S1,† which is consistent with the results of SEM and TEM. It further proves that the surface hydroxylation of CN can increase the specific surface area, thus expanding the absorption area and improving the hydrogen production efficiency.
When the amount of NaOH increased to 10 mM, SEM (Fig. 2d) showed that the lamellar curl was more serious, and the pore structure could no longer be seen on the surface. The TEM shows that there are still tubular channels inside (Fig. 2h) and the specific surface area is increased (64.9 m2 g−1).
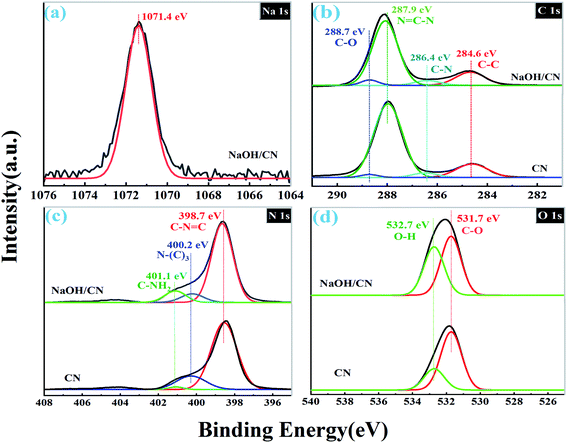
To further confirm the interaction between CN and NaOH, the catalyst was examined by XPS. As shown in Fig. 3a, the Na 1s spectrum of NaOH/CN shows only one Na 1s core energy level at ca. 1071.4 eV, which indicates the existence of the Na+ in the sample.25,28 The binding energy of Na 1s is lower than that of Na–O bond (ca.1072.6 eV),26 which indicates that sodium ions are embedded into the framework of CN to form Na–N bond instead of Na–O bond, and the electron state is uniform.15,16,28,30 There are four binding energies locate at ca. 284.6, 286.4, 287.9 and 288.7 eV from the C 1s spectra (Fig. 3b) of CN are attributed to the C–C, C–N, C![[double bond, length as m-dash]](https://www.rsc.org/images/entities/char_e001.gif) N–C and C–O bond, respectively.29,31 Compared to CN, the intensity of the core level at 288.7 eV of NaOH/CN becomes evidently higher after the modification, indicating that the surface of CN is hydroxylated. As depicted in Fig. 3c, there are three typical peaks at 398.7 eV (C–N
N–C and C–O bond, respectively.29,31 Compared to CN, the intensity of the core level at 288.7 eV of NaOH/CN becomes evidently higher after the modification, indicating that the surface of CN is hydroxylated. As depicted in Fig. 3c, there are three typical peaks at 398.7 eV (C–N![[double bond, length as m-dash]](https://www.rsc.org/images/entities/char_e001.gif) C), 400.2 eV (N–C3) and 401.1 eV (C–NH2) in the N 1s spectra. And there is no significant difference between the N 1s spectra of CN and NaOH/CN. Two binding energies locate at ca. 532.7 eV and 531.7 eV from the O 1s spectra (Fig. 3d) are ascribed to the O–H and C–O, respectively. The intensities of the two O-related peaks of NaOH/CN are higher than those of CN. This further proves that hydroxylation occurs on the surface of CN by introducing sodium hydroxide into the solution.
C), 400.2 eV (N–C3) and 401.1 eV (C–NH2) in the N 1s spectra. And there is no significant difference between the N 1s spectra of CN and NaOH/CN. Two binding energies locate at ca. 532.7 eV and 531.7 eV from the O 1s spectra (Fig. 3d) are ascribed to the O–H and C–O, respectively. The intensities of the two O-related peaks of NaOH/CN are higher than those of CN. This further proves that hydroxylation occurs on the surface of CN by introducing sodium hydroxide into the solution.
3.2 Photocatalytic HER test
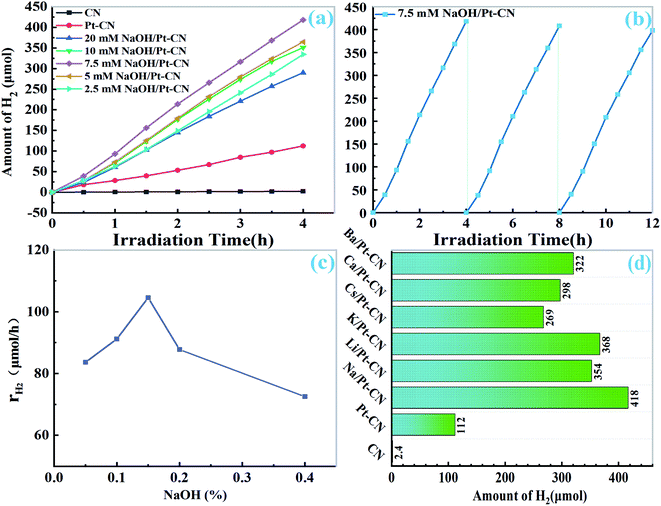
The photocatalytic activity of the catalyst under visible light (λ >400 nm) irradiation was studied. It can be clearly observed that the yield of H2 increased linearly with the illumination time. As depicted in Fig. 4a, the pristine CN can only produce a very small amount of H2 without the addition of cocatalyst. For 10 mg pristine CN, the formation rate of H2 could reach 28.1 μmol h−1. When 1.0 wt% Pt was added to CN, the H2 production rate increased slightly. However, when different amount of NaOH was added to the solution of Pt–CN system, its activity was significantly improved. For 10 mg of catalyst, the best photocatalytic H2 precipitation efficiency of 7.5 mM NaOH/Pt–CN is 104.5 μmol h−1 (10![[thin space (1/6-em)]](https://www.rsc.org/images/entities/char_2009.gif) 454 μmol g−1 h−1), which is 171 times and 3.7 times higher than that of pristine CN and Pt/CN. The activity decreases in the order of 7.5 mM NaOH/Pt–CN > 5 mM NaOH/Pt–CN > 10 mM NaOH/Pt–CN > 2.5 mM NaOH/Pt–CN > 20 mM NaOH/Pt–CN (Fig. 4a and c). The stability of 7.5 mM NaOH/Pt–CN was investigated by cyclic experiments (Fig. 4b), the system was operated three times without changing the solution and photocatalyst. At the end of each operation, the generated H2 is evacuated. The yield of H2 increased linearly with irradiation time can be found in each run (Fig. 4b), and the lines were almost parallel.
454 μmol g−1 h−1), which is 171 times and 3.7 times higher than that of pristine CN and Pt/CN. The activity decreases in the order of 7.5 mM NaOH/Pt–CN > 5 mM NaOH/Pt–CN > 10 mM NaOH/Pt–CN > 2.5 mM NaOH/Pt–CN > 20 mM NaOH/Pt–CN (Fig. 4a and c). The stability of 7.5 mM NaOH/Pt–CN was investigated by cyclic experiments (Fig. 4b), the system was operated three times without changing the solution and photocatalyst. At the end of each operation, the generated H2 is evacuated. The yield of H2 increased linearly with irradiation time can be found in each run (Fig. 4b), and the lines were almost parallel.
According to the optimum concentration of sodium hydroxide (7.5 mM), we tried to use other alkali metal hydroxides or alkaline earth metal hydroxides (LiOH, KOH, CsOH, Ca (OH)2 and Ba (OH)2) containing the same amount of OH− ion to control the solution, and tested the photocatalytic activity. As shown in Fig. 4d, the photocatalytic activity of CN was also greatly improved by the modified solution. The results show that it is an effective method to improve the activity of CN by reaction in weak alkali solution.
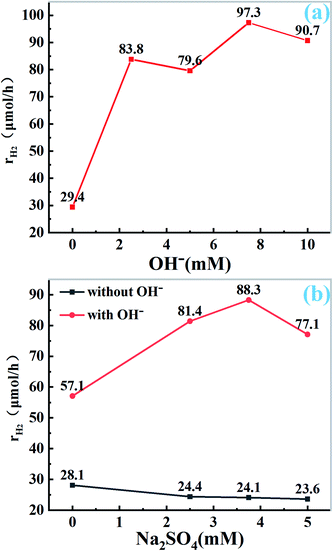
To further explore the role of OH− and Na+ ion in photocatalytic hydrogen evolution, under the premise of using 10 mg catalyst and 50 mL H2O solution (containing 400 mg EDTA-2Na, 1 wt% Pt), we seek the corresponding results through the control experiment. The total amount of Na+ is controlled by Na2SO4, and the molar amount of NaOH is changed to study the effect of OH− ion on HER under the condition of constant Na+ ion. As shown in Fig. 5a and S3a,† the catalytic activity is not improved in the absence of OH− ion. With the addition of OH− ions, the catalytic activity increased gradually, and reached the maximum when the concentration of OH− was 7.5 mM, further increase of the amount of OH−, the catalytic activity decreased. The results show that the presence of OH− ion can enhance the catalytic activity of CN, which is consistent with the results of SEM and TEM. Appropriate amount of NaOH can change the structure of carbon nitride, providing an opportunity for Na+ to enter the CN structure. However, when the content of NaOH increased further, the structure of CN was damaged, the catalytic activity did not increase. On the other hand, the concentration gradient experiment was set to verify the effect of Na+ by changing the molar amount of Na2SO4. As shown in Fig. 5b and S3b,† without NaOH treatment, the activity of HER was almost unchanged by changing the amount of Na2SO4 directly, which indicated that Na+ alone had no effect on her activity, however, when the pH value is adjusted to 8.5 (that the pH of the solution when 7.5 mM NaOH was used) by ammonia, the amount of Na+ is changed by adding Na2SO4. It is found that the activity of hydrogen production is significantly increased. With the increase of Na+ concentration, the hydrogen production activity shows the tendency of rising first and then decreasing. When the concentration of Na2SO4 is 3.75 mM, it reaches the maximum. This indicates that Na+ ions can improve the activity of Pt–CN in alkaline condition, probably because only OH− ions act first to make the surface of CN hydroxylation deformation, which is conducive to Na+ ions embedded into the structure of CN.24,26,32 The results also indicate that the increase of hydrogen production needs the combined action of alkaline environment and Na+ ions.
To further explore the promotion effect of dilute NaOH solution, the UV-Vis absorption spectra of CN and (NaOH)x/Pt–CN were measured (Fig. S4†). All samples show similar optical absorption bands. The results show that the surface hydroxylation has no effect on the light absorption of CN.
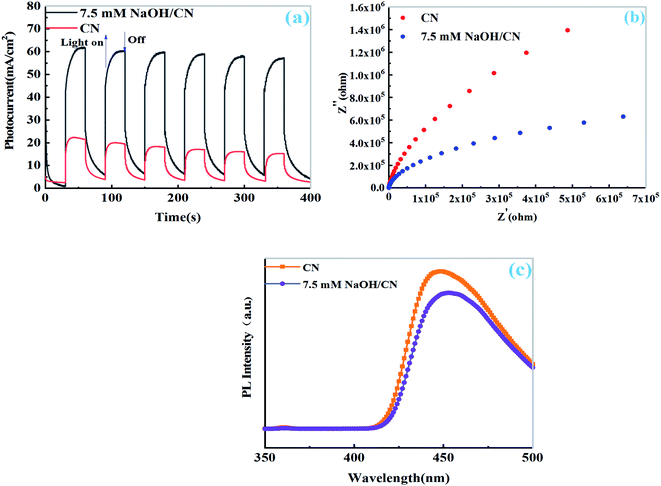
The transient photocurrent measurements of CN and 7.5 mM NaOH/Pt–CN show that the photocurrent response of both samples is obvious due to their good light absorption ability during the on/off cycle under visible light. As shown in Fig. 6a, the photocurrent of 7.5 mM NaOH/Pt–CN is obvious higher than that of CN suggesting that better visible light response and more effective photoexcited charge separation. Similarly, the EIS spectrum also provides information about electron hole recombination/separation. As shown in Fig. 6b, the smaller arc radius of 7.5 mM NaOH/Pt–CN compared with CN indicates better conductivity or more efficient electron transport capability under visible light, which is consistent with the above results. To further test this point, the PL emission spectra of the samples were measured under irradiation of 400 nm. Compared with CN, the stable PL spectrum of 7.5 mM NaOH/Pt–CN (Fig. 6c) shows low intensity, which can be attributed to the effective of the electron hole recombination is inhibited after the solution regulation by NaOH, that increases the possibility of charge separation.
3.3 Mechanism for the enhanced HER activity
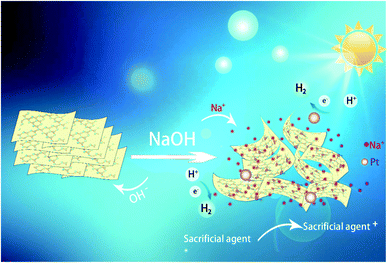
According to the above results, we propose that the enhanced photocatalytic hydrogen production activity of CN in our research is ascribed to the following factors: (a) the effect of NaOH causes the distortion the structure of CN, which makes more pore structure, provides more mass transfer channels (see Fig. 2, the SEM and TEM images) and larger specific surface area (Fig. S1†), and provides more active sites for surface reaction. (b) The Na+ ions are embedded into the framework of carbon nitride to form Na–N bond under alkaline condition, which is beneficial to reduce the electron localization and promote the carrier migration and charge carrier separation. The mechanism and activity process of photocatalytic modification with NaOH are depicted in Fig. 7.4. Conclusions
In conclusion, we have found a more convenient way to enhance the photocatalytic HER of CN through solution regulation, and determined that the optimal concentration of NaOH solution is 7.5 mM. The activity of the sample measured by this method is much higher than that of the untreated sample. After hydroxylation, CN changed from layered structure to porous structure, which expanded its specific surface area and made Na+ ions embedded into the structure of CN, which improved the charge separation efficiency and enhanced the photocatalytic activity. In addition to NaOH, hydroxides of several other alkali and alkali earth have also been used for solution control, and the results showed that they could also improve the photocatalytic hydrogen production of Pt–CN.Conflicts of interest
There are no conflicts to declare.Acknowledgements
This work was financially supported by the Natural Science Foundation of Educational Committee of Anhui Province (kj2020A0022 and kj2019A0597), excellent youth talent support program of Anhui Province (gxyq2020101), Natural Science Foundation of Anhui Province (No. 1808085MB45), the Natural Science Foundation of Anhui Province for Distinguished Young Scholars (No. 1808085J24), research team of rare earth optoelectronic functional materials (GFXK202115), 2020 National College Students' innovation and Entrepreneurship Project (202010373021).Notes and references
- W. J. Ong, L. L. Tan, Y. H. Ng, S. T. Yong and S. P. Chai, Chem. Rev., 2016, 116, 7159–7329 CrossRef CAS PubMed.
- A. Fujishima and K. Honda, Nature, 1972, 238, 37–38 CrossRef CAS PubMed.
- F. E. Osterloh, Chem. Mater., 2008, 20, 35–54 CrossRef CAS.
- X. Chen, S. Shen, L. Guo and S. S. Mao, Chem. Rev., 2010, 110, 6503–6570 CrossRef CAS PubMed.
- H. Gao, S. Yan, J. Wang and Z. Zou, Appl. Catal., B, 2014, 158–159, 321–328 CrossRef CAS.
- H. Yu, R. Shi, Y. Zhao, T. Bian, Y. Zhao, C. Zhou, G. I. N. Waterhouse, L. Z. Wu, C. H. Tung and T. Zhang, Adv. Mater., 2017, 29, 16 Search PubMed.
- H. Gao, S. Yan, J. Wang, Y. A. Huang, P. Wang, Z. Li and Z. Zou, Phys. Chem. Chem. Phys., 2013, 15, 18077–18084 RSC.
- G. Zhang, S. Zang and X. Wang, ACS Catal., 2015, 5, 941–947 CrossRef CAS.
- F. S. Guo, B. Hu, C. Yang, J. H. Zhang, Y. Hou and X. C. Wang, Adv. Mater., 2021, 20, 2101466 CrossRef PubMed.
- L. Lin, Z. Lin, J. Zhang, X. Cai, W. Lin, Z. Yu and X. C. Wang, Nat. Catal., 2020, 3, 649–655 CrossRef CAS.
- H. W. Li, W. Xu, J. J. Qian and T. T. Li, Chem. Commun., 2021, 57, 6987–6990 RSC.
- X. Wang, A. R. Dong, L. L. Chai, J. Y. Ding, L. Zhong, T. T. Li, Y. Hu, J. J. Qian and S. M. Huang, J. Power Sources, 2020, 467, 228302 CrossRef CAS.
- L. Lin, Z. Yu and X. Wang, Angew. Chem., Int. Ed., 2019, 58, 6164–6175 CrossRef CAS PubMed.
- J. Jiang, S. Cao, C. Hu and C. Chen, Chin. J. Catal., 2017, 38, 1981–1989 CrossRef CAS.
- Y. Cao, S. Chen, Q. Luo, H. Yan, Y. Lin, W. Liu, L. Cao, J. Lu, J. Yang, T. Yao and S. Wei, Angew. Chem., Int. Ed., 2017, 56, 12191–12196 CrossRef CAS PubMed.
- W. Jiang, Y. Zhao, X. Zong, H. Nie, L. Niu, L. An, D. Qu, X. Wang, Z. Kang and Z. Sun, Angew. Chem., Int. Ed., 2021, 60, 6124–6129 CrossRef CAS PubMed.
- Z. Wang, X. Peng, S. Tian and Z. Wang, Mater. Res. Bull., 2018, 104, 1–5 CrossRef CAS.
- P. Murugesan, S. Narayanan, M. Manickam, P. K. Murugesan and R. Subbiah, Appl. Surf. Sci., 2018, 450, 516–526 CrossRef CAS.
- S. Cao, Q. Huang, B. Zhu and J. Yu, J. Power Sources, 2017, 351, 151–159 CrossRef CAS.
- Y. Di, X. Wang, A. Thomas and M. Antonietti, ChemCatChem, 2010, 2, 834–838 CrossRef CAS.
- Y. Li, W. Qu, L. Huang, P. Li, F. Zhang, D. Yuan, Q. Wang, H. Xu and H. Li, J. Inorg. Organomet. Polym. Mater., 2017, 27, 1674–1682 CrossRef CAS.
- H. Nie, M. Ou, Q. Zhong, S. Zhang and L. Yu, J. Hazard. Mater., 2015, 300, 598–606 CrossRef CAS PubMed.
- Y. Zhang, S. Zong, C. Cheng, J. Shi, X. Guan, Y. Lu and L. Guo, Int. J. Hydrogen Energy, 2018, 43, 13953–13961 CrossRef CAS.
- D. Liu, C. Qiu, M. Li, Y. Xie, L. Chen, H. Lin, J. Long, Z. Zhang and X. Wang, Catal. Sci. Technol., 2019, 9, 3270–3278 RSC.
- S. Wu, Y. Yu, K. Qiao, J. Meng, N. Jiang and J. Wang, J. Photochem. Photobiol., A, 2021, 406, 1 CrossRef.
- S. Yu, J. Li, Y. Zhang, M. Li, F. Dong, T. Zhang and H. Huang, Nano Energy, 2018, 50, 383–392 CrossRef CAS.
- C. Hu, W.-F. Tsai, W.-H. Wei, K.-Y. Andrew Lin, M.-T. Liu and K. Nakagawa, Carbon, 2021, 175, 467–477 CrossRef CAS.
- F. Guo, J. Chen, M. Zhang, B. Gao, B. Lin and Y. Chen, J. Mater. Chem. A, 2016, 4, 10806–10809 RSC.
- Z. Sun, J. M. T. A. Fischer, Q. Li, J. Hu, Q. Tang, H. Wang, Z. Wu, M. Hankel, D. J. Searles and L. Wang, Appl. Catal., B, 2017, 216, 146–155 CrossRef CAS.
- H. Wang, M. Li, H. Li, Q. Lu, Y. Zhang and S. Yao, Mater. Des., 2019, 162, 210–218 CrossRef CAS.
- J. Li, B. Shen, Z. Hong, B. Lin, B. Gao and Y. Chen, Chem. Commun., 2012, 48, 12017 RSC.
- T. Sano, S. Tsutsui, K. Koike, T. Hirakawa, Y. Teramoto, N. Negishi and K. Takeuchi, J. Mater. Chem. A, 2013, 1, 6489–6496 RSC.
Footnote |
| † Electronic supplementary information (ESI) available. See DOI: 10.1039/d1ra06436c |
| This journal is © The Royal Society of Chemistry 2021 |

