 Open Access Article
Construction and properties of the antibacterial epitaxial transition layer on a zirconia ceramic surface
Xiuju Liu a,
Qiuli Chengb,
Yanlin Zhuc,
Shiyang Yua,
Yanyan Houa,
Zhanchen Cui
 *b and
Song Zhu*a
aDepartment of Prosthetic Dentistry, School and Hospital of Stomatology, Jilin University, Changchun 130021, P. R. China. E-mail: zhusong1965@163.com
bState Key Lab of Supramolecular Structure and Materials, College of Chemistry, Jilin University, Changchun 130021, P. R. China
cDepartment of Dental Implantology, School and Hospital of Stomatology, Jilin University, Changchun, P. R. China
First published on 29th October 2021
Abstract
Secondary caries is one of the main causes of dental zirconia restoration failure in the clinic. Therefore, it is urgent to improve the antibacterial performance of zirconia ceramics to reduce the occurrence of secondary caries. In this study, a quaternary ammonium compound antibacterial polymer was innovatively synthesized by solution polymerization with a quaternary ammonium salt monomer as the antibacterial component. The antibacterial epitaxial transition layer was successfully prepared on the surface of zirconia ceramics by the hydroxyl group on HEMA reacting with the siloxane group in the KH570 hydrolysate, which makes the antibacterial polymer indirectly chemically combine with the silicate epitaxial transition layer. The antibacterial epitaxial transition layer exhibited excellent mechanical properties, satisfactory biocompatibility and significant antibacterial effects, and the maximum antibacterial rate is 99%. The antibacterial epitaxial transition layer plays an important role in preventing secondary caries and improving the success rate of clinical zirconia ceramic restorations.
1 Introduction
Because of the excellent biocompatibility, good aesthetic characteristics, high fracture toughness and mechanical strength produced by the phase transformation toughening mechanism, zirconia ceramics have become a hot topic in oral materials science. However, one of the main reasons for clinical failure of zirconia restoration is secondary caries.1 Secondary caries is defined as “lesions at the edge of existing restorations”.2 Secondary and primary caries exhibit no differences in etiology. They are all chronic infectious diseases caused by bacteria. When a crack occurs between the prosthesis and the tooth tissue, and saliva enters the crack, bacteria adhering to saliva invade the entire crack. When nutrients and time are sufficient, bacteria propagate and produce acid, which leads to demineralization of the tooth tissue and formation of secondary caries. Due to the differences in the thermal expansion coefficient of zirconia ceramics, tooth tissue and adhesive, cold and hot stimulation changes in the oral environment will cause microcracks at the edge of the restoration, which will result in bacterial invasion and secondary caries. Bacteria and plaque biofilms are essential factors for secondary caries.3,4 Therefore, improving the antibacterial properties of zirconia ceramic restorations, inhibiting the invasion of bacteria, killing bacteria at the edge of cracks, and sealing edges are important measures to prevent secondary caries.The simplest way to endow restorative materials with antibacterial properties is to add widely recognized antibacterial agents, including nano silver, chlorhexidine, quaternary ammonium salt, triclosan, chitosan, antibiotics, etc. At present, the main antibacterial agents are soluble and polymerizable antibacterial agents. The soluble antibacterial agent is dispersed in the material by physical dissolution, and produces antibacterial effects by continuous exusion. This method is simple and easy to operate, but it is easy to produce a “sudden release effect” due to its failure to control the release kinetics, which can not guarantee the long-term antibacterial effect. In addition, the continuous separation of antibacterial components makes the material appear to have a void structure, which destroys the integrity of the bonding interface and the durability of the bonding effect, and reduces the mechanical properties of the material.5 In the 1990s, Imazato et al.6 introduced the concept of a “polymerizable antibacterial agent” into the field of dental materials. “Polymerizable antibacterial agent” refers to an antibacterial agent that has the function of polymerization. Based on chemical methods, the antibacterial functional groups are firmly combined with the polymer chain of the resin matrix, and the contact antibacterial effect is stable and independent of the release of antibacterial active ingredients. These agents exhibit great advantages and good application prospects to achieve stable and long-term antibacterial modification of resin materials and overcome the adverse effects of traditional soluble antibacterial agents on the mechanical properties and aesthetic properties of the materials.7
Quaternary ammonium compounds (QACs) are broad-spectrum antibacterial agents of cationic surfactants. The materials containing these antibacterial agents exhibit a long-lasting antibacterial effect when in contact with bacteria, and do not release antibacterial components. The antibacterial properties and biocompatibility of QACs are closely related to their chemical structures. Studies show that within a certain range, the antibacterial activity of QACs increases with the length of the hydrophobic alkyl chain on the nitrogen atom,8,9 and excessive hydrophobicity often prevents membrane penetration and increases cytotoxicity.10 Following the theory of a “polymerizable antibacterial agent”, some scholars combined quaternary ammonium group with methacryloyl group for the first time in 1994, and successfully developed a QACs antibacterial monomer that can polymerize with a traditional methacryloyl monomer, namely: methacryloyloxydecyl pyridinium bromide (MDPB).11 Subsequently, a series of QACs antibacterial agents have been synthesized, which have long-term and lasting antibacterial effects and prevent the occurrence of secondary caries.12–14
QACs are a general term for a class of compounds that has been widely studied due their relatively low toxicity and broad antibacterial spectrum. Compared with other antibacterial agents, QACs have the advantages of good biocompatibility and long-lasting biological effects, and are often used in the surface disinfection of medical devices, skin and mucous membrane disinfection and oral cleaning.15–17 In recent years, QACs have been widely used in the antibacterial modification of oral restorative materials.18–25
In recent years, some scholars have added QACs to composites such as resin, adhesive system, acrylic resin and dental pulp materials.26,27 However, the application of QACs are not limited to these. Several studies had incorporated QACs into bone cements, titanium implants, pulp capping materials, cavity disinfectant, resin cement, etc.7,18,23,24 These studies have shown that QACs possess antimicrobial activities against bacteria and fungi including S. mutans, L. acidophilus, C. albicans, E. faecalis which could decrease the occurrence of secondary caries. The application of QACs in dental materials is very promising. QACs have been also proved has good biocompatibility and do not represent a threat to human health.
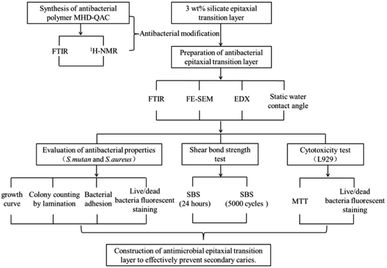
In previous work, we successfully constructed a silicon epitaxial transition layer on the surface of zirconia ceramics, which improved the shear bond strength and aging resistance of zirconia ceramic restorations, and exhibited good biological safety.26 To effectively prolong the service life of zirconia ceramic restorations and reduce the incidence of secondary caries, a quaternary ammonium salt antibacterial polymer was designed and synthesized in this study. The antibacterial polymer was chemically combined with the silane coupling agent KH570 by using –OH groups on HEMA. The shear bond strength of the zirconia ceramic restoration was improved, and its antibacterial property was effective. The antibacterial polymer was added into the 3 wt% epitaxial transition layer at the mass fractions of 0 wt% (control group), 1 wt%, 3 wt%, 5 wt% and 7 wt%, and its antibacterial effect and biocompatibility were evaluated. Fig. 1 presents the design and flow chart of this experiment.
2 Materials and methods
2.1 Synthesis of quaternary ammonium salt antibacterial polymer
The polymers are synthesized by simple radical solution polymerization. Methyl methacrylate (MMA, Alfa Aesar Sigma Company, USA) (50 mmol, 5.006 g), hydroxyethyl methacrylate (HEMA, Sigma Company, USA) (20 mmol, 2.603 g) and dimethylaminoethyl methacrylate (DMA, Sigma Company, USA) (30 mmol, 4.716 g) were mixed in a 250 ml flask, tetrahydrofuran (THF, Sigma company, USA) (100 ml) was added, and the mixture was heated at 70 °C. After nitrogen degassing for 30 minutes, azobisisobutyronitrile (AIBN, Sigma Company, USA) (1 mmol, 0.164 g) was added into the mixture as an initiator. The polymerization was performed at 70 °C for 12 hours. The reaction mixture was purified in petroleum ether, and the unreacted monomers (MMA, DMA and HEMA) were removed. After vacuum drying, the polymer MMA-HEMA-DMA was obtained, which was labeled MHD. MHD (1.232 g) was dissolved with excess bromododecane (Alfa Aesar, USA) (0.374 g) in a 50 ml flask containing 15 ml nitrile and reacted at 80 °C for 24 hours. Then, the product was dissolved in chloroform, precipitated in hexane and purified. The polymer MHD-QAC was obtained after drying at 45 °C in a vacuum oven for 24 hours. 1H NMR spectra were analyzed by a Bruker-AVANCE nuclear magnetic resonance spectrometer (AVANCEIII500, Switzerland), and Fourier transform infrared (FT-IR) spectra were recorded with a Fourier transform infrared spectrometer (VERTEX 80V; Bruker, Germany).2.2 Construction of the antibacterial epitaxial transition layer on zirconia ceramic surface
The hydrolysate consisting of ethyl orthosilicate (6.0 g), anhydrous ethanol (30.0 g), glacial acetic acid (0.1 g) and deionized water (0.3 g) was stirred by magnetic force for 1 hour. The silane coupling agent γ-methacryloxypropyltrimethoxysilane (KH570) (3.0 g) with a C![[double bond, length as m-dash]](https://www.rsc.org/images/entities/char_e001.gif) C group was dropped into the above mixed solution, and the solution was sufficiently hydrolyzed by magnetic stirring for 24 hours to prepare the KH570 hydrolysate.
C group was dropped into the above mixed solution, and the solution was sufficiently hydrolyzed by magnetic stirring for 24 hours to prepare the KH570 hydrolysate.
2.3 Surface characterization
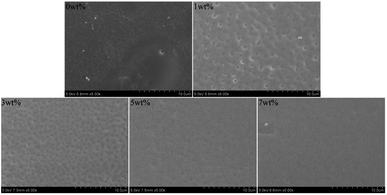
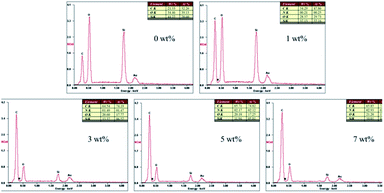
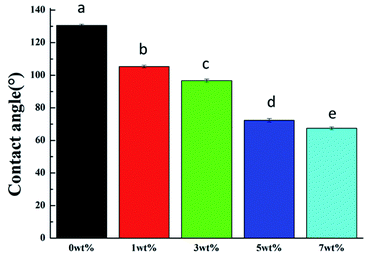
The zirconia modified by the MHD-QAC antibacterial epitaxial transition layer was analyzed by a Fourier transform infrared (FT-IR) spectrometer (VERTEX 80V; Bruker, Germany). The surface morphologies of all samples were examined by scanning electron microscopy (SEM, S-4800, Hitachi, Japan). The elemental compositions of the samples were analyzed by energy-dispersive X-ray spectroscopy (EDX, QUANTAX 400, Luke AXS Co., Ltd., Germany). The static water contact angle was determined by a droplet imaging analysis system (DSA20, MK2 KR SS Edward Keller Company, Germany) by the hanging drop method using deionized water on the surface of the samples at different positions.2.4 Antibacterial activity test
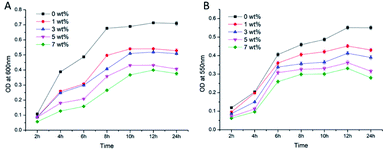
The sterilized specimens were placed in sterile centrifuge tubes containing 4 ml bacterial suspension (1 × 10⁹ CFU L−1) and then incubated in a bacteria incubator (SLI-1200, SANYO, Japan) for 48 hours at a relative humidity of greater than 90% and a temperature of 37 °C. The co-culture specimen was removed, and the specimen was gently washed with PBS buffer to remove non-adherent bacteria. The specimens were then replaced in a centrifuge tube containing fresh liquid BHI medium and cultured for 2 hours, 4 hours, 6 hours, 8 hours, 10 hours, 12 hours and 24 hours. The co-cultured centrifuge tube was ultrasonically vibrated for 10 minutes so that the bacteria adhering to the specimen were shaken down. Then, the absorbance value (OD) of co-culture bacterial suspensions was measured using a microplate reader (BL340, Biotech, USA) at 600 nm. The above experiment was repeated three times.
where R is the antibacterial rate; A is the colony number of the experimental specimens; and B is the colony number of the control group.
Referring to the national HG/T 3950-2007 about antibacterial coating antibacterial standard, the antibacterial effect was graded (Table 1). The experimental results must meet the following two conditions: (1) the above experimental operation was repeated three times, and the average value was taken after statistical analysis; and (2) the number of viable colonies of three parallel specimens in the same group should equal the in accordance with: maximum value − minimum value/average value ≤ 0.3.
| Antibacterial rate | Antibacterial grade | Antibacterial effect |
|---|---|---|
| ≥99 | I | Strong antibacterial |
| 90–99 | II | Antibacterial |
| <90 | 0 | No antibacterial |
2.5 Antibacterial adhesion test
(1) Bacterial adhesion plate colony countThe sterilized specimens were placed into tubes containing 2 ml bacterial suspension (1 × 10⁹ CFU L−1) and cultured in an anaerobic environment for 48 hours. The specimens were removed and rinsed with sterile PBS buffer for 10 seconds to remove the non-adherent bacteria from the surface. The adherent bacteria were detached ultrasonically from the specimens in 10 ml PBS buffer for 5 minutes. The washing solution was diluted 102 times by gradient and 50 μl was evenly coated on BHI agar medium plates. After 48 hours of anaerobic culture, the colonies were counted.
(2) FE-SEM observation of the adherent bacteria
The sterilized specimens were placed in 24-well plates, and a 2 ml bacterial suspension (1 × 10⁹ CFU L−1) was added to each well. After co-cultured in an anaerobic environment for 48 hours, the specimens were removed and washed gently with sterile PBS buffer to remove the non-adherent bacteria. Then, the co-cultured specimens were sequentially placed in 2.5% glutaraldehyde (Sigma, USA) for 8 hours at 4 °C. Next, the specimens were placed in 30%, 50%, 70%, 80%, 90%, 100% and 100% ethanol solutions for gradient dehydration, with incubation in each solution lasting 15 minutes. The specimens were dried by a vacuum dryer at a critical point of CO2 and sprayed with gold coating. Finally, FE-SEM was used to observe the morphology of adherent bacteria on the surface of the specimen.
2.6 Live/dead bacteria fluorescent staining
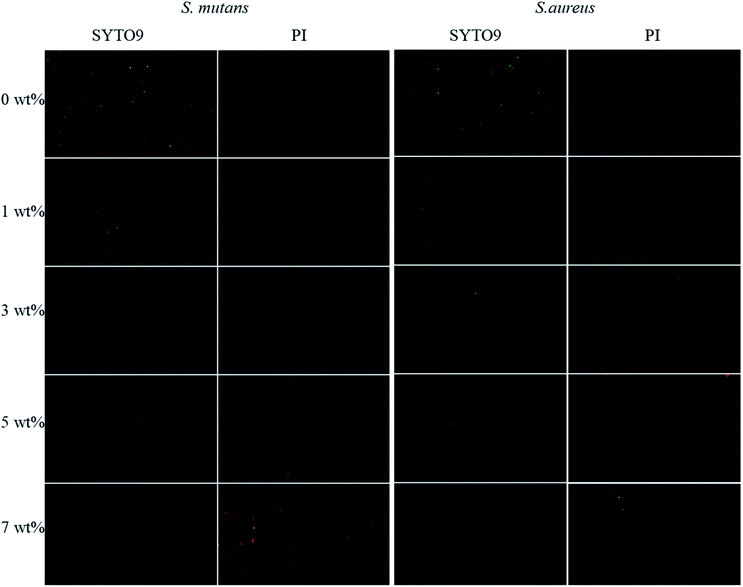
The sterilized specimens were placed in a 24-well plate, and 2 ml bacterial suspension (1 × 10⁹ CFU L−1) was added to each well. After culture for 48 hours in an anaerobic environment, the specimens were removed, gently washed with sterile PBS buffer to remove the floating bacteria on the surface of the specimens, and then moved to a new 24-well plate. The LIVE/DEAD BacLight Bacterial Viability Kit (Thermo Science Fisher, United States) was added to the surface of specimens of each group evenly, and the plate was incubated at room temperature for 15 minutes in the darkroom. The specimens were placed under a fluorescence microscope (Olympus, Japan), and the bacteria were observed by dual-channel scanning. The green channel (excitation wavelength 488 nm, green luminescence) was used to observe the living bacteria with intact cell membrane (stained with SYTO9 to emit green fluorescence). The red channel (excitation wavelength 543 nm, red luminescence) was used to observe the dead bacteria with damaged cell membranes (stained with propidium iodide to show red fluorescence).The culture environment and culture time described in these antimicrobial experiments were for S. mutan. In the same steps as described above, the bacteria were replaced with Staphylococcus aureus (S. aureus, ATCC25922, Strain Preservation Center of the United States), and the medium, culture cycle and culture conditions were replaced with LB medium (Beijing Solarbio Technology Co., Ltd., China), 24 hours and an aerobic environment, respectively.
2.7 Shear bond strength test
2.8 Shear bond strength
The shear bond strength (SBS) was measured with a universal testing machine (AG-Xplus10 KN; Shimadzu, Kyoto, Japan). A constant load of 1 kN was applied with a cross-head speed of 1.0 mm min−1 until failure occurred. The SBS was calculated according to the following formula: P = F/S, where P is the SBS (MPa), F is the maximum shear force (N), and S is the bonding area (mm2).2.9 Cytotoxicity test in vitro
![[thin space (1/6-em)]](https://www.rsc.org/images/entities/char_2009.gif) :
:![[thin space (1/6-em)]](https://www.rsc.org/images/entities/char_2009.gif) 1 cm2, and the plates were placed in a CO2 incubator (MCO-20IL, Sanyo, Japan) at 37 °C for 72 hours to prepare the extraction solution.
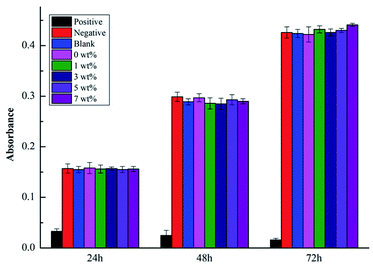
1 cm2, and the plates were placed in a CO2 incubator (MCO-20IL, Sanyo, Japan) at 37 °C for 72 hours to prepare the extraction solution.Mouse fibroblast L929 (L929, Cells Resource Center, Shanghai Institutes of Biological Science, China) cell suspension in logarithmic growth phase at a concentration of 2 × 10⁴ ml−1 was added into a 96-well plate (Costa, USA) with 2000 cells per well. The following eight groups were then used for subsequent experiments: blank control (pure high glucose medium), negative control (PE), positive control (phenol), 0 wt% group, 1 wt% group, 3 wt% group, 5 wt% group and 7 wt% group. The marked 96-well plates were placed in a cell incubator (5% CO2, 95% humidity). After incubation for 24 hours at 37 °C, the supernatant was removed, and 100 μl extraction solution was added into each well. After culture for 24, 48 and 72 hours, the cell culture was terminated, and the cell culture medium in the pore plate was extracted and washed gently with PBS. Next, 20 μl MTT solution was added to each well and incubated for 4 hours. The MTT-containing medium was then removed and replaced by 150 μl dimethyl sulfoxide. The absorbance (A) was measured at 490 nm with a microplate reader (BL340, Biotech, USA). The relative growth rate (RGR) of the cells was calculated using the following formula: RGR = Aexperimental group/Ablank control group × 100%. According to the relationship between the relative growth rate and cytotoxicity classification (Table 2),29 the toxicity grade and safety standard of the specimen were judged.
| RGR | Toxicity grade | Safety standards |
|---|---|---|
| ≥100 | 0 | Safe |
| 75–99 | I | Safe |
| 50–74 | II | Insecurity |
| 25–49 | III | Insecurity |
| 1–24 | IV | Insecurity |
| <1 | V | Insecurity |
2.10 Calcein-AM and PI live/dead cell staining
The logarithmic growth phase of L929 cells at a concentration of 5 × 10⁴ ml−1 was added to 6-well plates at 2 ml per well. After culturing for 24–48 hours at 37 °C and 5% CO2, the supernatant of the experimental group was replaced by the material extract, while the blank control group was replaced by fresh medium, and co-cultured for 24 hours. Then, the liquid in the orifice plate was discarded, and the plate was rinsed gently with sterile PBS buffer. Calcein-AM and PI dye solution were added to the 6-well plates at 1 ml per well. After incubation for 15 minutes, the cells were observed and recorded using an inverted fluorescence microscope (Olympus, Japan). Finally, the proportion of living cells was calculated.2.11 Statistical analysis
The statistical analyses were performed using Statistical Package for the Social Sciences (SPSS) statistical software (SPSS version 22.0, SPSS Inc., Chicago, IL, USA). After testing for normality and homoscedasticity using the Kolmogorov–Smirnov test, ANOVA was used to test the significance of the experimental data.3 Results and discussion
3.1 Synthesis and characterization of MHD-QAC
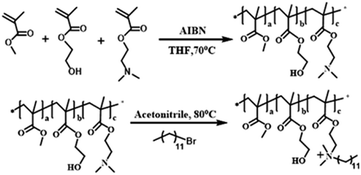
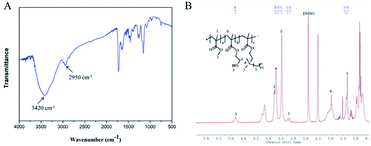
Fig. 2 shows the synthetic routes of the antibacterial copolymer MHD-QAC. Fig. 3 shows the FT-IR (A) and 1H NMR spectra (B) of MHD-QAC. As presented in Fig. 3A, the absorption peak at 3420 cm−1 is the characteristic stretching vibration peak of the hydroxyl group, and 2950 cm−1 is the stretching vibration peak of the methyl group. As shown in Fig. 3B, the proton resonance at 3.37 ppm is from the methyl group of bromododecane, that at 3.58 ppm is from the methyl group of MMA and that at 4.86 ppm is from hydroxyl hydrogen atom of HEMA. In conclusion, the FT-IR and 1H NMR results indicated that the MHD-QAC copolymer was innovatively designed and synthesized.The MHD-QAC polymers are synthesized by simple radical solution polymerization. In the preliminary exploration stage, we tried different molar ratios of M![[thin space (1/6-em)]](https://www.rsc.org/images/entities/char_2009.gif) :
:![[thin space (1/6-em)]](https://www.rsc.org/images/entities/char_2009.gif) H
H![[thin space (1/6-em)]](https://www.rsc.org/images/entities/char_2009.gif) :
:![[thin space (1/6-em)]](https://www.rsc.org/images/entities/char_2009.gif) D. The properties of polymers with different M
D. The properties of polymers with different M![[thin space (1/6-em)]](https://www.rsc.org/images/entities/char_2009.gif) :
:![[thin space (1/6-em)]](https://www.rsc.org/images/entities/char_2009.gif) H
H![[thin space (1/6-em)]](https://www.rsc.org/images/entities/char_2009.gif) :
:![[thin space (1/6-em)]](https://www.rsc.org/images/entities/char_2009.gif) D molar ratios, such as glass transition temperature, are different. When the M
D molar ratios, such as glass transition temperature, are different. When the M![[thin space (1/6-em)]](https://www.rsc.org/images/entities/char_2009.gif) :
:![[thin space (1/6-em)]](https://www.rsc.org/images/entities/char_2009.gif) H
H![[thin space (1/6-em)]](https://www.rsc.org/images/entities/char_2009.gif) :
:![[thin space (1/6-em)]](https://www.rsc.org/images/entities/char_2009.gif) D molar ratio is 50
D molar ratio is 50![[thin space (1/6-em)]](https://www.rsc.org/images/entities/char_2009.gif) :
:![[thin space (1/6-em)]](https://www.rsc.org/images/entities/char_2009.gif) 20
20![[thin space (1/6-em)]](https://www.rsc.org/images/entities/char_2009.gif) :
:![[thin space (1/6-em)]](https://www.rsc.org/images/entities/char_2009.gif) 30, the polymers have certain thermal stability. DMA is a monomer with antibacterial properties after quaternization. There are hydroxyl groups in HEMA that can react to KH570. So, we choose to copolymerize DMA with MMA and HEMA in order to combine the antibacterial polymer with the surface of zirconia ceramics in the form of chemical bond.
30, the polymers have certain thermal stability. DMA is a monomer with antibacterial properties after quaternization. There are hydroxyl groups in HEMA that can react to KH570. So, we choose to copolymerize DMA with MMA and HEMA in order to combine the antibacterial polymer with the surface of zirconia ceramics in the form of chemical bond.
3.2 Characterization of the antibacterial epitaxial transition layer
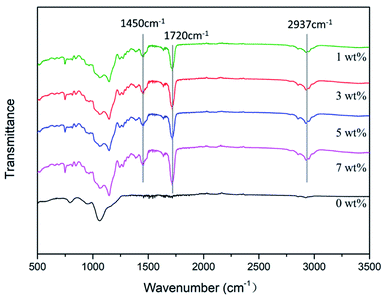
![[double bond, length as m-dash]](https://www.rsc.org/images/entities/char_e001.gif) O bond in MMA is observed at 1720 cm−1, and the obvious absorption peak of the amino N–H bond is observed at 2937 cm−1. Therefore, an antimicrobial epitaxial transition layer containing MHD-QAC was successfully prepared on the zirconia surface. MHD-QAC was mixed with KH570 hydrolysate to act on the silicate epitaxial transition layer. In the blend system, the hydroxyl group on HEMA reacts with the siloxane group in the KH570 hydrolysate, which makes the antibacterial polymer indirectly combine with the silicate epitaxial transition layer.
O bond in MMA is observed at 1720 cm−1, and the obvious absorption peak of the amino N–H bond is observed at 2937 cm−1. Therefore, an antimicrobial epitaxial transition layer containing MHD-QAC was successfully prepared on the zirconia surface. MHD-QAC was mixed with KH570 hydrolysate to act on the silicate epitaxial transition layer. In the blend system, the hydroxyl group on HEMA reacts with the siloxane group in the KH570 hydrolysate, which makes the antibacterial polymer indirectly combine with the silicate epitaxial transition layer.
3.3 Antibacterial activity
Numerous methods are available to evaluate the antibacterial properties of materials. At present, the generation of bacterial growth curves, colony counting by film tests, bacterial adhesion and live/dead bacteria fluorescent staining are the most commonly used experimental methods.30 S. mutans and S. aureus were selected as experimental strains to evaluate the antibacterial properties of the antibacterial epitaxial transition layer on the surface of zirconia ceramics based on the above four methods. Streptococcus mutans is the main cariogenic bacterium.31,32 and is classified as an anaerobic bacterium; Staphylococcus aureus is a systemic pathogen related to infection33 and is an aerobic bacterium. These selected strains were representative of the oral microecological environment.![[x with combining macron]](https://www.rsc.org/images/entities/i_char_0078_0304.gif) ± s)a
± s)a
| Group | 0 wt% | 1 wt% | 3 wt% | 5 wt% | 7 wt% |
|---|---|---|---|---|---|
| a Note: the lower case letters indicated statistical differences within a row (P < 0.05). | |||||
| Colony number | 1216 ± 39.6a | 85 ± 6.2b | 46 ± 3.5c | 9 ± 0.8d | 7 ± 0.4d |
| Antibacterial rate | 0 | 93.01 | 96.22 | 99.26 | 99.42 |
![[x with combining macron]](https://www.rsc.org/images/entities/i_char_0078_0304.gif) ± s)a
± s)a
| Group | 0 wt% | 1 wt% | 3 wt% | 5 wt% | 7 wt% |
|---|---|---|---|---|---|
| a Note: the lower case letters indicated statistical differences within a row (P < 0.05). | |||||
| Colony number | 854 ± 25.3a | 72 ± 5.2b | 38 ± 2.1c | 6 ± 0.5d | 5 ± 0.4d |
| Antibacterial rate | 0 | 91.57 | 95.56 | 99.30 | 99.41 |
The antibacterial results of the adhesion test were shown in Tables 5 and 6. With the increase of MHD-QAC antibacterial polymer content, the number of bacterial colonies of the two bacteria decreased significantly, in which the 0 wt% group was the most and the 7 wt% group was the least. No significant difference was noted between the 5 wt% and 7 wt% groups (P > 0.05). The antibacterial rate results showed that the antibacterial rates of the 5 wt% and 7 wt% groups were greater than 99%, which belonged to grade I. These results indicate that the two groups exhibited strong antibacterial activity. The antibacterial rates of the 1 wt% and 3 wt% groups belong to grade II, showing antibacterial activity. The bacterial adhesion test results demonstrated that a large number of bacteria covered the surface of the 0 wt% group (without the addition of antibacterial agent). With increasing MHD-QAC content, the number of bacteria decreased significantly.
![[x with combining macron]](https://www.rsc.org/images/entities/i_char_0078_0304.gif) ± s)a
± s)a
| Group | 0 wt% | 1 wt% | 3 wt% | 5 wt% | 7 wt% |
|---|---|---|---|---|---|
| a Note: the lower case letters indicated statistical differences within a row (P < 0.05). | |||||
| Colony number | 1106 ± 30.3a | 70 ± 6.8b | 37 ± 3.2c | 6 ± 0.5d | 4 ± 0.3d |
| Antibacterial rate | 0 | 93.67 | 96.65 | 99.46 | 99.64 |
![[x with combining macron]](https://www.rsc.org/images/entities/i_char_0078_0304.gif) ± s)a
± s)a
| Group | 0 wt% | 1 wt% | 3 wt% | 5 wt% | 7 wt% |
|---|---|---|---|---|---|
| a Note: the lower case letters indicated statistical differences within a row (P < 0.05). | |||||
| Colony number | 626 ± 30.3a | 56 ± 3.2b | 22 ± 2.5c | 4 ± 0.8d | 2 ± 0.2d |
| Antibacterial rate | 0 | 91.05 | 96.49 | 99.36 | 99.68 |
(2) FE-SEM analysis
The FE-SEM results of the bacterial morphology on the surface of the antibacterial epitaxial transition layer specimens are shown in Fig. 9. On the surface of the 0 wt% sample without MHD-QAC, the bacteria grew well, the bacterial morphology was regular, and the cell wall was complete and smooth. In the 1 wt% group, the bacterial morphology was broken, and the cell wall was rough or incomplete, and slightly concave or even dissolved. Most of the bacteria in the 3 wt%, 5 wt% and 7 wt% groups had serious cell wall damage, cytoplasmic leakage and bacterial dissolution.
Based on the above experimental results, the antibacterial epitaxial transition layer has a good bactericidal effect and antibacterial adhesion, and the antibacterial effect of the 5 wt% and 7 wt% groups is significant.
Although the antibacterial mechanism of QACs has not been determined, it is generally believed to be “contact sterilization”.34–38 The antibacterial effect of QACs mainly includes two processes: electrostatic adsorption and membrane destruction. Generally, the surface of bacteria has a negative charge and is stable due to divalent cations such as Mg2+ and Ca2+. The negative charge on the surface of Gram-positive bacteria is related to the composition of cell wall acid, polysaccharide and cell membrane, while the lipopolysaccharide and cell membrane of Gram-negative bacteria are the main sources of negative charge.39 The interaction between macromolecules and Gram-positive bacteria cells may be more effective because their outer layer of polyglycol is fully and loosely packed to promote the polymer chain to penetrate into the cell and interact with the cell plasma membrane. On the other hand, the cells of Gram-negative bacteria have an additional membrane with a bilayer phospholipid structure, which protects the cell plasma membrane to a greater extent from the effect of polymeric biocides.38 In the structure of the quaternary ammonium salt antibacterial monomer, the hydrophilic head of the quaternary ammonium group with a positive charge can replace the stable Mg2+ and Ca2+ cations on the bacterial surface, and adsorb on the surface of the negatively charged bacterial cell membrane by electrostatic interaction. Most of the antibacterial activities of quaternary ammonium salts are affected by their surface activity characteristics and hydrophobic chain length.35–37 The hydrophobic long carbon chain penetrates the cell wall of bacteria by combining with the cell wall components. It interacts with the phospholipid bilayer and membrane protein on the cell membrane, destroys the cell membrane, and causes the enzyme and metabolic intermediate products in the bacteria to overflow. Finally, the respiratory function of the bacteria is inhibited, thereby achieving contact sterilization and bacteriostasis.40,41
![[x with combining macron]](https://www.rsc.org/images/entities/i_char_0078_0304.gif) ± s, n = 9)a
± s, n = 9)a
| Group | 24 hours | 5000 cycles |
|---|---|---|
| a Note: the different superscripted letters indicate significant differences within the same column (P < 0.05); the different lower case letters indicate significant differences within the same line (P < 0.05). | ||
| 0 wt% | 26.38 ± 1.29Aa | 26.12 ± 1.52Aa |
| 1 wt% | 26.15 ± 0.86Aa | 25.81 ± 1.50Aa |
| 3 wt% | 25.98 ± 1.57Aa | 25.74 ± 1.26Aa |
| 5 wt% | 25.63 ± 1.55Aa | 25.41 ± 1.46Aa |
| 7 wt% | 24.85 ± 0.91Ba | 24.63 ± 0.93Ba |
(1) MTT
The cell absorbance values, RGR values and cytotoxicity grades are shown in Fig. 11 and Table 8. As shown in Fig. 11, at the same time point, the A values of the negative control group, blank control group, and experimental groups were basically similar and not significantly different from those of the silicate-based transition film groups (P > 0.05). Significant differences were noted between the positive control group and the other groups (P < 0.01). As shown in Table 8, at different time points, each experimental group exhibited a good cell relative proliferation rate, which was greater than 90%. The cytotoxicity level was 0 or I, indicating that the material exhibited no obvious cytotoxicity in vitro.
| RGR (%) | Cytotoxicity grade | |||||
|---|---|---|---|---|---|---|
| 24 h | 48 h | 72 h | 24 h | 48 h | 72 h | |
| Positive | 21 | 9 | 4 | IV | IV | IV |
| Negative | 101 | 103 | 100 | 0 | 0 | 0 |
| 0 wt% | 102 | 103 | 100 | 0 | 0 | 0 |
| 1 wt% | 101 | 99 | 102 | 0 | I | 0 |
| 3 wt% | 101 | 99 | 100 | 0 | I | 0 |
| 5 wt% | 100 | 101 | 101 | 0 | 0 | 0 |
| 7 wt% | 101 | 100 | 104 | 0 | 0 | 0 |
(2) Calcein-AM and PI live/dead cell staining
The fluorescent staining results of living/dead cells are shown in Fig. 12. The living cells (green stained) in each experimental group were spindle shaped and well extended. The proportion of living cells in each group was greater than 90%, which was consistent with the results of the MTT toxicity test.
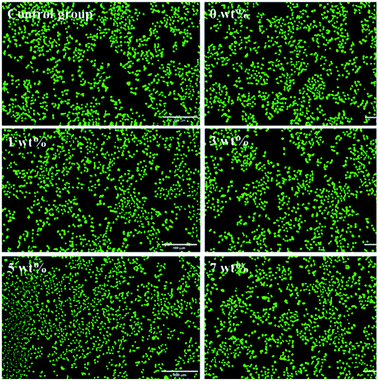 | ||
| Fig. 12 Fluorescent staining results of living/dead cells. Green cells are living cells, red cells are dead cells. Bar = 200 μm. | ||
In this study, the MTT toxicity test and calcein-AM and PI live/dead cell staining results showed that the cell survival rate in vitro of the antibacterial epitaxial transition layer was greater than or equal to 99%, which had no effect on L929 cell morphology and proliferation. This result is consistent with previous test results, 26 indicating that the addition of MHD-QAC has no effect on the cytotoxicity of the material.
4 Conclusions
In summary, the antibacterial polymer MHD-QAC was innovatively synthesized by solution polymerization. On the basis of silicate epitaxial transition layer, the antibacterial epitaxial transition layer was successfully prepared by introducing MHD-QAC antibacterial monomer and forming chemical bond with KH570. The antibacterial ingredients are not released and the antibacterial effect is long-lasting. The 5 wt% MHD-QAC antibacterial epitaxial transition layer exhibits a significant antibacterial effects, shear bond strength and cell activity in vitro, which can effectively prevent the occurrence of secondary caries. It is of great significance to improve the success rate of clinical zirconia ceramic restorations.Conflicts of interest
There are no conflicts to declare.Acknowledgements
This research was financially supported by the National Natural Science Foundation of China (NSFC, Grant No. 81671033) and Ministry of Education's “Chunhui Plan” Cooperative Scientific Research Project. The authors also thank American Journal Experts (AJE) for his assistance in providing language help.Notes and references
- A. Hollanders, Ned. Tijdschr. Tandheelkd, 2017, 124, 257–263 CrossRef CAS PubMed.
- I. A. Mjör and F. Toffenetti, Quintessence Int., 2000, 31, 165–179 Search PubMed.
- J. J. Kruzic, J. A. Arsecularatne, C. B. Tanaka, M. J. Hoffman and P. F. Cesar, J. Mech. Behav. Biomed. Mater., 2018, 88, 504–533 CrossRef CAS PubMed.
- O. Fejerskov, Caries Res., 2004, 38, 182–191 CrossRef CAS PubMed.
- L. Cheng, M. D. Weir, K. Zhang, S. M. Xu, Q. Chen, X. Zhou and H. H. K. Xu, J. Dent. Res., 2012, 91, 460–466 CrossRef CAS PubMed.
- S. Imazato, M. Torii and Y. Tsuchitani, J. Dent. Res., 1993, 30, 63–68 Search PubMed.
- Y. Zhang, Y. Chen, Y. Hu, F. Huang and Y. H. Xiao, Dent. Mater. J., 2018, 37, 183–191 CrossRef CAS PubMed.
- H. Zhou, M. D. Weir, J. M. Antonucci, G. E. Schumacher, X. D. Zhou and H. H. K. Xu, Int. J. Oral Sci., 2014, 6, 77–86 CrossRef CAS PubMed.
- F. Li, M. D. Weir and H. H. K. Xu, J. Dent. Res., 2013, 92, 932–938 CrossRef CAS PubMed.
- Y. Xue, H. Xiao and Y. Zhang, Int. J. Mol. Sci., 2015, 16, 3626–3655 CrossRef CAS PubMed.
- S. Imazato, M. Torii, Y. Tsuchitani and J. F. McCabe, J. Dent. Res., 1994, 73, 1437–1443 CrossRef CAS PubMed.
- C. Zhou, M. D. Weir, K. Zhang, D. M. Deng, L. Cheng and H. H. K. Xu, Dent. Mater. J., 2013, 29, 859–870 CrossRef CAS PubMed.
- N. Zhang, C. Chen, M. D. Weir, Y. X. Bai and H. H. K. Xu, J. Dent., 2015, 43, 1529–1538 CrossRef CAS PubMed.
- L. Huang, Y. H. Xiao, X. D. Xing, F. Li, S. Ma, L. L. Qi and J. H. Chen, Arch. Oral Biol., 2011, 56, 367–373 CrossRef CAS PubMed.
- S. Buffetbataillon, P. Tattevin, M. Bonnauremallet and A. J. Gougeon, Int. J. Antimicrob. Agents, 2012, 39, 381–389 CrossRef CAS PubMed.
- P. Gilbert and L. E. J. Moore, J. Appl. Microbiol., 2010, 99, 703–715 CrossRef PubMed.
- P. Makvandi, R. Jamaledin, M. Jabbari, N. Nikfarjam and A. Borzacchiello, Dent. Mater. J., 2018, 34, 851–867 CrossRef CAS PubMed.
- S. Beyth, D. Polak, C. Milgrom, S. Matanis and N. Beyth, J. Antimicrob. Chemother., 2013, 69, 854–855 CrossRef PubMed.
- C. Susin, M. Qahash, J. Hall, L. Sennerby and U. M. E. Wikesjö, J. Clin. Periodontol., 2008, 35, 270–275 CrossRef CAS PubMed.
- Y. Yang, L. Huang, Y. Dong, H. C. Zhang, W. Zhou, J. H. Ban, J. J. Wei, Y. Liu, J. Gao and J. H. Chen, PLoS One, 2014, 9, e112549 CrossRef PubMed.
- M. A. Melo, J. Wu, M. D. Weir and H. H. Xu, J. Dent., 2014, 42, 1193–1201 CrossRef CAS PubMed.
- F. Li, F. Li, D. Wu, S. Ma, J. Gao, Y. Q. Li, Y. H. Xiao and J. H. Chen, J. Am. Dent. Assoc., JADA, 2011, 142, 184–193 CrossRef PubMed.
- N. Hirose, R. Kitagawa, H. Kitagawa, H. Maezono, A. Mine, M. Hayashi and S. Imazato, J. Dent. Res., 2016, 95, 1487–1493 CrossRef CAS PubMed.
- S. O. Ahmet, M. M. Mutluay, P. Z. Seyfioglu, D. R. Seseogullari, B. Bek and M. A. Tezvergil, Acta Odontol. Scand., 2014, 72, 831–838 CrossRef PubMed.
- F. M. Korkmaz, T. Tüzüner, O. Baygin, C. K. Buruk, R. Durkan and B. Bagis, J. Prosthet. Dent., 2013, 110, 107–115 CrossRef CAS.
- L. Huang, F. Yu, X. Sun, Y. Dong, P. T. Lin, H. H. Yu, Y. H. Xiao, Z. G. Chai, X. D. Xing and J. H. Chen, Sci. Rep., 2016, 6, 33858 CrossRef CAS PubMed.
- Y. M. Pupo, P. V. Farago, J. M. Nadal, A. C. Kovalik, d. F. A. Santos, O. M. Gomes and J. C. Gomes, Arch. Oral Biol., 2015, 60, 1138–1145 CrossRef CAS PubMed.
- X. J. Liu, H. Wang, S. Y. Yu, Q. Zhao, Z. S. Shi, Z. C. Cui and S. Zhu, RSC Adv., 2020, 10, 32476–32484 RSC.
- USP XXII, NF XVII [S], United States Pharmacopeial Convention, Inc, 1990, 2069.
- X. J. Liu, K. Gan, H. Liu, X. Q. Song, T. J. Chen and C. C. Liu, Dent. Mater. J., 2017, 33, e348–e360 CrossRef CAS PubMed.
- M. Hotta, H. Nakajima, K. Yamamoto and M. Aono, J. Oral Rehabil., 1998, 25, 485–489 CrossRef CAS PubMed.
- A. Aamdal-Scheie, W. M. Luan, G. Dahlen and O. Fejerskov, J. Dent. Res., 1996, 75, 1901–1908 CrossRef CAS PubMed.
- T. Matsuura, Y. Abe, Y. Sato, K. Okamoto, M. Ueshige and Y. Akagawa, J. Dent., 1997, 25, 373–377 CrossRef CAS PubMed.
- E. R. Kenawy, F. A. Hay, A. E. R. R. E. Shanshoury and M. H. E. Newehy, J. Polym. Sci., Part A: Polym. Chem., 2002, 40, 2384–2393 CrossRef CAS.
- S. Imazato, J. H. Chen, S. Ma, N. Izutanic and F. Li, Jpn. Dent. Sci. Rev., 2012, 48, 115–125 CrossRef.
- L. Caillier, E. T. Givenchy, R. Levy, Y. Vandenberghe, S. Géribaldi and F. Guittard, Eur. J. Med. Chem., 2009, 44, 3201–3208 CrossRef CAS PubMed.
- L. Marcotte, J. Barbeau and M. Lafleur, J. Colloid Interface Sci., 2005, 292, 219–227 CrossRef CAS PubMed.
- A. Muñoz-Bonilla and M. Fernández-García, Prog. Polym. Sci., 2012, 37, 281–339 CrossRef.
- K. P. C. Minbiole, M. C. Jennings, L. E. Ator, J. W. Blacka, M. C. Greniera, J. E. LaDow, K. L. Caran, K. Seifert and W. M. Wuest, Tetrahedron, 2016, 72, 3559–3566 CrossRef CAS.
- B. Ahlström, R. Thompson and L. Edebo, APMIS, 1999, 107, 318–324 CrossRef PubMed.
- N. Kawabata and M. Nishiguchi, Appl. Environ. Microbiol., 1988, 54, 2532–2535 CrossRef CAS PubMed.
- C. Y. Lung, E. Kukk and J. P. Matinlinna, Dent. Mater. J., 2013, 32, 165–172 CrossRef CAS PubMed.
- C. Y. Lung, M. G. Botelho, M. Heinonen and J. P. Matinlinna, Dent. Mater. J., 2012, 28, 863–872 CrossRef CAS PubMed.
- H. Xie, F. R. Tay, F. Zhang, Y. Lu, S. P. Shen and C. Chen, Dent. Mater. J., 2015, 31, e218–e225 CrossRef CAS PubMed.
- G. A. Arossi, M. Lehmann, R. R. Dihl, M. L. Reguly and H. H. R. Andrade, Basic Clin. Pharmacol. Toxicol., 2010, 106, 124–129 CrossRef CAS PubMed.
- M. A. P. Borges, I. C. Matos and L. C. Mendes, Dent. Mater. J., 2011, 27, 244–252 CrossRef CAS PubMed.
- M. Goldberg, Clin. Oral Investig., 2008, 12, 1–8 CrossRef PubMed.
| This journal is © The Royal Society of Chemistry 2021 |

