 Open Access Article
Speciation analysis the complexation of uranyl nitrate with tri-n-butyl phosphate in supercritical CO2†
Liyang Zhu ,
Youshi Lan*,
Qian Liu,
Xuan Hao,
Jin Zhou and
Suliang Yang*
Department of Radiochemisty, China Institute of Atomic Energy, Beijing, 102413, China. E-mail: lanyoushi@ciae.ac.cn; ysl79@ciae.ac.cn
First published on 10th November 2021
Abstract
The complexation of solid uranyl nitrate with tri-n-butyl phosphate (TBP) in supercritical CO2 is quite different from that of a liquid–liquid extraction system because fewer water molecules are involved. Here, the complexation mechanism was investigated by molecular dynamics simulation, emphasising on speciation distribution analysis. In the anhydrous uranyl nitrate system, poly-core uranyl-TBP species [UO2(NO3)2]2·3TBP and [UO2(NO3)2]3·3TBP were formed in addition to the predominant [UO2(NO3)2]·1TBP and [UO2(NO3)2]·2TBP species. The poly-core species was mainly constructed via the linkage of U![[double bond, length as m-dash]](https://www.rsc.org/images/entities/char_e001.gif) O⋯U contributed by pre-developed [UO2(NO3)2]·1TBP species. However, in the hydrated uranyl nitrate system, TBP·[UO2(NO3)2]·H2O species form, preventing the formation of the poly-core species. The complexation developed differently depending on the TBP to the uranyl nitrate ratio, the solute densities and the participation of water. It suggested that the kinetically favoring species would gradually convert into the thermodynamically stable species [UO2(NO3)2]·2TBP by ligand exchange.
O⋯U contributed by pre-developed [UO2(NO3)2]·1TBP species. However, in the hydrated uranyl nitrate system, TBP·[UO2(NO3)2]·H2O species form, preventing the formation of the poly-core species. The complexation developed differently depending on the TBP to the uranyl nitrate ratio, the solute densities and the participation of water. It suggested that the kinetically favoring species would gradually convert into the thermodynamically stable species [UO2(NO3)2]·2TBP by ligand exchange.
1 Introduction
The spent nuclear fuel (SNF) discharged from nuclear power plants contains fissionable materials, such as uranium and plutonium, and other highly radioactive elements. Recycling uranium and plutonium from SNF is crucial for the sustainable development of nuclear power. This is achieved by the well-known hydrometallurgy process, Plutonium and Uranium Coextraction Process (PUREX), in which uranium and plutonium are extracted by tri-n-butyl phosphate (TBP) diluted in kerosene organic phase once SNF is dissolved in nitric acid. This leaves other radionuclides such as 241Am, 243/244Cm, 90Sr, 137Cs in the raffinate, thus generating a significant amount of secondary radioactive liquid waste. Supercritical fluid has unique properties, such as gas-like diffusion abilities and liquid-like solubilities. Using supercritical CO2 for actinide extraction and separation has been extensively studied, and the main motivation is to reduce the secondary radioactive liquid waste compared to the hydrometallurgy process.1,2 The extraction of uranyl nitrate with TBP into supercritical CO2,3 or direct dissolution and extraction from uranium oxide using supercritical CO2 containing the TBP–HNO3 complex has been demonstrated.4 Conjunction with other newly investigated media such as ionic liquid or deep eluent solution was also explored.5,6 Although utilizing supercritical fluid to extract actinides, particularly uranium, has been verified in diversified manners or application scenarios, the complexation mechanism of uranyl with TBP in supercritical CO2 is still vague and may be quite different from a liquid–liquid extraction system. It has also been found that solid lanthanide nitrate can be easily extracted into supercritical CO2 phase containing TBP,7 while lanthanide ions often remain in aqueous phase in a liquid–liquid extraction system.Due to the high pressure of the supercritical fluid phase, it is difficult to explore the complexation reaction with analytical instrumentation. Molecular dynamic modelling is an alternative method, which has been actively developed for liquid–liquid extraction simulation.8–11 In the liquid–liquid solvent extraction system, it is predicted that uranyl ion complexes with TBP form UO2·NO3·4TBP, UO2·5TBP and UO2·NO3·3TBP·HNO3 in the interface or in the organic phase.12 Guilbaud et al.13 reported the aggregation of UO2(NO3)2(TBP)2 at a high uranium concentration. As for a supercritical CO2 extraction system, only Wipff et al.14,15 investigated the complexation of uranyl nitrate with TBP at the interface of the supercritical CO2/aqueous phase. Since a large amount of H2O molecules are involved in the simulation, the results are more comparable to the liquid–liquid extraction system. Thus, the complexation of uranyl nitrate with TBP in supercritical CO2 with less water participation is still needed. Also, investigating the distribution of different species evolving with simulation time may be useful to track how the experimental conditions affect the results; however, no study has been reported yet because the number of uranyl nitrate molecules considered is usually limited. Therefore, we aim to investigate the complexation of anhydrous and hydrate uranyl nitrate with TBP in supercritical CO2 and describe the species distribution evolved with the simulation procedure.
2 Computational methods
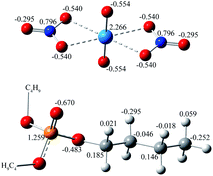
The force fields for uranyl nitrate, TBP, and CO2 were carefully considered. The charge of OP![[double bond, length as m-dash]](https://www.rsc.org/images/entities/char_e001.gif) O in the TBP molecule plays a very important role in determining the interaction strength of TBP with uranyl nitrate, but its value varies largely among the studies8,9,11 from −0.54 e to −0.87 e. The original structure of TBP was adopted from ref. 16, and further optimized at the B3LYP/6-311G(d) level as implemented in the Gaussian 16 (ref. 17) code, with empirical dispersion corrections (GD3BJ).18 The IEFPCM solvation model was used, with a dielectric constant of 1.5, which is consistent with the experimental value of supercritical CO2 at 323 K and 20 MPa.19 Also, by default, the solute cavity is defined as the UFF force field radii of the atoms with a scale factor of 1.1. After the optimization, the RESP charge of TBP was calculated by the Multiwfn software20 version 3.7. The charge was 1.259 e and −0.670 e for PP
O in the TBP molecule plays a very important role in determining the interaction strength of TBP with uranyl nitrate, but its value varies largely among the studies8,9,11 from −0.54 e to −0.87 e. The original structure of TBP was adopted from ref. 16, and further optimized at the B3LYP/6-311G(d) level as implemented in the Gaussian 16 (ref. 17) code, with empirical dispersion corrections (GD3BJ).18 The IEFPCM solvation model was used, with a dielectric constant of 1.5, which is consistent with the experimental value of supercritical CO2 at 323 K and 20 MPa.19 Also, by default, the solute cavity is defined as the UFF force field radii of the atoms with a scale factor of 1.1. After the optimization, the RESP charge of TBP was calculated by the Multiwfn software20 version 3.7. The charge was 1.259 e and −0.670 e for PP![[double bond, length as m-dash]](https://www.rsc.org/images/entities/char_e001.gif) O and OP
O and OP![[double bond, length as m-dash]](https://www.rsc.org/images/entities/char_e001.gif) O, respectively, close to 1.34 e for PP
O, respectively, close to 1.34 e for PP![[double bond, length as m-dash]](https://www.rsc.org/images/entities/char_e001.gif) O and −0.707 e for OP
O and −0.707 e for OP![[double bond, length as m-dash]](https://www.rsc.org/images/entities/char_e001.gif) O atoms reported by Mu et al.21 Other parameters for bonds, angles and non-bonded interactions of TBP were generated by Antechamber tools in Amber 18,22 by applying the build-in GAFF2 force field. The force field for CO2 in the supercritical state was evaluated, as shown in Table S1.† The parameters developed by Zhu et al.23 was used because the density was calculated to be 0.787 g cm−3, which is very close to that of the experimental value of 0.784 g cm−3 at 323 K and 20 MPa. The uranyl nitrate was treated as a bonded model to maintain the extracted species charge neutral.14 However, there are no exclusive force fields for uranyl nitrate, which is critical for the geometry of the uranyl complex. Here, the uranyl nitrate force field was generated through the Seminario24 method by using MCPB.py.25 The complete parameters for uranyl nitrate provide constrain to the coordination sites of uranyl ions, which ensures a complex a reasonable geometry. The established force field parameters of uranyl nitrate and TBP (Scheme 1) are listed in supplement information.
O atoms reported by Mu et al.21 Other parameters for bonds, angles and non-bonded interactions of TBP were generated by Antechamber tools in Amber 18,22 by applying the build-in GAFF2 force field. The force field for CO2 in the supercritical state was evaluated, as shown in Table S1.† The parameters developed by Zhu et al.23 was used because the density was calculated to be 0.787 g cm−3, which is very close to that of the experimental value of 0.784 g cm−3 at 323 K and 20 MPa. The uranyl nitrate was treated as a bonded model to maintain the extracted species charge neutral.14 However, there are no exclusive force fields for uranyl nitrate, which is critical for the geometry of the uranyl complex. Here, the uranyl nitrate force field was generated through the Seminario24 method by using MCPB.py.25 The complete parameters for uranyl nitrate provide constrain to the coordination sites of uranyl ions, which ensures a complex a reasonable geometry. The established force field parameters of uranyl nitrate and TBP (Scheme 1) are listed in supplement information.
The simulation systems were constructed using the Packmol26 software, as listed in Table S2.† The length of the simulation cubic box was either 98 or 150 Å. It was reported that the [UO2(NO3)2]·2TBP complex had high solubility in supercritical CO2,27 which could be up to 0.4 mol L−1. In this study, the concentration of uranyl nitrate was either 0.04 or 0.17 mol L−1. In order to statistically calculate the number of species, up to 100 uranyl nitrates were included in the simulations. All the systems were first relaxed using steepest descent and conjugate gradient minimization algorithm to eliminate any bad contacts. Then, they were heated at gradually increased temperature up to 700 K in an NVT ensemble. At the production stage, an Langevin thermostat was employed for temperature control at 323 K and 20 MPa. Periodic boundary was imposed on the system during the calculation of non-bonded interactions. A cutoff radius was set at 10 Å for nonbonded interactions. The MD trajectories and velocities were calculated with a time step of 1 fs. The SHAKE constraints28 was used for all the hydrogen atoms. Auto-image was employed when writing the coordinates to the restart and trajectory files. The production period of molecular dynamics lasted for 20 ns, and the radial distribution function of uranyl to TBP remained almost unchanged after 20 ns. As the system was relatively large, the GPU code29,30 in Amber 18 was used. After the simulation, the trajectory was visualized by the VMD31 software.
The structures of complexes taken from the trajectories were optimized using B3LYP function. U atom relativistic effects were dealt using the quasi-relativistic effective core potentials (RECPs).32 The adopted small core RECPs had 60 electrons in the core of U (MWB60), and the affiliated segmental basis sets were applied for the valence electrons of U, while the def2-tzvp33 basis set was used for N, H, O and P.
To describe the distribution of species with simulation, for example the uranyl-TBP species, the RDF of uranium with OP![[double bond, length as m-dash]](https://www.rsc.org/images/entities/char_e001.gif) O was first calculated, and a cutoff of 3.5 Å was used to determine whether the ligand TBP complexed with uranyl nitrate. The coordinates in different simulation times were extracted to PDB files from the simulation trajectories. And then the residue IDs of the paired uranyl nitrates and the corresponding TBP molecules were generated by using “native contact” command in the cpptraj tool34 from each PDB file. Lastly, discrete frequency counts of the obtained residue IDs of uranyl nitrate was performed twice using a shell script to obtain the number of species at different times. As for the species when uranyl nitrate complexed with TBP and water simultaneously, the contact analysis of uranyl with TBP and water were made separately, and then, the residue IDs of uranyl nitrate in the above output files were cross-indexed to obtain the number of species.
O was first calculated, and a cutoff of 3.5 Å was used to determine whether the ligand TBP complexed with uranyl nitrate. The coordinates in different simulation times were extracted to PDB files from the simulation trajectories. And then the residue IDs of the paired uranyl nitrates and the corresponding TBP molecules were generated by using “native contact” command in the cpptraj tool34 from each PDB file. Lastly, discrete frequency counts of the obtained residue IDs of uranyl nitrate was performed twice using a shell script to obtain the number of species at different times. As for the species when uranyl nitrate complexed with TBP and water simultaneously, the contact analysis of uranyl with TBP and water were made separately, and then, the residue IDs of uranyl nitrate in the above output files were cross-indexed to obtain the number of species.
3 Results and discussion
3.1 Simulation without H2O
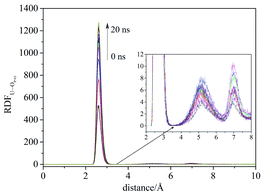
Compared with liquid–liquid solvent extraction, typically there is less water in the supercritical CO2 extraction system. The complexation of uranyl nitrate with TBP without water was first investigated. The RDF of U⋯OP![[double bond, length as m-dash]](https://www.rsc.org/images/entities/char_e001.gif) O reached equilibrium after 20 ns, suggesting the simulation duration was adequate for the present system. Also, the cutoff of the complexation reaction of uranyl nitrate with TBP was 3.5 Å, as shown in Fig. 1.
O reached equilibrium after 20 ns, suggesting the simulation duration was adequate for the present system. Also, the cutoff of the complexation reaction of uranyl nitrate with TBP was 3.5 Å, as shown in Fig. 1.
Surprisingly, there were four kinds of uranyl-TBP species identified, [UO2(NO3)2]·1TBP, [UO2(NO3)2]·2TBP, [UO2(NO3)2]2·3TBP and [UO2(NO3)2]3·3TBP, denoted as 1![[thin space (1/6-em)]](https://www.rsc.org/images/entities/char_2009.gif) :
:![[thin space (1/6-em)]](https://www.rsc.org/images/entities/char_2009.gif) 1, 1
1, 1![[thin space (1/6-em)]](https://www.rsc.org/images/entities/char_2009.gif) :
:![[thin space (1/6-em)]](https://www.rsc.org/images/entities/char_2009.gif) 2, 2
2, 2![[thin space (1/6-em)]](https://www.rsc.org/images/entities/char_2009.gif) :
:![[thin space (1/6-em)]](https://www.rsc.org/images/entities/char_2009.gif) 3 and 3
3 and 3![[thin space (1/6-em)]](https://www.rsc.org/images/entities/char_2009.gif) :
:![[thin space (1/6-em)]](https://www.rsc.org/images/entities/char_2009.gif) 3, as illustrated in Fig. 2. The most predominant species were 1
3, as illustrated in Fig. 2. The most predominant species were 1![[thin space (1/6-em)]](https://www.rsc.org/images/entities/char_2009.gif) :
:![[thin space (1/6-em)]](https://www.rsc.org/images/entities/char_2009.gif) 1 and 1
1 and 1![[thin space (1/6-em)]](https://www.rsc.org/images/entities/char_2009.gif) :
:![[thin space (1/6-em)]](https://www.rsc.org/images/entities/char_2009.gif) 2. The structure of UO2(NO3)2·2TBP was similar to that reported in the literature,35 in which two TBP molecules coordinated with uranyl moiety O
2. The structure of UO2(NO3)2·2TBP was similar to that reported in the literature,35 in which two TBP molecules coordinated with uranyl moiety O![[double bond, length as m-dash]](https://www.rsc.org/images/entities/char_e001.gif) U
U![[double bond, length as m-dash]](https://www.rsc.org/images/entities/char_e001.gif) O at the equatorial plane. For the 1
O at the equatorial plane. For the 1![[thin space (1/6-em)]](https://www.rsc.org/images/entities/char_2009.gif) :
:![[thin space (1/6-em)]](https://www.rsc.org/images/entities/char_2009.gif) 1 species, TBP also coordinated to the uranium from the equatorial plane of the uranyl moiety, and the angle of N⋯U⋯N was approximately 153°, bending towards the side without TBP. The electrostatic potential (ESP) surfaces of the 1
1 species, TBP also coordinated to the uranium from the equatorial plane of the uranyl moiety, and the angle of N⋯U⋯N was approximately 153°, bending towards the side without TBP. The electrostatic potential (ESP) surfaces of the 1![[thin space (1/6-em)]](https://www.rsc.org/images/entities/char_2009.gif) :
:![[thin space (1/6-em)]](https://www.rsc.org/images/entities/char_2009.gif) 1 and 1
1 and 1![[thin space (1/6-em)]](https://www.rsc.org/images/entities/char_2009.gif) :
:![[thin space (1/6-em)]](https://www.rsc.org/images/entities/char_2009.gif) 2 species were also generated, as shown in Fig. 2. On the TBP-free side of the 1
2 species were also generated, as shown in Fig. 2. On the TBP-free side of the 1![[thin space (1/6-em)]](https://www.rsc.org/images/entities/char_2009.gif) :
:![[thin space (1/6-em)]](https://www.rsc.org/images/entities/char_2009.gif) 1 species, more positive charges leaked out of uranium, and on the ONO3 atom of the 1
1 species, more positive charges leaked out of uranium, and on the ONO3 atom of the 1![[thin space (1/6-em)]](https://www.rsc.org/images/entities/char_2009.gif) :
:![[thin space (1/6-em)]](https://www.rsc.org/images/entities/char_2009.gif) 2 species, there was more negative charge. The 1
2 species, there was more negative charge. The 1![[thin space (1/6-em)]](https://www.rsc.org/images/entities/char_2009.gif) :
:![[thin space (1/6-em)]](https://www.rsc.org/images/entities/char_2009.gif) 1 and 1
1 and 1![[thin space (1/6-em)]](https://www.rsc.org/images/entities/char_2009.gif) :
:![[thin space (1/6-em)]](https://www.rsc.org/images/entities/char_2009.gif) 2 species can interact with each other via electrostatic interactions, thus acting as the building blocks of the other species. The structure of 2
2 species can interact with each other via electrostatic interactions, thus acting as the building blocks of the other species. The structure of 2![[thin space (1/6-em)]](https://www.rsc.org/images/entities/char_2009.gif) :
:![[thin space (1/6-em)]](https://www.rsc.org/images/entities/char_2009.gif) 3 species was unique, with the two O
3 species was unique, with the two O![[double bond, length as m-dash]](https://www.rsc.org/images/entities/char_e001.gif) U
U![[double bond, length as m-dash]](https://www.rsc.org/images/entities/char_e001.gif) O moieties being linked by the cation–cation interactions.36,37 Two types of 2
O moieties being linked by the cation–cation interactions.36,37 Two types of 2![[thin space (1/6-em)]](https://www.rsc.org/images/entities/char_2009.gif) :
:![[thin space (1/6-em)]](https://www.rsc.org/images/entities/char_2009.gif) 3 species were identified, of which type I had two N⋯U⋯N axes parallel to each other, while in type II, the N⋯U⋯N axis was arranged in a perpendicular manner. The structure of 3
3 species were identified, of which type I had two N⋯U⋯N axes parallel to each other, while in type II, the N⋯U⋯N axis was arranged in a perpendicular manner. The structure of 3![[thin space (1/6-em)]](https://www.rsc.org/images/entities/char_2009.gif) :
:![[thin space (1/6-em)]](https://www.rsc.org/images/entities/char_2009.gif) 3 species was constructed by the inner interaction of three O
3 species was constructed by the inner interaction of three O![[double bond, length as m-dash]](https://www.rsc.org/images/entities/char_e001.gif) U
U![[double bond, length as m-dash]](https://www.rsc.org/images/entities/char_e001.gif) O, with three N⋯U⋯N axes paralleled to each other. Also, the outer of three O
O, with three N⋯U⋯N axes paralleled to each other. Also, the outer of three O![[double bond, length as m-dash]](https://www.rsc.org/images/entities/char_e001.gif) U
U![[double bond, length as m-dash]](https://www.rsc.org/images/entities/char_e001.gif) O clusters was covered by three TBP molecules. The parameters of the four identified species are listed in Table 1. In most cases, the length of the P
O clusters was covered by three TBP molecules. The parameters of the four identified species are listed in Table 1. In most cases, the length of the P![[double bond, length as m-dash]](https://www.rsc.org/images/entities/char_e001.gif) O bond in TBP was approximately 1.51 Å, but for type I of 2
O bond in TBP was approximately 1.51 Å, but for type I of 2![[thin space (1/6-em)]](https://www.rsc.org/images/entities/char_2009.gif) :
:![[thin space (1/6-em)]](https://www.rsc.org/images/entities/char_2009.gif) 3 species, there were two P
3 species, there were two P![[double bond, length as m-dash]](https://www.rsc.org/images/entities/char_e001.gif) O bonds of 2.34 Å. The bond length of U⋯OP
O bonds of 2.34 Å. The bond length of U⋯OP![[double bond, length as m-dash]](https://www.rsc.org/images/entities/char_e001.gif) O was measured from 2.30 to 2.38 Å, except for the 1
O was measured from 2.30 to 2.38 Å, except for the 1![[thin space (1/6-em)]](https://www.rsc.org/images/entities/char_2009.gif) :
:![[thin space (1/6-em)]](https://www.rsc.org/images/entities/char_2009.gif) 1 species. It was noticed that some O
1 species. It was noticed that some O![[double bond, length as m-dash]](https://www.rsc.org/images/entities/char_e001.gif) U
U![[double bond, length as m-dash]](https://www.rsc.org/images/entities/char_e001.gif) O bonds were enlarged because of the cation–cation interaction. Usually, the length was about 1.76 Å, while in the 2
O bonds were enlarged because of the cation–cation interaction. Usually, the length was about 1.76 Å, while in the 2![[thin space (1/6-em)]](https://www.rsc.org/images/entities/char_2009.gif) :
:![[thin space (1/6-em)]](https://www.rsc.org/images/entities/char_2009.gif) 3 species, the bond of U
3 species, the bond of U![[double bond, length as m-dash]](https://www.rsc.org/images/entities/char_e001.gif) O was enlarged to 1.82 Å. The average distances of U⋯ONO3 were 2.47, 2.54, 2.51 and 2.48 Å for 1
O was enlarged to 1.82 Å. The average distances of U⋯ONO3 were 2.47, 2.54, 2.51 and 2.48 Å for 1![[thin space (1/6-em)]](https://www.rsc.org/images/entities/char_2009.gif) :
:![[thin space (1/6-em)]](https://www.rsc.org/images/entities/char_2009.gif) 1, 1
1, 1![[thin space (1/6-em)]](https://www.rsc.org/images/entities/char_2009.gif) :
:![[thin space (1/6-em)]](https://www.rsc.org/images/entities/char_2009.gif) 2, 2
2, 2![[thin space (1/6-em)]](https://www.rsc.org/images/entities/char_2009.gif) :
:![[thin space (1/6-em)]](https://www.rsc.org/images/entities/char_2009.gif) 3 and 3
3 and 3![[thin space (1/6-em)]](https://www.rsc.org/images/entities/char_2009.gif) :
:![[thin space (1/6-em)]](https://www.rsc.org/images/entities/char_2009.gif) 3 species, respectively, among which, the 1
3 species, respectively, among which, the 1![[thin space (1/6-em)]](https://www.rsc.org/images/entities/char_2009.gif) :
:![[thin space (1/6-em)]](https://www.rsc.org/images/entities/char_2009.gif) 2 species had the longest U⋯ONO3 distance. In the original uranyl nitrate, the distance of U⋯ONO3 was 2.42 Å, and that of U
2 species had the longest U⋯ONO3 distance. In the original uranyl nitrate, the distance of U⋯ONO3 was 2.42 Å, and that of U![[double bond, length as m-dash]](https://www.rsc.org/images/entities/char_e001.gif) O was 1.75 Å; thus, the bond length would be enlarged upon complexing with TBP, and the longer distance of U⋯ONO3 may suggest stability of the species.
O was 1.75 Å; thus, the bond length would be enlarged upon complexing with TBP, and the longer distance of U⋯ONO3 may suggest stability of the species.
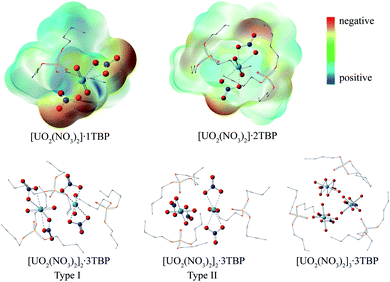 | ||
| Fig. 2 The optimized structures of uranyl species formed in supercritical CO2 (the hydrogen atoms were hidden for clarity). | ||
| Species | Bond distance/Å | Angle/degree | ||||
|---|---|---|---|---|---|---|
P![[double bond, length as m-dash]](https://www.rsc.org/images/entities/char_e001.gif) O O |
U⋯OP![[double bond, length as m-dash]](https://www.rsc.org/images/entities/char_e001.gif) O O |
O![[double bond, length as m-dash]](https://www.rsc.org/images/entities/char_e001.gif) U U![[double bond, length as m-dash]](https://www.rsc.org/images/entities/char_e001.gif) O O |
U–ONO3 | U⋯U | N⋯U⋯N | |
| [UO2(NO3)2]·1TBP | 1.52 | 2.29 | 1.77, 1.76 | 2.45, 2.47, 2.46, 2.48 | — | 153.3 |
| [UO2(NO3)2]·2TBP | 1.51, 1.51 | 2.37, 2.37 | 1.77, 1.77 | 2.53, 2.54, 2.53, 2.54 | — | 178.9 |
| [UO2(NO3)2]2·3TBP type I | 1.51, 2.34, 2.34 | 2.36, 2.34, 2.34 | 1.77, 1.77 | 2.50, 2.51, 2.51, 2.50 | 4.21 | 168.9, 176.3 |
| 1.82, 1.77 | 2.50, 2.51, 2.52, 2.53 | |||||
| [UO2(NO3)2]2·3TBP type II | 1.52, 1.52, 1.51 | 2.35, 2.34, 2.34 | 1.77, 1.81 | 2.51, 2.51, 2.51, 2.50 | 4.23 | 177.4, 174.1 |
| 1.77, 1.76 | 2.51, 2.52, 2.52, 2.52 | |||||
| [UO2(NO3)2]3·3TBP | 1.52, 1.52, 1.52 | 2.31, 2.31, 2.35 | 1.81, 1.77 | 2.48, 2.50, 2.47, 2.47 | 4.20, 4.21, 4.21 | 175.3, 173.2, 174.1 |
| 1.76, 1.81 | 2.48, 2.51, 2.48, 2.46 | |||||
| 1.81, 1.76 | 2.48, 2.49, 2.49, 2.48 | |||||
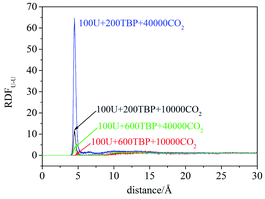
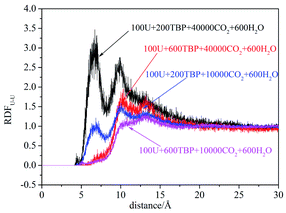
RDFU⋯U was calculated from final 5 ns trajectories in different systems, and normalized by the number density of uranyl nitrate, as shown in Fig. 3. There were peaks at approximately 4.5 Å, coincided with the distance of U⋯U in the poly-core species in trajectories, thus indicating the probabilities of poly-core species. There were two factors affecting the formation of poly-core species, which were the ratio of TBP to uranyl nitrate (TBP![[thin space (1/6-em)]](https://www.rsc.org/images/entities/char_2009.gif) :
:![[thin space (1/6-em)]](https://www.rsc.org/images/entities/char_2009.gif) U), and the concentration of uranyl nitrate and TBP in the system. When the TBP
U), and the concentration of uranyl nitrate and TBP in the system. When the TBP![[thin space (1/6-em)]](https://www.rsc.org/images/entities/char_2009.gif) :
:![[thin space (1/6-em)]](https://www.rsc.org/images/entities/char_2009.gif) U ratio was low, the peak at 4.5 Å was high, indicating that a more poly-core complex formed. Even when the ratio of TBP
U ratio was low, the peak at 4.5 Å was high, indicating that a more poly-core complex formed. Even when the ratio of TBP![[thin space (1/6-em)]](https://www.rsc.org/images/entities/char_2009.gif) :
:![[thin space (1/6-em)]](https://www.rsc.org/images/entities/char_2009.gif) U was low, if the concentration of uranyl nitrate and TBP concentration was high, the formation of poly-core species also decreased dramatically. The diffusion constants of uranyl nitrate and TBP were larger for the system with lower solute concentration, as shown in Table 2; however, there was no direct clue to the formation of poly-core species from the diffusion constants.
U was low, if the concentration of uranyl nitrate and TBP concentration was high, the formation of poly-core species also decreased dramatically. The diffusion constants of uranyl nitrate and TBP were larger for the system with lower solute concentration, as shown in Table 2; however, there was no direct clue to the formation of poly-core species from the diffusion constants.
| System | Number of molecules | Diffusion constants (×10−5 cm2 s−1) | ||
|---|---|---|---|---|
| Uranyl nitrate | TBP | CO2 | ||
| I | 100U + 200TBP + 10000CO2 | 0.4932 | 0.6024 | 7.1735 |
| II | 100U + 600TBP + 10000CO2 | 0.3193 | 0.5535 | 3.8410 |
| III | 100U + 200TBP + 40000CO2 | 0.7579 | 0.9831 | 8.7793 |
| IV | 100U + 600TBP + 40000CO2 | 0.5884 | 1.1091 | 7.7932 |
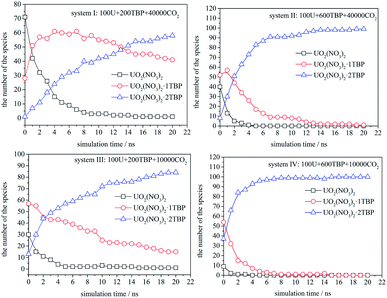
The speciation distribution is shown in Fig. 4, and the time 0 ns was the starting point of the production stage of simulation. It can be seen that, in different systems, the change of species with time was quite different. For the system with 600 TBP (system II and IV), the ultimate species was 1![[thin space (1/6-em)]](https://www.rsc.org/images/entities/char_2009.gif) :
:![[thin space (1/6-em)]](https://www.rsc.org/images/entities/char_2009.gif) 2 species, and the condensed system IV formed 1
2 species, and the condensed system IV formed 1![[thin space (1/6-em)]](https://www.rsc.org/images/entities/char_2009.gif) :
:![[thin space (1/6-em)]](https://www.rsc.org/images/entities/char_2009.gif) 2 species more quickly. For the system without enough TBP, the species distribution was different. In the sparse system (system I), the 1
2 species more quickly. For the system without enough TBP, the species distribution was different. In the sparse system (system I), the 1![[thin space (1/6-em)]](https://www.rsc.org/images/entities/char_2009.gif) :
:![[thin space (1/6-em)]](https://www.rsc.org/images/entities/char_2009.gif) 1 species increased first, and then decreased slowly, while for the condensed system (system III), the 1
1 species increased first, and then decreased slowly, while for the condensed system (system III), the 1![[thin space (1/6-em)]](https://www.rsc.org/images/entities/char_2009.gif) :
:![[thin space (1/6-em)]](https://www.rsc.org/images/entities/char_2009.gif) 1 species decreased continuously. Only system I had a large amount of 1
1 species decreased continuously. Only system I had a large amount of 1![[thin space (1/6-em)]](https://www.rsc.org/images/entities/char_2009.gif) :
:![[thin space (1/6-em)]](https://www.rsc.org/images/entities/char_2009.gif) 1 species after 20 ns, which was also easy to observe the poly-core uranyl species. This was also consistent with the RDF analysis. The value of RDFU⋯U at 4.5 Å in system I was the highest among the systems. We retrieved the trajectories of the poly-core formation process. The 2
1 species after 20 ns, which was also easy to observe the poly-core uranyl species. This was also consistent with the RDF analysis. The value of RDFU⋯U at 4.5 Å in system I was the highest among the systems. We retrieved the trajectories of the poly-core formation process. The 2![[thin space (1/6-em)]](https://www.rsc.org/images/entities/char_2009.gif) :
:![[thin space (1/6-em)]](https://www.rsc.org/images/entities/char_2009.gif) 3 species was formed by the collision of 1
3 species was formed by the collision of 1![[thin space (1/6-em)]](https://www.rsc.org/images/entities/char_2009.gif) :
:![[thin space (1/6-em)]](https://www.rsc.org/images/entities/char_2009.gif) 1 and 1
1 and 1![[thin space (1/6-em)]](https://www.rsc.org/images/entities/char_2009.gif) :
:![[thin space (1/6-em)]](https://www.rsc.org/images/entities/char_2009.gif) 2 species. At first, the interaction was established by the attraction of ONO3 in 1
2 species. At first, the interaction was established by the attraction of ONO3 in 1![[thin space (1/6-em)]](https://www.rsc.org/images/entities/char_2009.gif) :
:![[thin space (1/6-em)]](https://www.rsc.org/images/entities/char_2009.gif) 2 species and U atom in 1
2 species and U atom in 1![[thin space (1/6-em)]](https://www.rsc.org/images/entities/char_2009.gif) :
:![[thin space (1/6-em)]](https://www.rsc.org/images/entities/char_2009.gif) 1 species, then a reconfiguration of the cluster and exchange of TBP molecules occurred, subsequently a stable 2
1 species, then a reconfiguration of the cluster and exchange of TBP molecules occurred, subsequently a stable 2![[thin space (1/6-em)]](https://www.rsc.org/images/entities/char_2009.gif) :
:![[thin space (1/6-em)]](https://www.rsc.org/images/entities/char_2009.gif) 3 species formed. The 3
3 species formed. The 3![[thin space (1/6-em)]](https://www.rsc.org/images/entities/char_2009.gif) :
:![[thin space (1/6-em)]](https://www.rsc.org/images/entities/char_2009.gif) 3 species was formed when three 1
3 species was formed when three 1![[thin space (1/6-em)]](https://www.rsc.org/images/entities/char_2009.gif) :
:![[thin space (1/6-em)]](https://www.rsc.org/images/entities/char_2009.gif) 1 species met almost in the same time. Therefore, the presence of 1
1 species met almost in the same time. Therefore, the presence of 1![[thin space (1/6-em)]](https://www.rsc.org/images/entities/char_2009.gif) :
:![[thin space (1/6-em)]](https://www.rsc.org/images/entities/char_2009.gif) 1 species was the key to the formation of poly-core species, and the side without TBP of 1
1 species was the key to the formation of poly-core species, and the side without TBP of 1![[thin space (1/6-em)]](https://www.rsc.org/images/entities/char_2009.gif) :
:![[thin space (1/6-em)]](https://www.rsc.org/images/entities/char_2009.gif) 1 species had the ability to contact with other 1
1 species had the ability to contact with other 1![[thin space (1/6-em)]](https://www.rsc.org/images/entities/char_2009.gif) :
:![[thin space (1/6-em)]](https://www.rsc.org/images/entities/char_2009.gif) 1 species or 1
1 species or 1![[thin space (1/6-em)]](https://www.rsc.org/images/entities/char_2009.gif) :
:![[thin space (1/6-em)]](https://www.rsc.org/images/entities/char_2009.gif) 2 species. The system with a low TBP
2 species. The system with a low TBP![[thin space (1/6-em)]](https://www.rsc.org/images/entities/char_2009.gif) :
:![[thin space (1/6-em)]](https://www.rsc.org/images/entities/char_2009.gif) U ratio and low TBP concentration produced more 1
U ratio and low TBP concentration produced more 1![[thin space (1/6-em)]](https://www.rsc.org/images/entities/char_2009.gif) :
:![[thin space (1/6-em)]](https://www.rsc.org/images/entities/char_2009.gif) 1 species, which could further generate poly-core species.
1 species, which could further generate poly-core species.
3.2 Simulation with H2O
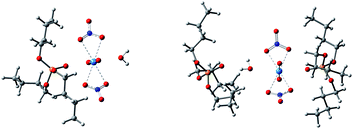
Anhydrous uranyl nitrate can be obtained by the reaction of U3O8 with N2O4 in a water-free container, whereas the readily available uranyl nitrate usually contains six water molecules.38 Therefore, the system with six times of water molecules was examined with the TIP3P water model. The main species in systems V–VIII were [UO2(NO3)2]·2H2O, TBP·[UO2(NO3)2]·H2O, [UO2(NO3)2]·2TBP and TBP·H2O. Other species such as [UO2(NO3)2]·H2O, [UO2(NO3)2]·1TBP were seldom observed, which only appeared at the beginning of production stage. Interestingly, the TBP-H2O species could coordinate with TBP-uranyl species to obtain a [UO2(NO3)·H2O]·2TBP species, as shown in Fig. 5.The peak at 4.5 Å of the RDFU⋯U curve disappeared, as shown in Fig. 6. It was difficult to form the poly-core complex in the presence of water because the coordination of H2O with uranium atoms would prevent the approaching of another uranium atom. The RDF of U⋯OH2O was about 2.7 Å, and when the amount of TBP molecules was high, the peak intensity at 2.7 Å decreased, suggesting that more number of water molecules were replaced by TBP. This coincides with solvent extraction situation, that the complexation of uranyl with TBP is achieved by the replacement of the water molecules of the hydrated uranyl ions by TBP.
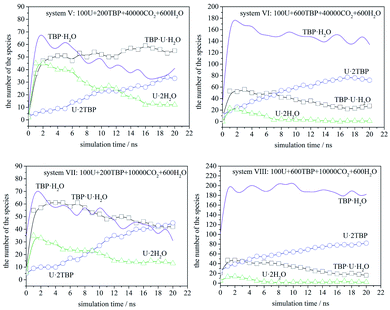
The speciation distribution is shown in Fig. 7. The species TBP·H2O fluctuated largely in all systems, which suggested that this species was less stable. Also, TBP·H2O decreased gradually over time when TBP was insufficient, while it remained constant in the systems with 600 TBP. [UO2(NO3)2]·2TBP species increased gradually, while [UO2(NO3)2]·2H2O and TBP·[UO2(NO3)2]·H2O increased first, and then decreased gradually, except for system V. Therefore, it is assumed that, at the beginning of the simulation, uranyl nitrate coordinated with water and TBP quickly at its two coordination sites, resulting in the formation of [UO2(NO3)2]·2H2O or TBP·[UO2(NO3)2]·H2O, rather than one site coordination species, [UO2(NO3)2]·H2O or TBP·[UO2(NO3)2]. Moreover, excess water molecules complexed with TBP, forming TBP·H2O species. Then, the thermodynamically stable species [UO2(NO3)2]·2TBP developed gradually, and kinetically favoured species decreased accordingly. We also compared system V and VII. Because the TBP was not sufficient in system V, TBP·H2O species decreased, suggesting that TBP·H2O species would dissociate, and that the released TBP molecules were captured by uranyl nitrate or uranyl complex. There was a clear tendency that TBP·[UO2(NO3)2]·H2O species converted into [UO2(NO3)2]·2TBP species. As shown by systems VI, VII and VIII, when the amount of [UO2(NO3)2]·2H2O was already very low, the number of TBP·[UO2(NO3)2]·H2O molecules decreased, while that of [UO2(NO3)2]·2TBP increased. An exception was noticed in system V, in which the amount of TBP·[UO2(NO3)2]·H2O remained constant in the closure of simulation because of the low density of free TBP; this suggested that free TBP is needed for the conversion reaction to occur. As for the system with 600 TBP, the number of [UO2(NO3)2]·2TBP at 20 ns was much higher, and even when there were free TBP, the TBP·[UO2(NO3)2]·H2O species still coexisted.
3.3 Simulation at the interface
In experimental situation, the complexation would first take place in the interface of uranyl nitrate and supercritical CO2 phases. Although it is difficult to simulate the system starting from the phase interface, we preliminary attempted to explore the situation. A system containing uranyl nitrate layer of 25 Å thickness was constructed using the Packmol software, in which 3000 uranyl nitrates were packed in the box of 150 × 150 × 25 Å, while TBP and CO2 were packed in the rest of the cube of 150 Å length, as shown in Fig. 8. The solid phase present for a long time after a mixing period at 700 K was applied. A large proportion of TBP complexed with uranyl nitrate at the surface of uranyl nitrate layer, leading to a further decline in the concentration of TBP in supercritical CO2. There were about 170 TBP and 60 uranyl nitrates in the bulk of supercritical CO2 phase at 1 ns, whereas the number decreased to 70 and 50, respectively, at 20 ns. In the supercritical CO2 phase, 1![[thin space (1/6-em)]](https://www.rsc.org/images/entities/char_2009.gif) :
:![[thin space (1/6-em)]](https://www.rsc.org/images/entities/char_2009.gif) 1, 1
1, 1![[thin space (1/6-em)]](https://www.rsc.org/images/entities/char_2009.gif) :
:![[thin space (1/6-em)]](https://www.rsc.org/images/entities/char_2009.gif) 2 and 2
2 and 2![[thin space (1/6-em)]](https://www.rsc.org/images/entities/char_2009.gif) :
:![[thin space (1/6-em)]](https://www.rsc.org/images/entities/char_2009.gif) 3 species were also identified, which further verified our results that poly-core species would form in supercritical CO2.
3 species were also identified, which further verified our results that poly-core species would form in supercritical CO2.
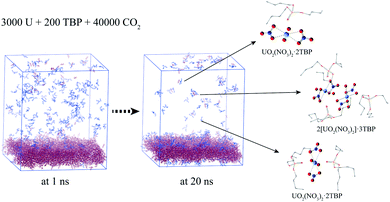 | ||
| Fig. 8 Complexation at the interface of anhydrate uranyl nitrate/supercritical CO2 (CO2 was hidden for clarity). | ||
As for the system of hydrated uranyl nitrate, uranyl nitrate and water molecules were packed in a layer of 25 Å thickness. After heated at 700 K, some uranyl nitrate and water entered the supercritical CO2 phase. The solid layer remained aggregated at the stage of production simulation. Also, more TBP aggregated at the surface of the solid phase, further reducing the concentration of TBP in the supercritical phase. In the bulk of the supercritical phase, the species were similar to that of the perfect mixing system containing water. No poly-core species was formed. Presumably, when the solid phase was “disturbed” by heating, the uranyl nitrate and water entered the supercritical CO2 phase simultaneously, holding a proportion consistent with the solid phase.
4 Conclusions
The complexation mechanism of uranyl with TBP in a water-deficient or non-water system, such as supercritical CO2 extraction or ionic liquid extraction, is quite different from that of a liquid–liquid extraction system. Here, the complexation of anhydrous and hydrate uranyl nitrate with TBP in supercritical CO2 was investigated. Poly-core uranyl species were present in the system without water once 1![[thin space (1/6-em)]](https://www.rsc.org/images/entities/char_2009.gif) :
:![[thin space (1/6-em)]](https://www.rsc.org/images/entities/char_2009.gif) 1 species was formed. However, in the system with water, the 1
1 species was formed. However, in the system with water, the 1![[thin space (1/6-em)]](https://www.rsc.org/images/entities/char_2009.gif) :
:![[thin space (1/6-em)]](https://www.rsc.org/images/entities/char_2009.gif) 1 species quickly coordinated by one water molecule, resulting in the formation of TBP·[UO2(NO3)2]·H2O, preventing the formation of poly-core species. It also revealed that uranyl nitrate would complex with TBP and H2O quickly, and then gradually changed to a thermodynamically stable 1
1 species quickly coordinated by one water molecule, resulting in the formation of TBP·[UO2(NO3)2]·H2O, preventing the formation of poly-core species. It also revealed that uranyl nitrate would complex with TBP and H2O quickly, and then gradually changed to a thermodynamically stable 1![[thin space (1/6-em)]](https://www.rsc.org/images/entities/char_2009.gif) :
:![[thin space (1/6-em)]](https://www.rsc.org/images/entities/char_2009.gif) 2 complex. The attempt of describing the species distribution with time was successful, which helped to understand the path of complexation, and how the experimental conditions take effect. The results facilitate the understanding of complexation of uranyl with TBP in supercritical CO2, and the developed speciation distribution analysis would be beneficial to the simulation research on the liquid–liquid extraction system.
2 complex. The attempt of describing the species distribution with time was successful, which helped to understand the path of complexation, and how the experimental conditions take effect. The results facilitate the understanding of complexation of uranyl with TBP in supercritical CO2, and the developed speciation distribution analysis would be beneficial to the simulation research on the liquid–liquid extraction system.
Conflicts of interest
There are no conflicts to declare.Acknowledgements
This work was supported by the National Science Foundation of China, No. 21790371. The authors thank Prof. Guoxin Tian (CIAE) for the deep discussion of actinide coordination. Liyang Zhu thanks Prof. WA De Jong (LBNL) for the fruitful discussion of molecular dynamics and DFT calculation.References
- Y. Lin, R. D. Brauer, K. E. Laintz and C. M. Wai, Anal. Chem., 1993, 65, 2549–2551 CrossRef CAS.
- A. Leybros, L. Hung, A. Hertz, D. Hartmann, A. Grandjean and O. Boutin, Chem. Eng. J., 2017, 316, 196–203 CrossRef CAS.
- L. Zhu, W. Duan, J. Xu and Y. Zhu, J. Hazard. Mater., 2012, 241–242, 456–462 CrossRef CAS PubMed.
- M. D. Samsonov, C. M. Wai, S. C. Lee, Y. Kulyako and N. G. Smart, Chem. Commun., 2001, 1868–1869 RSC.
- J. S. Wang, C. N. Sheaff, B. Yoon, R. S. Addleman and C. M. Wai, Chem.–Eur J., 2009, 15, 4458–4463 CrossRef CAS PubMed.
- A. Rao and A. Srivastava, Sep. Purif. Technol., 2021, 257, 117950 CrossRef CAS.
- L. Zhu, Z. Wang, H. He and G. Tian, RSC Adv., 2016, 6, 96531–96537 RSC.
- P. Sahu, A. K. Deb, S. M. Ali and K. T. Shenoy, J. Mol. Liq., 2021, 330, 115621 CrossRef CAS.
- G. Benay and G. Wipff, J. Phys. Chem. B, 2014, 118, 3133–3149 CrossRef CAS PubMed.
- M. J. Servis, D. T. Wu, J. C. Shafer and A. E. Clark, Chem. Commun., 2018, 54, 10064–10067 RSC.
- S. Cui, V. F. de Almeida and B. Khomami, J. Phys. Chem. B, 2014, 118, 10750–10760 CrossRef CAS PubMed.
- P. Sahu, S. M. Ali and K. T. Shenoy, Phys. Chem. Chem. Phys., 2016, 18, 23769–23784 RSC.
- P. Guilbaud, L. Berthon, W. Louisfrema, O. Diat and N. Zorz, Chem.–Eur J., 2017, 23, 16660–16670 CrossRef CAS PubMed.
- M. Baaden, R. Schurhammer and G. Wipff, J. Phys. Chem. B, 2002, 106, 434–441 CrossRef CAS.
- R. Schurhammer and G. Wipff, J. Phys. Chem. A, 2005, 109, 5208–5216 CrossRef CAS PubMed.
- G. Gopakumar, B. Sreenivasulu, A. Suresh, C. V. S. Brahmmananda Rao, N. Sivaraman, M. Joseph and A. Anoop, J. Phys. Chem. A, 2016, 120, 4201–4210 CrossRef CAS PubMed.
- M. J. Frisch, G. W. Trucks, H. B. Schlegel, G. E. Scuseria, M. A. Robb, J. R. Cheeseman, G. Scalmani, V. Barone, G. A. Petersson, H. Nakatsuji, X. Li, M. Caricato, A. V. Marenich, J. Bloino, B. G. Janesko, R. Gomperts, B. Mennucci, H. P. Hratchian, J. V. Ortiz, A. F. Izmaylov, J. L. Sonnenberg, D. Williams-Young, F. Ding, F. Lipparini, F. Egidi, J. Goings, B. Peng, A. Petrone, T. Henderson, D. Ranasinghe, V. G. Zakrzewski, J. Gao, N. Rega, G. Zheng, W. Liang, M. Hada, M. Ehara, K. Toyota, R. Fukuda, J. Hasegawa, M. Ishida, T. Nakajima, Y. Honda, O. Kitao, H. Nakai, T. Vreven, K. Throssell, J. A. Montgomery Jr, J. E. Peralta, F. Ogliaro, M. J. Bearpark, J. J. Heyd, E. N. Brothers, K. N. Kudin, V. N. Staroverov, T. A. Keith, R. Kobayashi, J. Normand, K. Raghavachari, A. P. Rendell, J. C. Burant, S. S. Iyengar, J. Tomasi, M. Cossi, J. M. Millam, M. Klene, C. Adamo, R. Cammi, J. W. Ochterski, R. L. Martin, K. Morokuma, O. Farkas, J. B. Foresman and D. J. Fox, Gaussian, Inc., Wallingford CT, 2016.
- S. Grimme, S. Ehrlich and L. Goerigk, J. Comput. Chem., 2011, 32, 1456–1465 CrossRef CAS PubMed.
- T. Moriyoshi, T. Kita and Y. Uosaki, Ber. Bunsenges. Physik. Chem., 1993, 97, 589–596 CrossRef CAS.
- T. Lu and F. Chen, J. Comput. Chem., 2012, 33, 580–592 CrossRef CAS PubMed.
- J. Mu, R. Motokawa, C. D. Williams, K. Akutsu, S. Nishitsuji and A. J. Masters, J. Phys. Chem. B, 2016, 120, 5183–5193 CrossRef CAS PubMed.
- D. A. Case, I. Y. Ben-Shalom, S. R. Brozell, D. S. Cerutti, T. E. Cheatham III, V. W. D. Cruzeiro, T. A. Darden, R. E. Duke, D. Ghoreishi, M. K. Gilson, H. Gohlke, A. W. Goetz, D. Greene, R. Harris, N. Homeyer, Y. Huang, S. Izadi, A. Kovalenko, T. Kurtzman, T. S. Lee, S. LeGrand, P. Li, C. Lin, J. Liu, T. Luchko, R. Luo, D. J. Mermelstein, K. M. Merz, Y. Miao, G. Monard, C. Nguyen, H. Nguyen, I. Omelyan, A. Onufriev, F. Pan, R. Qi, D. R. Roe, A. Roitberg, C. Sagui, S. Schott-Verdugo, J. Shen, C. L. Simmerling, J. Smith, R. Salomon-Ferrer, J. Swails, R. C. Walker, J. Wang, H. Wei, R. M. Wolf, X. Wu, L. Xiao, D. M. York and P. A. Kollman, AMBER 2018, University of California, San Francisco, 2018 Search PubMed.
- A. Zhu, X. Zhang, Q. Liu and Q. Zhang, Chin. J. Chem. Eng., 2009, 17, 268–272 CrossRef CAS.
- J. M. Seminario, Int. J. Quantum Chem., 1996, 60, 1271–1277 CrossRef.
- P. Li and K. M. Merz, J. Chem. Inf. Model., 2016, 56, 599–604 CrossRef CAS PubMed.
- L. Martínez, R. Andrade, E. G. Birgin and J. M. Martínez, J. Comput. Chem., 2009, 30, 2157–2164 CrossRef PubMed.
- M. J. Carrott, B. E. Waller, C. M. Wai, M. J. Carrott and N. G. Smart, Chem. Commun., 1998, 373–374 RSC.
- J.-P. Ryckaert, G. Ciccotti and H. J. C. Berendsen, J. Comput. Phys., 1977, 23, 327–341 CrossRef CAS.
- A. W. Götz, M. J. Williamson, D. Xu, D. Poole, S. Le Grand and R. C. Walker, J. Chem. Theory Comput., 2012, 8, 1542–1555 CrossRef PubMed.
- R. Salomon-Ferrer, A. W. Götz, D. Poole, S. Le Grand and R. C. Walker, J. Chem. Theory Comput., 2013, 9, 3878–3888 CrossRef CAS PubMed.
- W. Humphrey, A. Dalke and K. Schulten, J. Mol. Graphics, 1996, 14, 33–38 CrossRef CAS PubMed.
- X. Cao and M. Dolg, J. Mol. Struct.: THEOCHEM, 2004, 673, 203–209 CrossRef CAS.
- F. Weigend and R. Ahlrichs, Phys. Chem. Chem. Phys., 2005, 7, 3297–3305 RSC.
- D. R. Roe and T. E. Cheatham, J. Chem. Theory Comput., 2013, 9, 3084–3095 CrossRef CAS PubMed.
- P. K. Verma, N. Kumari, P. N. Pathak, B. Sadhu, M. Sundararajan, V. K. Aswal and P. K. Mohapatra, J. Phys. Chem. A, 2014, 118, 3996–4004 CrossRef CAS PubMed.
- V. Serezhkin, G. Sidorenko, D. Pushkin and L. Serezhkina, Radiochemistry, 2014, 56, 115–133 CrossRef CAS.
- P. Tecmer, F. Schindler, A. Leszczyk and K. Boguslawski, Phys. Chem. Chem. Phys., 2020, 22, 10845–10852 RSC.
- L. Zhu, W. Duan, J. Xu and Y. Zhu, Ind. Eng. Chem. Res., 2010, 49, 11195–11199 CrossRef CAS.
Footnote |
| † Electronic supplementary information (ESI) available. See DOI: 10.1039/d1ra06512b |
| This journal is © The Royal Society of Chemistry 2021 |

