 Open Access Article
A highly stable and sensitive ethanol sensor based on Ru-decorated 1D WO3 nanowires†
Jianjun Lia,
Qiongling Dinga,
Xichao Moa,
Zihao Zoub,
Pu Chengb,
Yiding Lib,
Kai Sunb,
Yujun Fub,
Yanrong Wang *a and
Deyan Heb
aSchool of Physical Science and Technology, Lanzhou University, Lanzhou 730000, China. E-mail: wyr@lzu.edu.cn
bSchool of Materials and Energy, Lanzhou University, Lanzhou 730000, China
First published on 8th December 2021
Abstract
Decorating materials with noble metal catalysts is an effective method for optimizing the sensing performance of sensors based on tungsten trioxide (WO3) nanowires. Ruthenium (Ru) exhibits excellent catalytic activity for oxygen adsorption/desorption and chemical reactions between gases and adsorbed oxygen. Herein, small Ru nanoparticles were uniformly distributed on the surface of one-dimensional WO3 nanowires. The nanowires were prepared by the electrospinning method through an ultraviolet (UV) irradiation process, and decoration with Ru did not change their morphology. A sensor based on 4% Ru nanowires (NWs) shows the highest response (∼120) to 100 ppm ethanol, which was increased around 47 times, and the lowest ethanol detection limit (221 ppb) at a lower temperature (200 °C) displays outstanding repeatability and stability even after 45 days or in higher-humidity conditions. Moreover, it also has faster response–recovery features. The improvement in the sensing performance was attributed to the stable morphology of the nanowires, the sensitization effect of Ru, the catalytic effect of RuO2 and the optimal atomic utilization efficiency. This work offers an effective and promising strategy for promoting the ethanol sensing performance of WO3.
1 Introduction
The electrical properties of metal oxide semiconductors (MOS) are related to the ambient atmosphere, and they have the features of low cost, robustness, and easy synthesis.1–3 Thus, they play a significant role in gas sensing applications to detect toxic, inflammable and explosive gases,4–6 and are more favored by scientific researchers compared to sensors based on metamaterials7–10 or nanophotonics.11–13 MOS-based sensors have been reported over the past several decades, including sensors based on CuO,14 SnO2,15 In2O3,16 Co3O4,17 Fe2O3,18 ZnO,19 and NiO,20 for applications such as monitoring air quality and ensuring industrial safety. The discharge and leakage of volatile organic compounds (VOCs) into the environment are inevitable because of the limitations of current production technology. There is significant harm to human health when people live in an environment with VOC gases.21–23 Thus, it is of great concern to design devices, such as sensors based on complementary infrared ray metamaterials, for the purpose of detecting VOCs.24 Ethanol is a typical flammable and volatile colorless transparent liquid at normal temperature and pressure, and is widely used in national defense, the chemical industry, medicine and healthcare, the food industry, and industrial and agricultural production.25,26 In particular, ethanol vapor can form an explosive mixture with air, and it is also an inhibitor of the central nervous system.27 Therefore, from a human health perspective, many efforts to improve the properties of sensors for monitoring ethanol are urgently needed.Tungsten trioxide (WO3), with a morphology that is easily controlled through various synthesis methods, is an n-type MOS material28 and displays good gas sensitivity in the detection of NO2,29 xylene,30 methanol,31 and acetone.32 Based on the typical gas sensing mechanism of MOS materials,33 various methods for optimizing the sensing performance of WO3-based sensors have been studied. These include different methods such as morphology control,34 heterostructure construction,35 defect introduction,36 and metal doping or decoration. Among these methods, using noble metals (Au,37 Pd,38 Pt39) to decorate the MOS material surface is considered to be a promising strategy to boost its sensing performance due to their catalytic properties, sensitization effect, or spillover effect. However, the long-term stability of sensors prepared through the functional modification of the surface of WO3 is usually poor. Generally, a sensing material should provide sufficient reaction sites between the target gas and adsorbed oxygen, meaning that the materials need a large specific surface area; therefore, nanomaterials are regarded as good candidate materials for fabricating sensors.
Electrospinning has become one of the main ways to effectively prepare nanomaterials due to the simple and controllable manufacturing process, low cost, and the wide range of spinnable materials.40,41 Electrospun nanowires have a high specific surface area and porosity, which increases the area of interaction between the sensing material and the target object. Therefore, electrospun nanomaterials are expected to significantly improve the performance of gas sensors.42,43 Ruthenium (Ru) is a relatively inexpensive noble metal with stable properties and strong corrosion resistance, and it has been reported as an effective catalyst for the hydrogen evolution reaction44 and conversion of VOCs.45 Ascribed to its favorable electronic properties, the introduction of Ru can promote the formation of oxygen-containing species adsorbed on the surface of materials and effectively break C–C bonds, which improves the chemical reaction between ethanol and adsorbed oxygen.46–48 In addition, ethoxy species of ethanol are always present as monodentates with their oxygen atom bound to one Ru atom.49 In recent years, there has been no shortage of published articles on Ru doping or the modification of MOS materials to optimize the gas sensing performance of MOS-based sensors.50,51 Thus, Ru decoration methods may promote ethanol sensing performance.
Based on the above discussion, in this work, 1D WO3 nanowires (NWs) were prepared through a traditional electrospinning method. Ru catalyst particles were successfully decorated on the surface of the WO3 NWs through a UV irradiation process with tungstic acid and ruthenium chloride hydrate as the raw materials. Sensors based on 4% Ru loaded on WO3 show an outstanding response, rapid response and recovery, and excellent selectivity to ethanol. The introduction of Ru also decreases the optimum working temperature of the sensor. Furthermore, the effect of moisture and the long-term stability of these sensors were also studied. The results obtained herein clearly demonstrate that decorating the surface of WO3 NWs with a moderate amount of Ru is an effective and promising method for promoting ethanol-sensing performance.
2 Experimental section
2.1 Preparation of pure WO3 nanowires
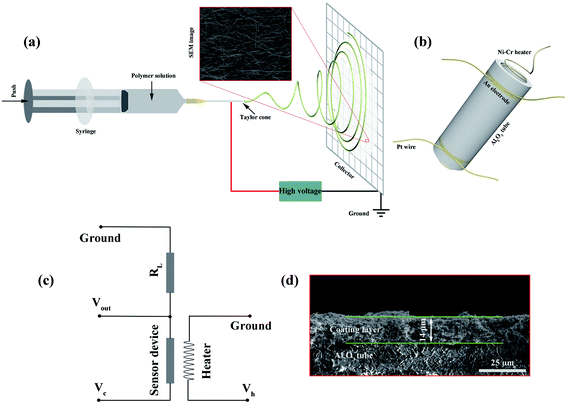
All the relevant chemicals used in this work were of analytical grade and were used directly without purification. Deionized (DI) water with a resistivity of 18.25 MΩ cm was used in all synthesis and fabrication processes. The WO3 NWs were prepared by an optimized traditional electrospinning method followed by an annealing process using tungstic acid as a precursor following a modified method reported previously.52 The preparation of pure WO3 nanowires (NWs) is shown schematically in Fig. 1a. Briefly, 1.7 g polyvinylpyrrolidone (PVP, average MW ∼1![[thin space (1/6-em)]](https://www.rsc.org/images/entities/char_2009.gif) 300
300![[thin space (1/6-em)]](https://www.rsc.org/images/entities/char_2009.gif) 000) was placed in a bottle with a mixed solvent containing 5 mL absolute ethanol and 2 mL DI water. This mixture was vigorously stirred for 5 h. 4 mL ammonia was poured into a bottle with 390 mg tungstic acid. This bottle was placed in a 65 °C water bath and stirred for 2 h. The ammonia solution was then slowly poured into the PVP solution and stirred constantly overnight. The obtained milky white precursor solution was then drawn into a plastic syringe. The parameters of the electrospinning process were set as follows: an applied voltage of 19 kV, a feed rate of 0.2 mL h−1, and a working distance of 20 cm. The obtained precursor wires were preoxidized at 200 °C for 2 h and annealed at 500 °C for 2 h in a muffle furnace with a heating rate of 1 °C min−1 to remove the PVP. The samples were cooled to 300 °C with a cooling rate of 2 °C min−1, followed by natural cooling to room temperature to obtain pure WO3 NWs, denoted as 0% Ru NWs.
000) was placed in a bottle with a mixed solvent containing 5 mL absolute ethanol and 2 mL DI water. This mixture was vigorously stirred for 5 h. 4 mL ammonia was poured into a bottle with 390 mg tungstic acid. This bottle was placed in a 65 °C water bath and stirred for 2 h. The ammonia solution was then slowly poured into the PVP solution and stirred constantly overnight. The obtained milky white precursor solution was then drawn into a plastic syringe. The parameters of the electrospinning process were set as follows: an applied voltage of 19 kV, a feed rate of 0.2 mL h−1, and a working distance of 20 cm. The obtained precursor wires were preoxidized at 200 °C for 2 h and annealed at 500 °C for 2 h in a muffle furnace with a heating rate of 1 °C min−1 to remove the PVP. The samples were cooled to 300 °C with a cooling rate of 2 °C min−1, followed by natural cooling to room temperature to obtain pure WO3 NWs, denoted as 0% Ru NWs.
2.2 Preparation of Ru-decorated WO3 nanowires
For the Ru-decorated samples, various atomic concentrations of Ru (at% = 2, 3, 4, 5, and 6) were used to functionalize the surface of the WO3 NWs via a UV irradiation process. In a typical process, 30 mg 0% Ru NWs were dispersed in 9 mL DI water under ultrasonic agitation for 15 min. The corresponding amount of ruthenium chloride hydrate (RuCl3, 0.02 M) aqueous solution was added dropwise at 500 rpm. The solution was stirred at 500 rpm for 5 min and then at 1000 rpm for 10 min. UV irradiation was then performed at 300 rpm for 5 h. The products were centrifuged at 8000 rpm for 4 min and washed with DI water and absolute ethanol several times. Finally, the samples were dried at 60 °C for 12 h. The corresponding samples were denoted as 2, 3, 4, 5, and 6% Ru NWs.2.3 Sensor fabrication and measurement
The gas sensing performance of the samples was measured using a WS-30B gas sensing measurement system (Wei-Sheng Electronics Co., Ltd, China). First, a small amount of each prepared powder (0.7 mg for each device) was mixed with an appropriate amount of a laboratory-made organic binder containing 10 wt% ethyl cellulose and 90 wt% terpineol. Each mixture was ground to form a paste, which was uniformly coated onto the surface of a ceramic tube with a pair of Au electrodes and four Pt wires; it is clear that the thickness of the sample coating layer is about 14 μm from the cross-sectional view SEM image of the sensor device shown in Fig. 1d. To completely remove the organic binder, a calcination process was carried out at 400 °C for 2 h in a muffle furnace. A Ni–Cr wire coil heater was inserted into the tubes to regulate the working temperature of the sensor devices by the providing the corresponding heating voltage (Vh). A schematic of the device is shown in Fig. 1b. For the purpose of obtaining good stability, the devices were aged at 200 °C for 36 h prior to testing. To determine the sensing performance of the sensors, all the devices were placed in a test chamber with an 18 L capacity and tested under ambient conditions (30 °C, 35 RH%). The devices were then preheated to various temperatures (110–230 °C) for about 0.5 h. At this point, when the electrical resistance values of the devices (Ra and Rg, which represent the resistances in air and in the presence of target gases, respectively) were stable, using the experimental setup shown in the schematic illustration in Fig. 1c, the resistance value of the devices was calculated using the formula: Ra (or Rg) = (Vc − Vout) × RL/Vout, (the value of Vc or RL was a known constant, Vout was obtained from the WS-30B gas sensing measurement system), a corresponding volume of the target gas was injected into the test chamber using a microinjector, and fans were used to accelerate gas dispersion. The response value S is defined as S = Ra/Rg. Furthermore, the response and recovery times (τres and τrec) are defined as the time required for the value of the resistance to change by 90%.2.4 Characterization
The structures, morphologies, and elemental compositions of the samples were characterized using field-emission scanning electron microscopy (FE-SEM, FEI Apreo-S), transmission electron microscopy (TEM, FEI Tecnai F30, operated at 300 kV), and energy-dispersive X-ray spectroscopy (EDS). X-ray powder diffraction (XRD, Malvern Panalytical) with Cu-Kα radiation (λ = 1.5406 Å) at 40 kV and 40 mA, as well as micro-Raman spectroscopy (Renishaw inVia-Reflex with an excitation wavelength of 785 nm) was used to analyze the crystalline phase structure and composition of the samples. The surface elemental chemical states of the samples were analyzed using X-ray photoelectron spectroscopy (XPS, Kratos Axis Ultra DLD with Al Kα probe beam). The C 1s peak (284.6 eV) was used as a reference for element binding energy calibration.3 Results and discussion
3.1 Structural and morphological characteristics
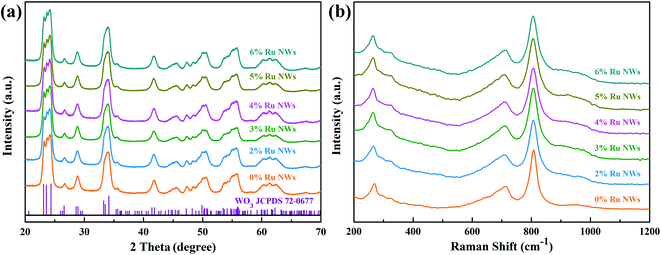
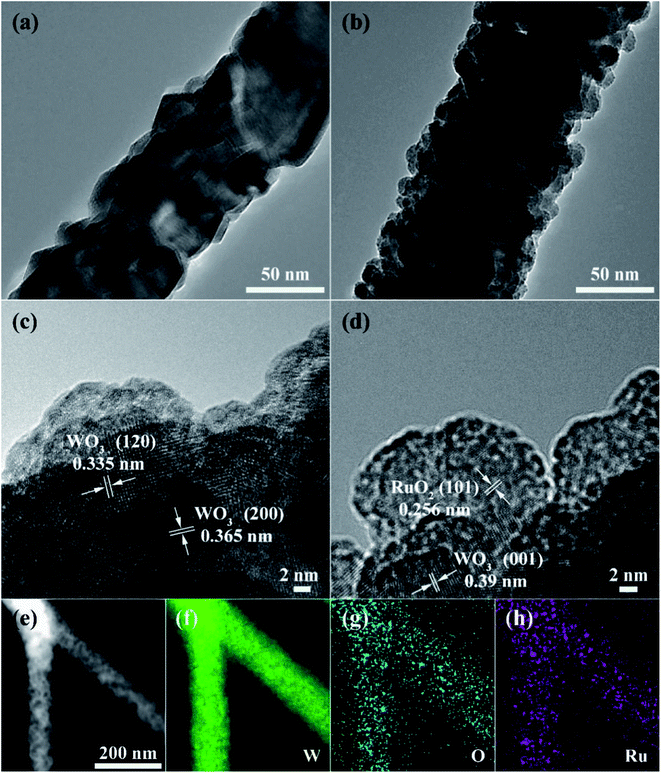
The XRD patterns of the pure and Ru-decorated WO3 NWs sample are shown in Fig. 2a, demonstrating the good crystallinity of all the samples, which were well-indexed to the monoclinic structure of WO3 (JCPDS card no. 72-0677). The main peaks located at 2θ = 23.11°, 23.58°, and 24.35° correspond to the (0 0 2), (0 2 0) and (2 0 0) lattice planes of WO3, respectively.52 No additional diffraction peaks corresponding to trace ruthenium or impurity phases were detected. The Raman spectra of the as-prepared samples are presented in Fig. 2b to further confirm their molecular structure information, and they illustrate that all the samples have similar spectra. The intense Raman peaks at shifts of 271 cm−1, 328 cm−1 and 715 cm−1, and 807 cm−1 can be assigned to the O–W–O bending vibration and stretching vibration modes of monoclinic-phase WO3,50 respectively. Overall, the XRD and Raman characterizations illustrate that the modification of the WO3 NWs with a trace amount of noble metals does not affect their crystal phase or molecular structure.The microstructures of as-prepared pure and Ru-loaded WO3 NW samples were observed through SEM and TEM images. Fig. 3a–f show that the rough and porous nanowires have a uniform diameter of about 100 nm, are constructed from a large number of WO3 nanoparticles, and exhibit a net structure of nanowires leading to a large mesoporous structure. This structure is beneficial for gas diffusion processes and achieving a highly sensitive response, because it has a high number of gas reaction and adsorption sites and is conducive to the diffusion or overflow of the surface of the materials.53 A comparison of the SEM images of the different samples shows that there is no difference in their morphology. The ruthenium loading level is very low, beyond the resolution limitation of SEM, but the images indicate that the presence of Ru does not affect the microstructure of the nanowires, in line with the XRD and Raman results. Furthermore, the TEM images shown in Fig. 4a and b also show that the 0% Ru NWs and 4% Ru NWs have a diameter of about 100 nm and are formed of many small WO3 nanoparticles even after Ru decoration. Fortunately, comparison of the TEM image of the 4% Ru NWs in Fig. 4b with the image obtained from the 0% Ru NWs shows that there are abundant Ru nanoparticles with a size of several nanometers loaded on the surface of the WO3 nanoparticles.
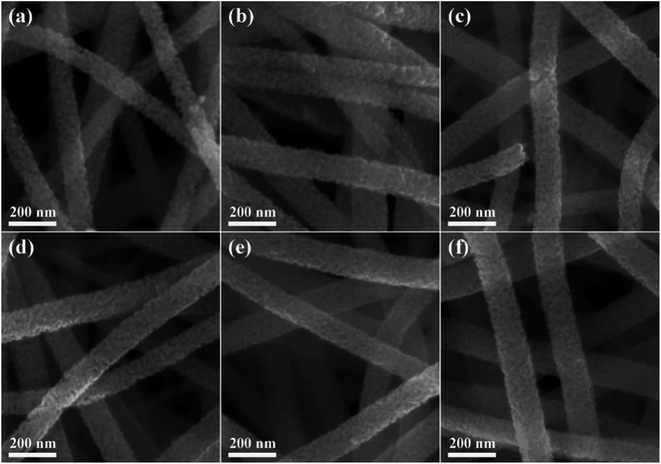 | ||
| Fig. 3 SEM images of different samples: (a) 0% Ru NWs; (b) 2% Ru NWs; (c) 3% Ru NWs; (d) 4% Ru NWs; (e) 5% Ru NWs; (f) 6% Ru NWs. | ||
The high-resolution transmission electron microscope (HRTEM) images of the samples shown in Fig. 4c and d present the lattice information, with interplanar distances of 0.335 nm, 0.356 nm, 0.39 nm, and 0.256 nm, which can be ascribed to the (1 2 0), (2 0 0), and (0 0 1) planes of monoclinic phase WO3 and the (1 0 1) planes of RuO2, respectively.21,51 The STEM image and corresponding EDS elemental mapping shown in Fig. 4e–h prove that W, O, and Ru are uniformly distributed in the 4% Ru NW sample. These results indicate that Ru is successfully decorated on the WO3 NWs and mainly exists in the form of RuO2.
3.2 Gas sensing performance
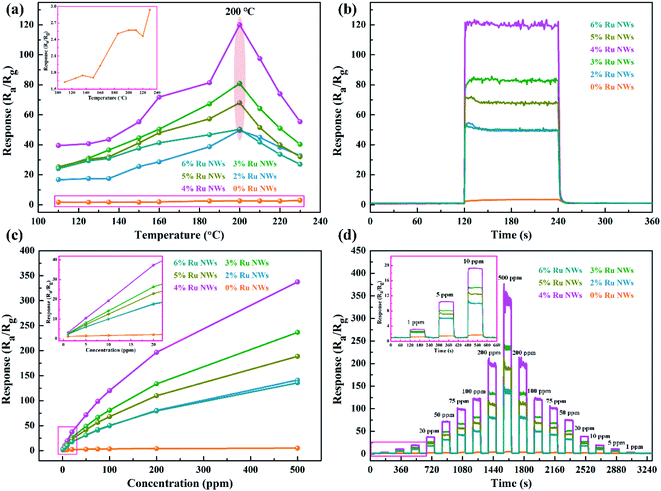
Determining the working temperature of sensor devices is very important for their practical application. In particular, achieving a low working temperature for sensors based on MOS is important to reduce power consumption and the risk of combustion or explosion when monitoring ethanol gas. Therefore, the relationship between the response of the sensor devices to 100 ppm ethanol over an operating temperature range of 110–230 °C was investigated, as shown in Fig. 5a. Clearly, the response values of the devices based on samples decorated with Ru increase as the working temperature increases in the range of 110–200 °C and decrease as the temperature increases further above 200 °C. Additionally, the response of the device based on the 0% Ru NW sample increases with temperature across the entire temperature range (as shown in the Fig. 5a inset), indicating that the optimum operating temperature of WO3 can be reduced by introducing catalytic Ru.51 The sensor based on 4% Ru NWs possesses the highest response to 100 ppm ethanol (120) at 200 °C, which is about 47 times higher than that of the sensor based on 0% Ru NWs under the same condition. This illustrates that decoration with Ru is a feasible method for enhancing the sensing performance of sensors based on WO3 NWs towards ethanol.Fig. 5b shows the dynamic response–recovery curves of the sensors towards 100 ppm ethanol at 200 °C. It is obvious that all the sensors based on Ru-decorated samples have an excellent response and recovery performance. Fig. S1a–j† displays the real-time curves of the variation of the sensor resistance at different temperatures in response to 100 ppm ethanol gas, which exhibit a classic n-type gas response phenomenon for n-type WO3 in the detection of reducing gases. The resistance of the devices changes more rapidly due to quicker adsorption and desorption of ethanol at high temperatures compared to low temperatures. Furthermore, the resistance can be restored to its original level at any temperature. The τres and τrec of the sensors based on 0% Ru NWs towards 100 ppm ethanol at 200 °C obtained from Fig. S1k and l† are 23 s and 58 s, and the corresponding values for the sensor based on 4% Ru NWs are 1 s and 18 s, respectively. This enhanced performance is ascribed to the catalytic effect of Ru, which promotes the chemical reaction between the target gas and adsorbed oxygen as well as the desorption of ethanol.54 Fig. S2† shows the baseline resistance of sensors at various temperatures under air; it can be found that the resistance value decreases with increasing temperature, which is a typical characteristic of semiconductor materials. The resistance values of the sensors based on Ru-decorated WO3 NWs are larger than those of the sensor based on the pure WO3 NWs, which is ascribed to the widening of the depletion layer caused by the transition of electrons from the MOS to the noble metal. The sensing performance of the sensors in this work is compared to that of previously reported materials based on WO3 in Table 1. These Ru-decorated WO3 NWs evidently display outstanding sensing performance towards ethanol, with the best response among the compared materials and a lower optimum working temperature.
| Sample | Top (°C) | Conc. (ppm) | Response (S) | Ref. |
|---|---|---|---|---|
| a Top: optimum working temperature of the sensors. | ||||
| Core–shell WO3–SnO2 nanofibers | 280 | 10 | 5.09 | 55 |
| WO3–SnO2 composite coating | 250 | 300 | 1.73 | 56 |
| Ce-doped WO3 | 350 | 1 | 12.3 | 57 |
| WO3·H2O network | 350 | 100 | 16 | 25 |
| Ga2O3–WO3 heterostructures | 275 | 100 | 14 | 58 |
| Au-decorated WO3 | 200 | 100 | 57 | 59 |
| ZnO–WO3 composite nanorods | 300 | 50 | 16.2 | 60 |
| Ru-decorated WO3 | 200 | 100 | 78 | This work |
The response values of all the devices as a function of ethanol concentration (from 1 to 500 ppm) at their optimal working temperature are shown in Fig. 5c. As can be seen, the response values of the sensors increase with increasing ethanol concentration, and the worst sensing performance is achieved using the sensors based on the 0% Ru NW sample. In contrast, the 4%-Ru-NW-based sensor displays an outstanding response. Additionally, the response of the sensor based on 0% Ru NWs only increases slightly when the concentration of ethanol gas is increased, while the responses of the sensors based on Ru-decorated NWs increase rapidly. Importantly, the response value increases almost linearly at low ethanol concentrations (1–20 ppm), and there is no saturation trend as the ethanol concentration increases to 500 ppm. Furthermore, the dynamic response and recovery curves and corresponding ethanol response as a function of concentration for every sensor are shown in Fig. 5d and S3a,† and demonstrate good symmetry when the ethanol concentration is increased and then decreased. Additionally, Fig. S3b† shows the relationship between ln(S) and ln(C) at the optimum sensor working temperature. The experimental data can be fitted well by a linear function, and show that the ethanol detection limit was 759 ppb, 290 ppb, 257 ppb, 211 ppb, 270 ppb and 303 ppb, respectively, for the sensor devices based on the 0%, 2%, 3%, 4%, 5%, and 6% Ru NW materials.
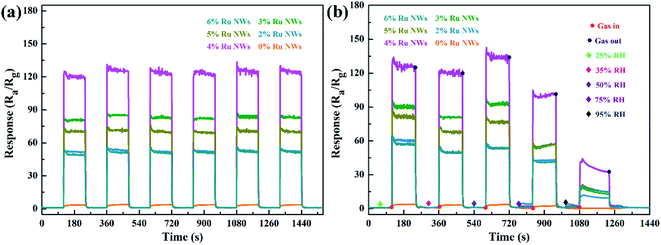
When a varying amount of ethanol gas is injected, the response is immediate and quickly achieves stability. The resistance returns to its previous level when the devices are exposed to air, even for an ethanol concentration of 1 ppm. Fig. 6a shows six response cycles towards 100 ppm ethanol at 200 °C. There is a slight increase in the response, which is ascribed to the surfaces of the materials being activated by ethanol. The result illustrates the outstanding repeatability and reproducibility of these sensors. Overall, these results prove that the sensors have the potential to sensitively detect ethanol across a wide range of practical conditions.
Moisture negatively affects gas sensors,18 so the effect of increasing humidity was investigated in this work. Fig. 6b displays the dynamic response curves of sensors exposed to ethanol under different RH conditions (25%, 35%, 50%, 75%, and 95%). There is only a slight change in the gas response even at 75% RH, although the sensors show better performance when the RH is 50%. The resistance of the devices slowly increases in a stable manner when the sensors are tested in a 95% RH environment. This is because water molecules occupy the gas and oxygen reaction sites, inhibiting the response. Such humidity effects are acceptable for practical application.
Selectivity is also a crucial factor for the practical application of sensor devices. The response of all the sensors exposed to 100 ppm of the gases CO, NH3, benzene, acetone, methanol, formaldehyde, NO2, and H2 were analyzed and are displayed in Fig. 7. The Ru-decorated sensors clearly demonstrate better sensing performance of all the VOC gases compared to the 0% Ru NWs sensor. Compared with their response to other gases, the sensors display optimal performance for the detection of ethanol. The sensor offers decent selectivity between ethanol and CO, benzene, formaldehyde, and NO2. However, the selectivity towards ethanol over acetone, methanol and ammonia is not as satisfactory. The selectivity towards acetone is unsatisfactory, which is ascribed to the fact that the samples without Ru modification showed the best sensing performance towards acetone. The introduction of Ru can effectively break C–C bonds in VOCs, and the ethoxy species of ethanol are always present as monodentates with their oxygen atom bound to one Ru atom. Thus, the sensors based on Ru-decorated materials show the highest response to ethanol, while their sensing performance toward other VOCs is also enhanced. The statistics of the initial resistance for the sensor selectivity and repeatability tests (Fig. S4†) illustrates that the devices can almost completely recover after exposure to the tested gases, further demonstrating the outstanding repeatability of the sensors.
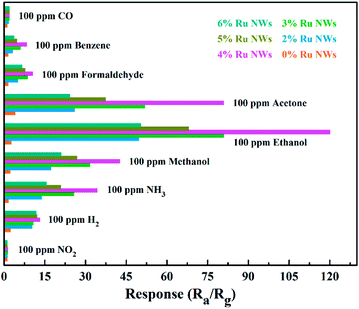 | ||
| Fig. 7 Selectivity patterns of the sensors towards various gases (100 ppm benzene, formaldehyde, acetone, methanol, NH3, CO, NO2, H2, and ethanol) at 200 °C. | ||
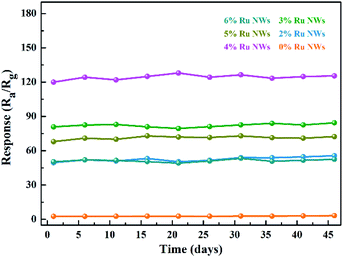
Gas sensors based on MOS are always limited in practical application by poor long-term stability performance; therefore, more stable sensor materials are required. As shown in Fig. 8 and S5,† the prepared sensors based on WO3 NWs demonstrate extremely stable performance for practical ethanol detection. The sensing performance is even slightly increased after 45 days, and the dynamic response and recovery curves have the same characteristics, as shown in Fig. 6a. In brief, these sensors have good moisture resistance, selectivity and long-term stability.
3.3 Mechanism
The resistance value of the sensors is stable in conditions where air is the background due to a dynamic equilibrium between the oxygen adsorption and desorption processes. Currently, the widely accepted sensing mechanism of typical n-type MOS (WO3) materials for the detection of reducing gases (ethanol) is attributed to the change in carrier concentration due to the capture and release of electrons during the chemical reaction between the target gas and the oxygen species adsorbed on the MOS surface.33,61 Therefore, the movement of electrons and the changes in adsorbed oxygen species on the surface of the materials when the sensors are exposed to alternating atmospheres under a certain concentration of the target gas should be investigated. The conduction band electrons can be trapped by oxygen to form chemisorbed oxygen species; this process is highly dependent on the working temperature in air (O2 (ads) + 2e− ↔ 2O−(ads) (100 °C < T < 300 °C)).22 The trapped electrons are released back to the conduction band with the introduction of reducing gas (the gas will undergo an oxidation–reduction reaction with the adsorbed oxygen, releasing electrons to participate in conduction).28 As a result, an electron depletion layer is formed on the surface of the sensing materials in air, and the width of this depletion layer is reduced in testing; this leads to the change in the resistance of the sensing materials, consistent with Fig. S1.†The improvement in the sensing performance can be explained by the electronic and chemical sensitization of Ru. The 0% Ru NW and 4% Ru NW samples were characterized using XPS (Fig. S6† and 9) to analyze the chemical states of elements (W, O, and Ru) and the sample compositions. The comparison of the full survey spectra shown in Fig. S6† clearly shows a weak peak at around 282 eV and a slight change at around 463 eV for the Ru-decorated sample, corresponding to Ru 3d and Ru 3p, respectively. The Ru 3p peak, which is only present in the 4% Ru NWs samples, illustrates the presence of Ru. The high-resolution spectra of W 4f, O 1s, Ru 3d, and Ru 3p are shown in Fig. 9a–d. Fig. 9a displays two peaks at 35.5 ± 0.1 eV (W 4f7/2) and 37.6 ± 0.1 eV (W 4f5/2), corresponding to the W6+ oxidation state. In the O 1s XPS spectrum in Fig. 9b, there are three major peaks located at 530.25 ± 0.1 eV, 531.5 ± 0.1 eV, and 532.2 ± 0.1 eV, which are respectively ascribed to lattice oxygen (OL), oxygen vacancies (OV), and chemisorbed oxygen (OC) on the WO3 surface.
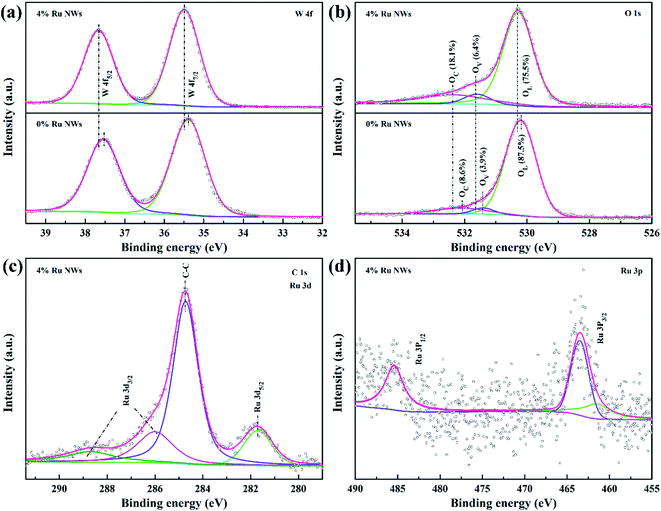 | ||
| Fig. 9 (a) W 4f, (b) O 1s XPS spectra of 0% Ru NWs, and 4% Ru NWs samples, (c) Ru 3d and (d) Ru 3p spectra of 4% Ru NWs samples. | ||
Decorating the WO3 NWs with 4% Ru increases the amount of OV from 3.9% to 6.4%, providing more reaction sites for target gases, and increases OC from 8.6% to 18.1%, indicating that more chemisorbed oxygen can participate in the chemical reaction.36 This explains the larger response of the Ru-decorated WO3. Additionally, as shown in Fig. 9c, the XPS peaks of Ru 3d overlap with the C 1s peak. The peaks located at 281.7 eV and around 286 eV correspond to Ru 3d5/2 and Ru 3d3/2. The Ru 3p XPS spectrum displayed in Fig. 9d illustrates that ruthenium is in the form of RuO2.62 Importantly, both the W 4f and O 1s peaks of the 4% Ru NWs spectrum shift to higher binding energy positions, indicating that the electron migration direction between WO3 and Ru is from the semiconductor to the noble metal. This leads to a higher resistance state of the devices based on the Ru-decorated samples, in line with Fig. S1 and S2.† This also proves the interaction between Ru and WO3. Their synergy is conducive to the improvement of the sensing performance. In addition, RuO2 is a p-type MOS; therefore, a p–n heterojunction is formed at the interface between RuO2 and WO3. Additionally, the work function of RuO2 is higher than that of WO3, so electrons will migrate from WO3 to RuO2 until their Fermi levels are balanced.63 This widens the electron depletion layer, which is beneficial for enhancing the sensitivity of WO3. Because a lower electron concentration means a higher baseline resistance of the sensors in air, this results in a higher response based on the equation S = Ra/Rg. The ethanol sensing mechanism and enhancement for pure and Ru-decorated samples are shown in Fig. 10.
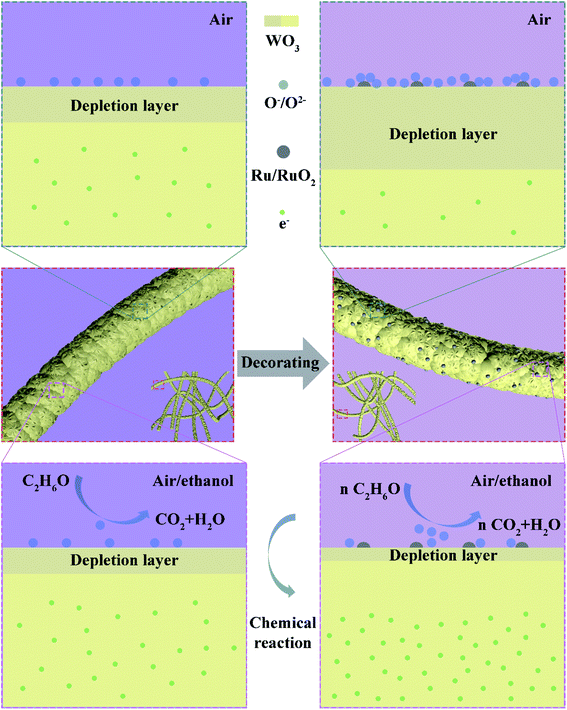 | ||
| Fig. 10 Schematic diagram of pure and Ru-decorated WO3 NWs and their ethanol sensing mechanism and its enhancement. | ||
The devices based on Ru-decorated samples have a lower optimal operating temperature and faster response and recovery. This is ascribed to the catalytic effect of RuO2, which reduces the activation energy of the gas to react with adsorbed oxygen and accelerates the dynamic equilibrium of the oxygen adsorption and desorption processes. The gas sensing property of the samples improves with increasing Ru decoration up to 4 at%. Above this, the gas sensing property deteriorates, which can be explained by the lower atom utilization efficiency under the same conditions.64 The stability of these sensors is attributed to the nature of the WO3 NWs. The materials were annealed at 500 °C during the preparation process, and the sensors underwent a high-temperature aging treatment, enhancing material stability.
4 Conclusions
In summary, various amounts of the noble metal Ru were used to functionalize the surface of WO3 NWs prepared by a traditional electrospinning method via a facile and low-cost UV irradiation process. In particular, the sensor device based on 4% Ru-decorated WO3 NWs achieves the most outstanding performance for ethanol detection at a low working temperature of 200 °C, with a response 47 times higher than that of undecorated WO3 NWs. The response of the prepared sensors to step changes in the concentration of ethanol is clearly distinguished. The lowest detection limit level is 221 ppb. Furthermore, these sensors exhibit good repeatability and stability even after 45 days or under high relative humidity conditions. This can be ascribed to the higher level of oxygen vacancies and surface chemically adsorbed oxygen species on the Ru-decorated WO3 caused by the electronic/chemical sensitization effect of Ru, the catalytic effect of RuO2, the optimized atomic utilization efficiency, and the heterojunction formed at the interface between WO3 and RuO2. Overall, this work clearly proves that using Ru to decorate the surface of a MOS is an effective and promising method for promoting ethanol sensing performance.Author contributions
Jianjun Li: conceptualization, methodology, formal analysis, validation, data curation, writing—original draft, writing—review & editing. Qiongling Ding: methodology. Xichao Mo: data collection, investigation. Zihao Zou: data collection, investigation. Pu Cheng: data collection. Yiding Li: data collection. Kai Sun: data collection. Yujun Fu: data collection, supervision. Yanrong Wang: conceptualization, methodology, funding acquisition, writing—original draft, writing—review & editing, supervision. Deyan He: conceptualization, supervision. All authors have read and agreed to the published version of the manuscript.Conflicts of interest
The authors declare no competing interest.Acknowledgements
This work was supported by the National Natural Science Foundation of China (No. 61801200), and the Fundamental Research Funds for the Central Universities (No. lzujbky-2020-60).References
- Y. Wang, P. Cheng, X. Li, C. Wang, C. Feng and G. Lu, Revealing the relationship between the Au decoration method and the enhanced acetone sensing performance of a mesoporous In2O3-based gas sensor, J. Mater. Chem. C, 2020, 8, 78–88 RSC.
- A. Staerz, S. Somacescu, M. Epifani, T. Kida, U. Weimar and N. Barsan, WO3-based gas sensors: identifying inherent qualities and understanding the sensing mechanism, ACS Sens., 2020, 5, 1624–1633 CrossRef CAS PubMed.
- K. Xu, N. Liao, B. Zheng and H. Zhou, Adsorption and diffusion behaviors of H2, H2S, NH3, CO and H2O gases molecules on MoO3 monolayer: A DFT study, Phys. Lett. A, 2020, 384, 126533 CrossRef CAS.
- H. Yu, J. Li, Z. Li, Y. Tian and Z. Yang, Enhanced formaldehyde sensing performance based on Ag@WO3 2D nanocomposite, Powder Technol., 2019, 343, 1–10 CrossRef CAS.
- Z. Zhu, C.-T. Kao and R.-J. Wu, A highly sensitive ethanol sensor based on Ag@TiO2 nanoparticles at room temperature, Appl. Surf. Sci., 2014, 320, 348–355 CrossRef CAS.
- T. Tesfamichael, Electron beam evaporation of tungsten oxide films for gas sensors, IEEE Sens. J., 2010, 10, 1796–1802 CAS.
- J. Yang and Y. S. Lin, Design of tunable terahertz metamaterial sensor with single- and dual-resonance characteristic, Nanomaterials, 2021, 11, 2221 CrossRef PubMed.
- Z. Liang, Y. Wen, Z. Zhang, Z. Liang, Z. Xu and Y.-S. Lin, Plasmonic metamaterial using metal-insulator-metal nanogratings for high-sensitive refraction index sensor, Results Phys., 2019, 15, 102602 CrossRef.
- J. Zhong, X. Xu and Y. S. Lin, Tunable terahertz metamaterial with electromagnetically induced transparency characteristic for sensing application, Nanomaterials, 2021, 11, 2175 CrossRef CAS PubMed.
- Y. Zhang, P. Lin and Y. S. Lin, Tunable split-disk metamaterial absorber for sensing application, Nanomaterials, 2021, 11, 598 CrossRef CAS PubMed.
- Z. Lin, Z. Xu, P. Liu, Z. Liang and Y.-S. Lin, Polarization-sensitive terahertz resonator using asymmetrical F-shaped metamaterial, Opt. Laser Technol., 2020, 121, 105826 CrossRef CAS.
- Y.-S. Lin, Complementary infrared metamaterials for volatile organic solutions sensing, Mater. Lett., 2017, 195, 55–57 CrossRef CAS.
- Y. Wen, Z. Liang and Y.-S. Lin, Tunable perfect meta-absorber with high-sensitive polarization characteristic, Advanced Photonics Research, 2020, 2, 2000027 CrossRef.
- H. Zhang, H. Li, L. Cai, Q. Lei, J. Wang and W. Fan, et al., Performances of In-doped CuO-based heterojunction gas sensor, J. Mater. Sci.: Mater. Electron., 2019, 31, 910–919 CrossRef.
- Y. Wang, Z. Zhao, Y. Sun, P. Li, J. Ji and Y. Chen, et al., Fabrication and gas sensing properties of Au-loaded SnO2 composite nanoparticles for highly sensitive hydrogen detection, Sens. Actuators, B, 2017, 240, 664–673 CrossRef CAS.
- D. Zhang, Y. Cao, Z. Yang and J. Wu, Nanoheterostructure construction and DFT study of Ni-Doped In2O3 nanocubes/WS2 hexagon nanosheets for formaldehyde sensing at room temperature, ACS Appl. Mater. Interfaces, 2020, 12, 11979–11989 CrossRef CAS PubMed.
- J. M. Xu and J. P. Cheng, The advances of Co3O4 as gas sensing materials: A review, J. Alloys Compd., 2016, 686, 753–768 CrossRef CAS.
- C. Zhang, S. Zhang, Y. Yang, H. Yu and X. Dong, Highly sensitive H2S sensors based on metal-organic framework driven γ-Fe2O3 on reduced graphene oxide composites at room temperature, Sens. Actuators, B, 2020, 325, 128804 CrossRef CAS.
- Z. Wang, Z. Tian, D. Han and F. Gu, Au-modified three-dimensionally ordered macroporous ZnO:In for high-performance ethanol sensors, J. Mater. Chem. C, 2020, 8, 2812–2819 RSC.
- T. P. Mokoena, Z. P. Tshabalala, K. T. Hillie, H. C. Swart and D. E. Motaung, The blue luminescence of p-type NiO nanostructured material induced by defects: H2S gas sensing characteristics at a relatively low operating temperature, Appl. Surf. Sci., 2020, 525, 146002 CrossRef CAS.
- X. Chang, S. Xu, S. Liu, N. Wang, S. Sun and X. Zhu, et al., Highly sensitive acetone sensor based on WO3 nanosheets derived from WS2 nanoparticles with inorganic fullerene-like structures, Sens. Actuators, B, 2021, 343, 130135 CrossRef CAS.
- Q. Ding, Y. Wang, P. Guo, J. Li, C. Chen and T. Wang, et al., Cr-doped urchin-like WO3 hollow spheres: the cooperative modulation of crystal growth and energy-band structure for high-sensitive acetone detection, Sensors, 2020, 20, 3473 CrossRef CAS PubMed.
- H. Gao, Y. Ma, P. Song, Z. Yang and Q. Wang, Cu-doped Fe2O3 porous spindles derived from metal-organic frameworks with enhanced sensitivity to triethylamine, Mater. Sci. Semicond. Process., 2021, 123, 105510 CrossRef CAS.
- Y.-S. Lin and W. Chen, A large-area, wide-incident-angle, and polarization-independent plasmonic color filter for glucose sensing, Opt. Mater., 2018, 75, 739–743 CrossRef CAS.
- S. Liu, W. Zeng and Y. Li, Synthesis of spherical WO3·H2O network for ethanol sensing application, Mater. Lett., 2019, 253, 42–45 CrossRef CAS.
- D. Zhang, Y. Cao, J. Wu and X. Zhang, Tungsten trioxide nanoparticles decorated tungsten disulfide nanoheterojunction for highly sensitive ethanol gas sensing application, Appl. Surf. Sci., 2020, 503, 144063 CrossRef CAS.
- Q. Li, D. Chen, J. Miao, S. Lin, Z. Yu and D. Cui, et al., Highly sensitive sensor based on ordered porous ZnO nanosheets for ethanol detecting application, Sens. Actuators, B, 2021, 326, 128952 CrossRef CAS.
- C. Dong, R. Zhao, L. Yao, Y. Ran, X. Zhang and Y. Wang, A review on WO3 based gas sensors: morphology control and enhanced sensing properties, J. Alloys Compd., 2020, 820, 153194 CrossRef CAS.
- J. Qi, K. Chen, Y. Xing, H. Fan, H. Zhao and J. Yang, et al., Application of 3D hierarchical monoclinic-type structural Sb-doped WO3 towards NO2 gas detection at low temperature, Nanoscale, 2018, 10, 7440–7450 RSC.
- L. Deng, X. Ding, D. Zeng, S. Zhang and C. Xie, High sensitivity and selectivity of C-doped WO3 gas sensors toward toluene and xylene, IEEE Sens. J., 2012, 12, 2209–2214 CAS.
- Y. Zeng, Z. Hua, X. Tian, X. Li, Z. Qiu and C. Zhang, et al., Selective detection of methanol by zeolite/Pd-WO3 gas sensors, Sens. Actuators, B, 2018, 273, 1291–1299 CrossRef CAS.
- Z. Qiu, Z. Hua, Y. Li, M. Wang, D. Huang and C. Tian, et al., Acetone sensing properties and mechanism of Rh-loaded WO3 Nanosheets, Front. Chem., 2018, 6, 385 CrossRef PubMed.
- J. Dai, O. Ogbeide, N. Macadam, Q. Sun, W. Yu and Y. Li, et al., Printed gas sensors, Chem. Soc. Rev., 2020, 49, 1756–1789 RSC.
- K. T. Alali, J. Liu, K. Aljebawi, P. Liu, R. Chen and R. Li, et al., Electrospun n-p WO3/CuO heterostructure nanofibers as an efficient sarin nerve agent sensing material at room temperature, J. Alloys Compd., 2019, 793, 31–41 CrossRef CAS.
- H. Shao, M. Huang, H. Fu, S. Wang, L. Wang and J. Lu, et al., Hollow WO3/SnO2 hetero-nanofibers: controlled synthesis and high efficiency of acetone vapor detection, Front. Chem., 2019, 7, 785 CrossRef CAS PubMed.
- J. Lu, C. Xu, L. Cheng, N. Jia, J. Huang and C. Li, Acetone sensor based on WO3 nanocrystallines with oxygen defects for low concentration detection, Mater. Sci. Semicond. Process., 2019, 101, 214–222 CrossRef CAS.
- S. Kabcum, N. Kotchasak, D. Channei, A. Tuantranont, A. Wisitsoraat and S. Phanichphant, et al., Highly sensitive and selective NO2 sensor based on Au-impregnated WO3 nanorods, Sens. Actuators, B, 2017, 252, 523–536 CrossRef CAS.
- A. Nikfarjam, S. Fardindoost and A. Iraji zad, Fabrication of Pd doped WO3 nanofiber as hydrogen sensor, Polymers, 2013, 5, 45–55 CrossRef.
- C.-H. Chang, T.-C. Chou, W.-C. Chen, J.-S. Niu, K.-W. Lin and S.-Y. Cheng, et al., Study of a WO3 thin film based hydrogen gas sensor decorated with platinum nanoparticles, Sens. Actuators, B, 2020, 317, 128145 CrossRef CAS.
- P. V. Morais, P. H. Suman, R. A. Silva and M. O. Orlandi, High gas sensor performance of WO3 nanofibers prepared by electrospinning, J. Alloys Compd., 2021, 864, 158745 CrossRef CAS.
- S. J. Choi, S. Chattopadhyay, J. J. Kim, S. J. Kim, H. L. Tuller and G. C. Rutledge, et al., Coaxial electrospinning of WO3 nanotubes functionalized with bio-inspired Pd catalysts and their superior hydrogen sensing performance, Nanoscale, 2016, 8, 9159–9166 RSC.
- P. P. Mane, R. S. Ambekar and B. Kandasubramanian, Electrospun nanofiber-based cancer sensors: A review, Int. J. Pharm., 2020, 583, 119364 CrossRef CAS PubMed.
- G. Korotcenkov, Electrospun metal oxide nanofibers and their conductometric gas sensor application. Part 2: gas sensors and their advantages and limitations, Nanomaterials, 2021, 11, 1555 CrossRef CAS PubMed.
- P. Su, W. Pei, X. Wang, Y. Ma, Q. Jiang and J. Liang, et al., Exceptional electrochemical HER performance with enhanced electron transfer between Ru nanoparticles and single atoms dispersed on a carbon substrate, Angew. Chem., Int. Ed. Engl., 2021, 60, 16044–16050 CrossRef CAS PubMed.
- M. Gao, H. Tan, P. Zhu, J. Zhang, H. Wang and X. Liu, et al., Why phenol is selectively hydrogenated to cyclohexanol on Ru (0001): an experimental and theoretical study, Appl. Surf. Sci., 2021, 558, 149880 CrossRef CAS.
- H. P. Pacheco, E. F. de Souza, S. M. Landi, M. V. David, J. Tyler Prillaman and R. J. Davis, et al., Ru Promoted MgO and Al-Modified MgO for Ethanol Upgrading, Top. Catal., 2019, 62, 894–907 CrossRef CAS.
- A. Rodríguez-Gómez, E. Lepre, L. Sánchez-Silva, N. López-Salas and A. R. de la Osa, PtRu nanoparticles supported on noble carbons for ethanol electrooxidation, J. Energy Chem., 2022, 66, 168–180 CrossRef.
- L. Wei, F. Liu, X. Jiang, Y.-H. Yang, T. Sheng and Q.-Q. Xu, et al., High-index faceted Pt-Ru alloy concave nanocubes with enhancing ethanol and CO electro-oxidation, Electrochim. Acta, 2021, 396, 139266 CrossRef CAS.
- A. Waheed, X. Wang, N. Maeda, S. Naito and A. Baiker, Surface processes occurring during aqueous phase ethanol reforming on Ru/TiO2 tracked by ATR-IR spectroscopy, Appl. Catal., A, 2019, 581, 111–115 CrossRef CAS.
- D. Huang, W. Yuan, S. Fan, C. Tian, Z. Hua and X. Tian, et al., Hydrogen sensing mechanism of Ru-loaded WO3 nanosheets, Sens. Actuators, B, 2020, 304, 127339 CrossRef CAS.
- Y. Li, Z. Hua, Y. Wu, Y. Zeng, Z. Qiu and X. Tian, et al., Modified impregnation synthesis of Ru-loaded WO3 nanoparticles for acetone sensing, Sens. Actuators, B, 2018, 265, 249–256 CrossRef CAS.
- H. Li, S. Chu, Q. Ma, J. Wang, Q. Che and G. Wang, et al., Hierarchical WO3/ZnWO4 1D fibrous heterostructures with tunable in situ growth of WO3 nanoparticles on surface for efficient low concentration HCHO detection, Sens. Actuators, B, 2019, 286, 564–574 CrossRef CAS.
- X. Kou, F. Meng, K. Chen, T. Wang, P. Sun and F. Liu, et al., High-performance acetone gas sensor based on Ru-doped SnO2 nanofibers, Sens. Actuators, B, 2020, 320, 128292 CrossRef CAS.
- S. S. Mehta, D. Y. Nadargi, M. S. Tamboli, L. S. Chaudhary, P. S. Patil and I. S. Mulla, et al., Ru-loaded mesoporous WO3 microflowers for dual applications: enhanced H2S sensing and sunlight-driven photocatalysis, Dalton Trans., 2018, 47, 16840–16845 RSC.
- F. Li, X. Gao, R. Wang and T. Zhang, Design of WO3-SnO2 core-shell nanofibers and their enhanced gas sensing performance based on different work function, Appl. Surf. Sci., 2018, 442, 30–37 CrossRef CAS.
- V. Ambardekar, P. P. Bandyopadhyay and S. B. Majumder, Understanding on the ethanol sensing mechanism of atmospheric plasma sprayed 25 wt. % WO3-75 wt. % SnO2 coating, Sens. Actuators, B, 2019, 290, 414–425 CrossRef CAS.
- Q. Diao, Y. Yin, W. Jia, X. Xu, Y. Ding and X. Zhang, et al., Highly sensitive ethanol sensor based on Ce-doped WO3 with raspberry-like architecture, Mater. Res. Express, 2020, 7, 115012 CrossRef CAS.
- Z. Wei, M. K. Akbari, Z. Hai, R. K. Ramachandran, C. Detavernier and F. Verpoort, et al., Ultra-thin sub-10nm Ga2O3-WO3 heterostructures developed by atomic layer deposition for sensitive and selective C2H5OH detection on ppm level, Sens. Actuators, B, 2019, 287, 147–156 CrossRef CAS.
- J. Ma, X. Xiao, Y. Zou, Y. Ren, X. Zhou and X. Yang, et al., A general and straightforward route to noble metal-decorated mesoporous transition-metal oxides with enhanced gas sensing performance, Small, 2019, 15, 1904240 CrossRef CAS PubMed.
- Y. C. Liang and C. W. Chang, Improvement of ethanol gas-sensing responses of ZnO-WO3 composite nanorods through annealing induced local phase transformation, Nanomaterials, 2019, 9, 669 CrossRef CAS PubMed.
- B. Yang, N. V. Myung and T. T. Tran, 1D metal oxide semiconductor materials for chemiresistive gas sensors: A Review, Adv. Electron. Mater., 2021, 202100271 Search PubMed.
- P. Hao, P. Song, Z. Yang and Q. Wang, Synthesis of novel RuO2/LaFeO3 porous microspheres its gas sensing performances towards triethylamine, J. Alloys Compd., 2019, 806, 960–967 CrossRef CAS.
- C. Wang, S. Zhang, L. Qiu, S. A. Rasaki, F. Qu and T. Thomas, et al., Ru-decorated WO3 nanosheets for efficient xylene gas sensing application, J. Alloys Compd., 2020, 826, 154196 CrossRef CAS.
- L. Zhang, K. Doyle-Davis and X. Sun, Pt-based electrocatalysts with high atom utilization efficiency: from nanostructures to single atoms, Energy Environ. Sci., 2019, 12, 492–517 RSC.
Footnote |
| † Electronic supplementary information (ESI) available. See DOI: 10.1039/d1ra06623d |
| This journal is © The Royal Society of Chemistry 2021 |

