 Open Access Article
BSA–MnO2–SAL multifunctional nanoparticle-mediated M1 macrophages polarization for glioblastoma therapy
Fuming Liangab,
Ling Zhu b,
Chen Wang
 b,
Yanlian Yang*b and
Zhaohui He
 *a
*a
aDepartment of Neurosurgery, The First Affiliated Hospital of Chongqing Medical University, 1 Friendship Road, 400016, Chongqing, China. E-mail: geno_he@163.com
bCAS Key Laborytory of Standardization and Measurement for Nanotechnology, National Center for Nanoscience and Technology, 100190, Beijing, China. E-mail: yangyl@nanoctr.cn
First published on 2nd November 2021
Abstract
Glioblastoma (GBM) is a type of brain tumour with a very high fatality rate. Owing to the presence of the blood–brain barrier (BBB), it is difficult for drugs to reach the tumour site; thus, there has been little progress in GBM chemotherapeutics. Furthermore, the malignant growth of tumours largely depends on the tumour microenvironment. GBM is especially prevalent in slightly acidic, hydrogen peroxide (H2O2)-rich, hypoxic, and immunosuppressive microenvironments. Tumour-supporting macrophages (M2 macrophages) are a type of immune cell that promote tumour growth. Therefore, targeting M2 macrophages and repolarizing them into tumour-suppressor macrophages (M1 macrophages) are important strategies for GBM treatment. Salinomycin (SAL) is an anti-tumour drug that can improve the tumour immune microenvironment. Interestingly, we found that SAL promoted the expression of M1 macrophages in vitro, but its ability was limited in vivo because of the presence of the BBB. In this study, we combined SAL and MnO2 to design bovine serum albumin–MnO2–SAL (BMS), a nanoparticle that responds to acidic and H2O2-rich microenvironments. Our experimental results showed that BMS reduced GBM growth efficiency and had the ability to penetrate the BBB. It also enhanced the repolarization ability of SAL owing to the production of Mn2+ after decomposition, which could be applied in Magnetic Resonance Imaging (MRI). This study demonstrated that the multifunctional nanoparticle BMS is of great significance in inhibiting orthotopic GBM growth and improving immunosuppressive microenvironments.
1. Introduction
Glioblastoma (GBM) is one of the most aggressive brain tumours; it has a poor prognosis and a population incidence rate of ∼5.26/100![[thin space (1/6-em)]](https://www.rsc.org/images/entities/char_2009.gif) 000.1 Traditional treatment methods for GBM, such as radiotherapy, chemotherapy, phototherapy, and surgical treatment, currently face severe challenges.2 The brain, similar to peripheral tissues, has a large number of immune cells, including T cells, B cells, and macrophages, and these immune cells play important roles in the occurrence and development of GBM.3 Following recent progress in brain immune function research, an increasing number of researchers are paying attention to the immunotherapy of GBM. GBM is an immunosuppressive tumour, and some proteins expressed in GBM cells, such as PD-L1 and CTLA4, are involved in its progress.4,5 Therefore, improving the immune microenvironment and promoting tumour cytotoxicity in immune cells are of great significance in the treatment of GBM.
000.1 Traditional treatment methods for GBM, such as radiotherapy, chemotherapy, phototherapy, and surgical treatment, currently face severe challenges.2 The brain, similar to peripheral tissues, has a large number of immune cells, including T cells, B cells, and macrophages, and these immune cells play important roles in the occurrence and development of GBM.3 Following recent progress in brain immune function research, an increasing number of researchers are paying attention to the immunotherapy of GBM. GBM is an immunosuppressive tumour, and some proteins expressed in GBM cells, such as PD-L1 and CTLA4, are involved in its progress.4,5 Therefore, improving the immune microenvironment and promoting tumour cytotoxicity in immune cells are of great significance in the treatment of GBM.
The tumour microenvironment (TME) plays an important role in tumour malignant growth. TMEs are slightly acidic and hypoxic and include surrounding blood vessels, immune cells, fibroblasts, bone marrow-derived inflammatory cells, various signal molecules, and the extracellular matrix.6 Researchers have made important progress in the treatment of tumours by synthesising acids, hydrogen peroxide (H2O2), or reactive oxygen species, along with other tumour immune microenvironment-responsive nanoparticles.7–9 However, owing to the ‘immune privilege’ environment of the brain and the immunosuppressive microenvironment of the GBM itself, the use of immunotherapy for GBM is particularly difficult.10 However, the traditional ‘immune privilege’ perception of the brain has recently been challenged. For instance, researchers have used a dual-targeting biomimetic delivery system to remodel the tumour immune microenvironment and inhibit the malignant growth of GBM.11
Tumour-associated macrophages (TAMs) are a type of immune cell that exist in the GBM immune microenvironment. TAMs can be divided into tumour-supporting macrophages (M2 type) and tumour-suppressor macrophages (M1 type), the latter of which is mainly found in GBM immune microenvironments.12 At present, researchers have used the properties of M1 macrophages to inhibit tumor growth and created many nanoparticles that have achieved good curative effects, such as lipid-based nanoparticles, polymer-based nanoparticles and carbon-based nanomaterials.13 These nanoparticles have made important progress in tumor immunotherapy. Moreover, researchers found that calcium, magnesium, Fe3O4, ZnO, copper, silicon, Au or graphene based inorganic nanomaterials for macrophages regulation were also promising and had a high efficiency in M1 macrophages polarization.14 However, these treatment method was rarely reported in GBM. Therefore, targeting M2 macrophages and repolarizing them into M1 macrophages is an important method for GBM treatment (Scheme 1).
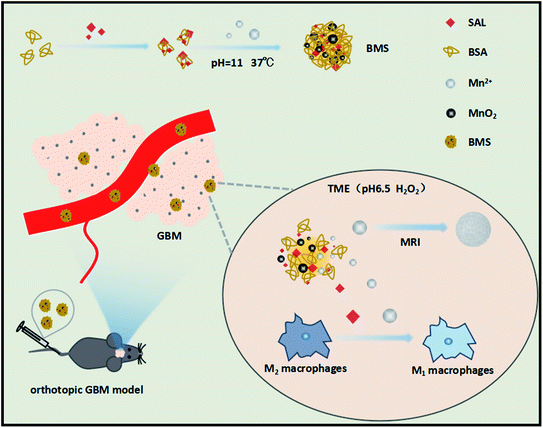 | ||
| Scheme 1 Schematic illustration of Mn2+ and SAL induced M1 macrophages polarization and the antitumor effect of BMS nanoparticle. | ||
Salinomycin (SAL) is an anti-tumour drug with tumour stem cell cytotoxicity; however, few studies have reported the tumour immune microenvironment-remodelling ability of SAL. Studies have shown that SAL has the ability to repolarize M2 macrophages in breast cancer, but its efficiency in GBM is unknown.15 Furthermore, because of the presence of the blood–brain barrier (BBB), traditional chemotherapy has a limited effect and has incurred high recurrence rates in patients with GBM; therefore, improving the BBB penetration ability of drugs is important for the treatment of GBM. In addition, SAL exhibits similar limitations in chemotherapy. Owing to its poor water solubility and low BBB penetration efficiency, the therapeutic effect of SAL on glioma is relatively limited.15,16
Bovine serum albumin (BSA) is a natural carrier of hydrophobic drugs and can penetrate the BBB.17 Recently, researchers have used the synthetic BSA@MnO2 nanoplatform to deliver chemotherapeutic drugs to the tumour site, resulting in effective progress.18 However, few studies have shown the immune remodelling ability of BSA@MnO2 nanoplatforms, especially in GBM. Furthermore, in a recent study, researchers have found that Mn2+ can induce macrophages to differentiate into M1 through the nuclear factor kappa B pathway.19 In this study, we synthesised BSA–MnO2–SAL (BMS), a multifunctional nanoparticle that can efficiently penetrate the BBB and respond to the TME. At the tumour site, BMS decomposes into SAL and Mn2+, which synergistically promote the repolarization of M2 macrophages. Moreover, BMS can be used for Magnetic Resonance Imaging (MRI) in acidic and hydrogen peroxide-rich environments.
2. Materials and methods
2.1 Materials
Bovine serum albumin, MnCl2, NaOH, Nile red (HY-D0718), D-luciferin sodium (ANDY, 103404-75-7), 1,1′-dioctadecyl-3,3,3′,3′-tetramethyl indotricarbocyanine iodide (DiR) (Sigma-Aldrich), salinomycin (MCE, HY-15597), DMEM (Gibco), fetal bovine serum (Gibco), penicillin–streptomycin (Gibco), IL-4 (Peprotech, 214-14-20), anti-CD80 (Biolegend, 104706), anti-CD86 (Biolegend, 105008), anti-CD163 (Biolegend, 155307), anti-CD206 (Biolegend, 141703), GL261, Luc-GL261, bEnd.3 and Raw264.7 cells were supplied by The National Center for Nanoscience and Technology.2.2 Nanoparticle synthesis
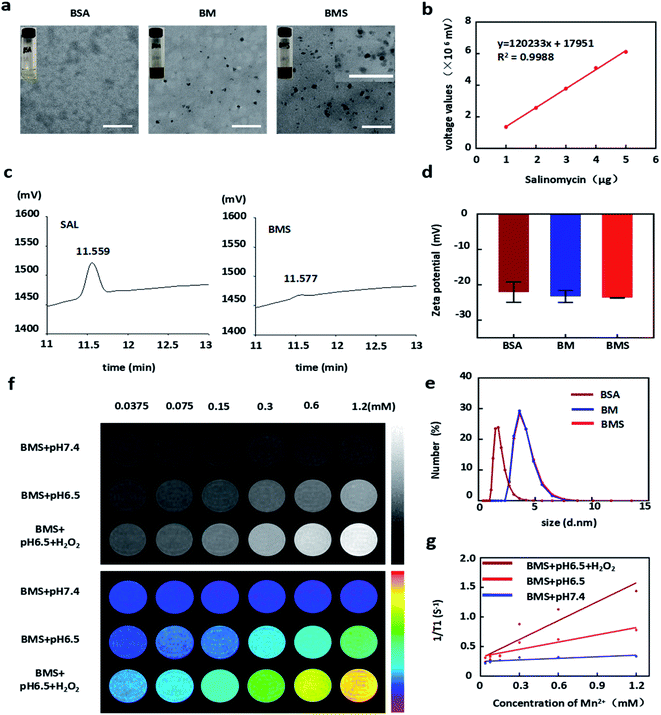
BSA–MnO2–salinomycin (BMS) nanoparticles were synthesised by one-step method. Briefly, 1.82 mL BSA (20 mg mL−1 in ultrapure water) mixed with 40 μL SAL (5 μg μL−1) and 100 μL MnCl2·4H2O (200 mg mL−1) and then 40 μL NaOH (40 mg mL−1) was added to adjust pH to 11. The mixture was reacted for 2 h in Thermostatic oscillator (37 °C, 200 r) and then the nanoparticles were washed by PBS 2 times by ultrafiltration. The Nile red–BMS or DiR–BMS were synthesised by added other 40 μL Nile red (5 μg μL−1) or DiR (5 μg μL−1) and synthesised as the same way before.2.3 MRI imaging
BMS was adjust to pH 7.4 or 6.5 and/or 10−4 M of H2O2. After 3 h reaction, 500 μL mixture was added into PE pipes and scanned by 3.0T MRI scanner. Afterwards, T1WI and T1 map sequences were obtained. The r1 relaxivities of BMS were calculated from the slope of the linear plots of r1 relaxation rates (s−1) versus Mn2+ concentration (mM) by using linear least-squares regression analysis.2.4 M2 macrophages repolarization
Briefly, Raw264.7 cells were cultured in DMEM media containing 10% FBS and 1% penicillin–streptomycin at 37 °C with 5% CO2. Then, Raw264.7 were seeded in 24-well microplates at a dencity of 1 × 10⁵ cells per well and incubated overnight at 37 °C. Afterwards, 20 ng mL−1 IL-4 was added to polarise Raw264.7 to M2 macrophages. To determine the efficiency of repolarization ability of SAL, different concentrations of SAL were added into obtained M2 macrophages. After 48 h incubation, the marker (CD80/86) of M1 macrophages were tested by flow cytometry. To determine the efficiency of repolarization ability of the nanoparticles, M2 macrophages were coincubated with different formulations (PBS, SAL, Mn2+, SAL + Mn2+, BMS, BMS + pH 6.5 + H2O2). The concentrations of SAL and Mn2+ were 1 μM and 0.05 mM respectively. After 48 h incubation, the marker (CD80/86) of M1 macrophages were tested by the same way.2.5 Cell viability evaluation
Cytotoxicity of nanoparticles was determined by standard Cell Counting Kit-8 (CCK-8) assays. Briefly, Luc-GL261 cells were seeded in 96-well plate at a density of 1 × 10⁴ cells per well. After treatment with different formulations (PBS, SAL, BM, BMS, BMS + pH 6.5 + H2O2) for 48 h. Cells were incubated with CCK-8 (10%) solution for another 2 h. Finally, the absorbance at 450 nm for each well was measured by Microplate reader (Molecular Devices, spectraMax i3).To determine cytotoxicity of SAL, Raw264.7 cells were seeded in 96-well plate at a density of 1 × 10⁴ cells per well. Then, SAL was added into the wells at different concentrations. After 48 h incubation, the absorbance at 450 nm was measured by the same way before.
2.6 Cell migration assay
The inhibition effect of tumour metastasis was tested by cell migration assay according to a transwell model. Briefly, GL261 cells (1 × 10⁵ cells) were seeded in upper chambers with FBS-free medium (300 μL), then the culture medium with FBS (1 mL) was added into the lower chambers. Afterwards, PBS, SAL, BM, BMS, BMS (pH 6.5 + H2O2) were added into upper and lower chambers respectively (5 μM SAL as the final concentration). After 24 h incubation in 37 °C, the membrane was stained with 0.1% crystal violet (Sigma-Aldrich, USAL) and observed by a microscope for migrated cells. Moreover, for quantitative analysis, the stained cells were dissolved by 200 μL glacial acetic acid and the absorbance at 530 nm for each sample was measured by Microplate reader (Molecular Devices, spectraMax i3).2.7 Cell colony formation assay
For cell colony formation assay, 1 × 10³ GL261 cells were maintained in six-well plates and fed with PBS, SAL, BM, BMS, BMS (pH 6.5, H2O2) respectively. The SAL concentration was 5 μM in each groups and the volume of BM was the same as BMS. The medium was refreshed every 3 days. Colonies were fixed with methanol after 10 days incubation, and then stained with 0.1% crystal violet for 10 min and washed with PBS 3 times. The numbers of colonies containing more than 50 cells were counted.2.8 In vitro apoptosis assay
GL261 apoptosis rate was tested by Dead Cell Apoptosis Kit (Solarbio, CA1630). Briefly, GL261 cells were seeded in cofocal dishes at a density of 1 × 10⁵ per well. Then, cells were fed with different formulations (SAL, BM, BMS, BMS + pH 6.5 + H2O2). The concentration of SAL was 5 μM in each groups and the volume of BM was the same as BMS. After 48 h incubation, cells were digested and stained according to the protocol of Dead Cell Apoptosis Kit. After washed with PBS 3 times, GL261 apoptosis rate was detected by confocal microscope.The quantitative apoptosis rate was tested by annexin-FITC/PI kit (Solarbio, CA1020). Briefly, GL261 cells were seeded in six-well plates at a density of 2 × 10⁵ per well. Afterwards, cells were fed with different formulations (PBS, SAL, BM, BMS, BMS + pH 6.5 + H2O2). The concentrations were the same as before. After 48 h incubation, cells were digested and stained according to the protocol of annexin-FITC/PI kit. Then, the apoptosis rate was detected by flow cytometry.
2.9 In vitro BBB model
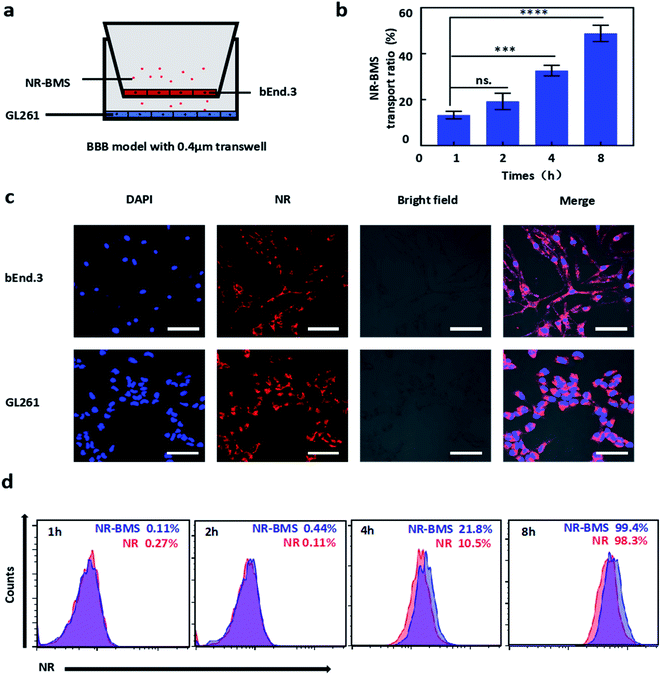
The BBB penetration ability of BMS was tested by in vitro BBB model with 0.4 μm transwell chambers. Briefly, bEnd.3 cells were cultured in DMEM with 10% FBS (37 °C, 5% CO2). Then cells were digested and seeded in upper chambers at a density of 2.5 × 10⁴/300 μL, and then 1 mL culture medium was added into the lower chambers. Transendothelial electric resistance (TEER) values of bEnd.3 monolayers were consistently measured by Millicell ERS-2 (Millipore, USAL). When TEER values were over 150 Ω cm−2 and the liquid difference unchanged for 4 hours after 4–5 days of culture means that the BBB model has been successfully constructed.In order to test the transport ratio of BMS, we synthesized Nile red–BMS (NR–BMS) as the way before. Afterwards, we added culture medium in upper chambers (300 μL with 10 μM NR–BMS) and lower chambers (1 mL). Then 100 μL medium was taken from the lower chambers after 1 h, 2 h, 4 h, 8 h respectively, and the absorbance at 488/570 nm was measured by Microplate reader.
To demonstrate NR–BMS has better ability to be taken by GL261 cells when BBB existed. We constructed a coincubation BBB model. Briefly, after BBB model successfully constructed, we seeded GL261 cells at a density of 1 × 10⁵ cells per well in the lower chambers for 24 h coincubation. Afterwards, NR (10 μM) or NR–BMS (NR: 10 μM) was added into the upper chambers, and then the cells in the lower chambers were digested after 1 h, 2 h, 4 h, 8 h respectively. After fixed with paraformaldehyde and washed with PBS 3 times, the cells uptake ability was measured by flow cytometry.
We also tested cellular uptake ability of NR–BMS by confocal microscope. Briefly, bEnd.3 cells were digested and seeded in cofocal dishes at the density of 1 × 10⁵ cells. Then, NR–BMS (NR: 10 μM) was added, after 4 h incubation, cells were fixed with paraformaldehyde and washed by PBS 3 times. The cells were finally stained with DAPI for 12 min. After washed with PBS 3 times, the images were captured using a confocal microscope. For GL261 images, NR–BMS (NR: 10 μM) added into the upper chambers, after 4 h incubation, the GL261 in the lower chambers were fixed and stained with DAPI as the same way. Afterwards, images of GL261 cells were captured by confocal microscope.
2.10 Animals and tumour models
C57BL/6 male mice aged 6–8 weeks (15–20 g) were purchased from Charles River (Beijing, China). All animal procedures were performed in accordance with the Guidelines for Care and Use of Laboratory Animals of Chongqing Medical University and National Center for Nanoscience and Technology, and approved by the Animal Ethics Committee of Chongqing Medical University and National Center for Nanoscience and Technology. In vivo tumour animal models was obtained by intracranial injection of 2 × 10⁶ Luc-GL261 cells suspended in 15 μL PBS into the striatum (2 mm right lateral and 1 mm posterior to the bregma, and 4 mm of depth). After 7 days of injection, D-luciferin sodium (160 mg kg−1) was intraperitoneal injection to test the tumour models by IVIS.2.11 Distribution of BMS in vivo
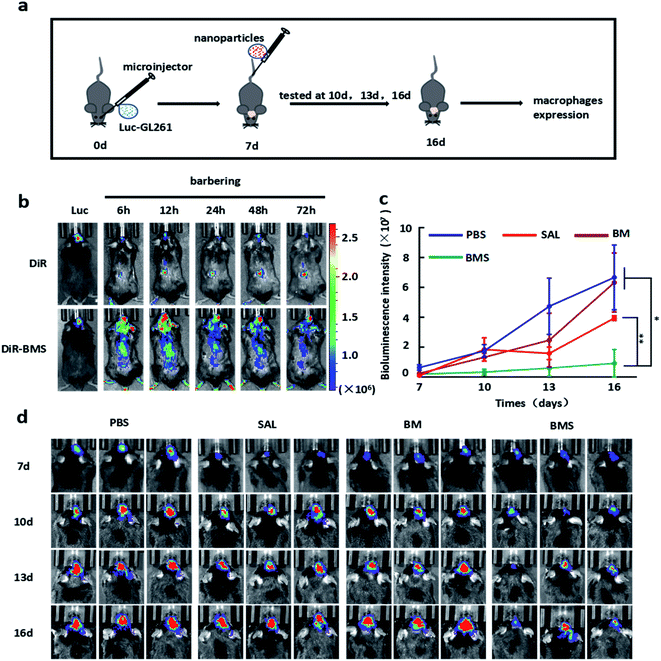
DiR–BMS was synthesised by the same way before. Afterwards, DiR or DiR–BMS (DiR: 1 mg kg−1) was intravenous injected. After 6 h, 12 h, 24 h, 48 h, 72 h of injection, the biodistribution of DiR was tested by IVIS.2.12 In vivo antitumour experiments
After 7 days of Luc-GL261 intracranial injection, the GBM bearing C57BL/6 mice were tested by IVIS to record the tumour size. Afterwards, the mice were randomly divided into 4 groups (n = 3), and then PBS, SAL, BM, BMS (SAL: 40 μg per mouse) were intravenous injected every day respectively. After 3, 6, 9 days treatment, the tumour size were detected by IVIS.2.13 Tumour-associated macrophages analysis in vivo
After 10 days treatment, GBM bearing C57BL/6 mice were sacrificed and tumour tissues were dissected from brain and cut into pieces. After 30 min digested by papain (2 mg mL−1), the homogenates were forced to pass through a 40 μm nylon mesh to obtain the single tumour cells. Afterwards, tumour cells were washed with PBS 2 times and fixed with 4% paraformaldehyde. After Blocked with 5% BSA, tumour cells were stained with related antibodies for 1 h. Then cells were tested by flow cytometry after washed with PBS 3 times.2.14 Statistical analysis
All quantitative data are presented as the mean ± standard deviation (SD). The significance was calculated using Student's t-test with GraphPad Prism 8 software.*P < 0.05; **P < 0.01; ***P < 0.001, ****P < 0.0001. The P-value < 0.05 was considered statistically significant.3. Results and discussion
3.1 Preparation and characterization of BMS
BMS, the MnO2 containing nanoparticles, were prepared by one-step synthesis method, and the SAL encapsulation efficiency was about 91.6% according to the HPLC (Fig. 1c). BMS showed similar size in both TEM and dynamic light scattering (DLS). The diameter and zeta potential of BMS were detected about 5 nm and −22 mV in DLS respectively (Fig. 1d and e). Under TEM, no matter whether SAL was loaded or not, BM and BMS both exhibited regular granular shape and good dispersibility (Fig. 1a).Mn2+ transformed into MnO2 under the conditions of BMS synthesis (pH = 11) and then participated in the formation of BMS. Recently, researchers reported that MnO2 decomposed in the tumour microenvironment to produce oxygen and Mn2+, which play an important role in hypoxia alleviation and MRI imaging.8 In our study, there was almost no MRI imaging effect at pH 7.4, but was significantly enhanced under the conditions of pH 6.5 and H2O2. In addition, as the concentration of Mn2+ increased, the ability of MRI imaging was also enhanced (Fig. 1f and g).
3.2 Anti-proliferation and apoptosis induction of BMS on GL261 cells
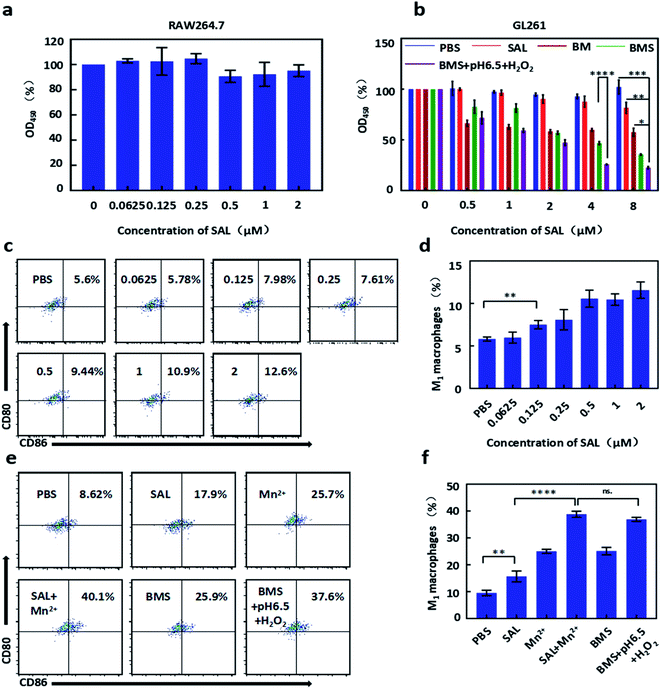
GL261 cells were treated with PBS, SAL, BM, BMS, BMS (pH 6.5, H2O2) with different concentrations for 48 h in CCK8 assay. We found that free SAL has a weaker inhibition effect on GL261 in the low dose range, while BMS has a stronger effect on inhibiting growth with the IC50 was about 4 μM. Moreover, due to the rapid decomposition, BMS was more cytotoxic under acidic and H2O2 conditions with the IC50 was about 2 μM (Fig. 2b). In conclusion, the sequential order of toxicity to GL261 was as follows: BMS (pH 6.5, H2O2) > BMS > BM > SAL.Calcein-AM/PI double staining was used to test the apoptosis of GL261. Cells were incubation with PBS, SAL, BM, BMS, BMS (pH 6.5 + H2O2) for 48 h. As shown in our results (Fig. 3e), the apoptosis rate of GL261 in the BMS and BMS (pH 6.5 + H2O2) groups was more obvious than SAL group. For quantitative analysis, GL261 apoptosis rate was tested by flow cytometry. Cells were incubation with PBS, SAL, BM, BMS, BMS (pH 6.5, H2O2) for 48 h. As shown in Fig. 3f, the sequential order of toxicity to GL261 was as follows: BMS (pH 6.5, H2O2) (61.1%) > BMS (48.2%) > SAL (16.4%) > BM (3.61%).
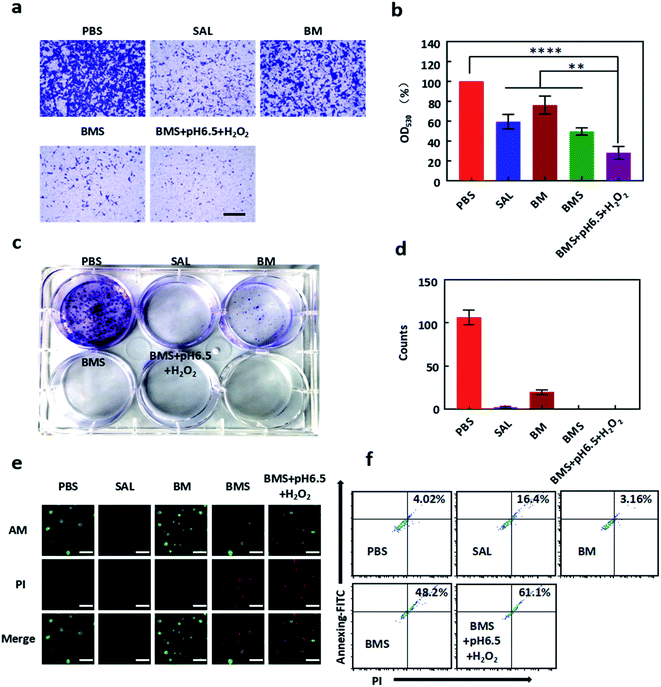 | ||
| Fig. 3 Antitumor effect of BMS in vitro. (a) Representative micrographs of GL261 cells migrating from upper chambers after different groups (PBS, SAL, BM, BMS, BMS + pH 6.5 + H2O2) treatment for 24 h. (b) The calculated OD values (530 nm) of crystal violet stained GL261 cells after dissolved by acetic acid according to (a). (c) Representative images of clone formation of GL261 cells after incubated with PBS, SAL, BM, BMS, BMS + pH 6.5 + H2O2 (SAL: 5 μM as the final concentration) for 10 days. (d) Number of clones of GL261 cells calculated from Fig. 3c. (e) AM/PI double stained assay for GL261 cells treated with different formulations (PBS, SAL, BM, BMS, BMS + pH 6.5 + H2O2) a t 5 μM SAL as the final concentration for 48 h. Scale bar = 100 μm. (f) Apoptosis rate images in GL261 cells with annexin-FITC/PI staining by flow cytometry.*P < 0.05; **P < 0.01; ***P < 0.001, ****P < 0.0001. | ||
3.3 Cell migrate suppression and colony format inhibition of BMS
The migration efficiency of tumour cells is always related to the malignancy of the tumour. Different from the proliferation inhibition test, SAL significantly inhibited the migration ability of GL261 cells in a low dose (5 μM). As shown in Fig. 3a and b, BMS and BMS (pH 6.5, H2O2) significantly inhibits the migration of GL261 cells, and had a better inhibitory effect than free SAL.As shown in Fig. 3c and d, BMS can significantly inhibit the formation of cell monoclonals and there was no obvious cell monoclonal formation in the three groups of free SAL, BMS, BMS (pH 6.5, H2O2). In CCK8 assay of GL261, our results exhibited that SAL had no obvious effect on the proliferation of GL261 within 48 hours, which is contrary to the results obtained in the monoclonal experiment. The reason for this phenomenon may be related to the drug treatment time. In the monoclonal experiment, drug treatment time was 10 days, while in the CCK8 experiment was only 48 hours.
3.4 Repolarization ability of SAL and BMS
As shown in Fig. 2a, SAL showed almost no changes in viabilities of Raw264.7 in a low dose. After incubated with IL-4 for 24 h, the obtained M2 macrophages were treated with different concentrations of SAL. The repolarization ability of SAL is positively correlated with concentrations (Fig. 2c and d).To explore the repolarization effect of BMS on macrophages, M2 macrophages were treated with PBS, SAL, Mn2+, SAL + Mn2+, BMS, BMS (pH 6.5, H2O2). As shown in Fig. 2e and f, both SAL and Mn2+ have the ability to repolarize M2 macrophages. Compared with 8.62% in the PBS group, the repolarization rate of free SAL and free Mn2+ increased to 17.9% and 25.7% respectively. The repolarization rate has been improved to 40.1% when SAL combination with Mn2+. However, there was a slight decrease in BMS, which may be related to the incomplete decomposition of BMS, because the repolarization rate of the BMS (pH 6.5, H2O2) is the same as the combination of Mn2+ and SAL.
3.5 BBB penetration ability of BMS
In order to facilitate the detection, we connected the NR lipophilic dye to the BMS as the same way before. As shown in Fig. 4a, we built an in vitro BBB model with 0.4 μm transwell chambers. In the BBB model, NR-BMS was taken up by both bEnd.3 cells in upper chambers and GL261 cells in lower chambers in confocal microscope images (Fig. 4c). The BMS in the upper chambers can penetrate BBB more than 50% in 8 hours (Fig. 4b). Moreover, we compared the advantages of BSA as a carrier in penetrating the blood–brain barrier. We found that NR-BMS was to penetrate BBB compared with free NR within 8 h (the same PBS group as the controller), indicating that BMS nanoparticles can more effectively deliver drugs to the glioma area (Fig. 4d).3.6 GBM targeting ability of BMS
In vivo imaging system (PerkinElmer, USA) were used to explore the distribution of nanoparticles in the body after tail vein injection. In order to facilitate the detection, DiR was loaded into the BMS (DiR–BMS) as the same way before. As shown in Fig. 5b, free DiR mainly distributed in the liver, but DiR–BMS mainly distributed in the liver and GBM area, indicating that DiR–BMS had the GBM targeting and BBB penetration ability. After 12 h injection, DiR–BMS fluorescence intensity reached the highest, and had a gradual decay in next 72 h.3.7 Anti-GBM study of BMS
GBM bearing C57BL/6 male mice were used to explore the anti-GBM growth ability of BMS. The sizes of GBM was detected by IVIS at appropriate times. Compared with PBS group, SAL (50 μg per mouse) and BM (same volume with BMS) groups had no significant difference in GBM malignant growth. However, BMS group (50 μg SAL per mouse) was significantly inhibit the growth of GBM after tail vein injection everyday (Fig. 5c and 6a).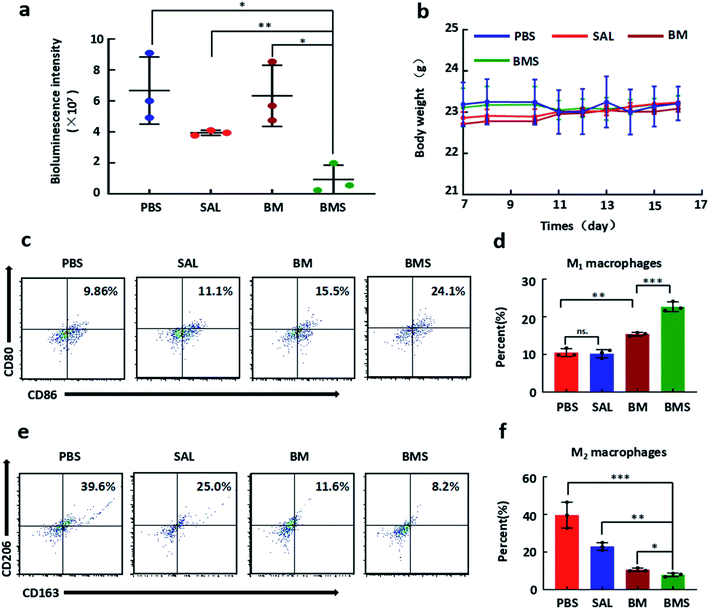 | ||
| Fig. 6 In vivo immunotherapy of BMS. (a) Quantified signal intensity after different formulation treatment at 16 d. (b) The body weight of GBM bearing mice in the progress of treatment. (c) Representative propotion of CD80 and CD86 cells expression after different formulation (PBS, SAL, BM, BMS) treatment. (d) The quantitative analysis of CD80, CD86 cells in GBM tissues after treatment according to Fig. 6c. (e) Representative propotion of CD163 and CD206 cells expression after different formulation (PBS, SAL, BM, BMS) treatment by flow cytometry. (f) The quantitative analysis of CD163, CD206 cells in GBM tissues after treatment according to Fig. 6e. *P < 0.05; **P < 0.01; ***P < 0.001. | ||
3.8 Macrophages repolarization ability of BMS in vivo
After 10 days treatment, GBM tissues were dissected from brain for flow cytometry analysis. As shown in Fig. 6c and e, free SAL group showed no significant changes in proportion of CD80 and CD86 cells (11.1%) compared with PBS group (9.86%), but decreased the CD163 and CD206 cells (25.0%) compared with the PBS group (39.6%). Both the BM group and the BMS group increased CD80 and CD86 cells, and the effect of BMS (24.1%) was more significant than that of BM (15.5%). Moreover, the proportion of CD163 and CD206 cells were decreased to BM (11.6%) and BMS (8.2%) groups compared with PBS group (Fig. 6c and e).3.9 Discussion
Traditional studies have regarded the brain as an immune-exempt organ, but this view has changed in recent years. Researchers have found that the skull and vertebrae are important sources of brain immune cells.20 Therefore, immunotherapy is of great significance in brain diseases, including GBM. M2 macrophages mainly exist in the tumour immune microenvironment, which promotes the malignant growth and metastasis of GBM.21 At present, great progress has been made in the polarization of M1 macrophages for cancer therapy. For example, M2 peptide (M2pep)-functionalized Au nanoparticles in lung cancer;22 matrix metalloprotease 2 (MMP2) responsive liposomes in breast cancer.23 However, there are still great difficulties in the treatment of glioblastoma due to the existence of the BBB and the special tumor immune microenvironment. Some nanoparticles have limited M1 macrophages polarization effects due to their inability to penetrate the BBB.Here, we used BSA to combine SAL and MnO2 to inhibit the growth of GBM and improve the immune microenvironment. BMS was synthesised in an alkaline environment (pH 11), Mn2+ was converted into MnO2 and supplemented with BSA, and SAL simultaneously entered the hydrophobic cavity of BSA. BMS is a type of nanoparticle that decomposes under acidic and H2O2-rich conditions. Our experiments demonstrated that the cytotoxicity of BMS within 48 h was significantly higher and BMS showed a greater ability to inhibit tumour cell migration at a pH of 6.5 in an H2O2-rich environment. This indicated that BMS was completely decomposed under acidic and H2O2-rich conditions, indicating that the TME is slightly acidic and H2O2 rich; these characteristics could be used to achieve the enrichment of BMS at the tumour site, as shown in Fig. 5b. Unlike free DiR, DiR–BMS showed signal enrichment in the brain and tumour sites and demonstrated a longer residence time at the tumour site, thus indicating that it possesses promising BBB penetration and drug delivery abilities.
The tumour growth inhibition mechanism of SAL mainly depends on apoptosis induction, necrosis efficacy, and tumour stem cell cytotoxicity, among other factors.24–26 However, few studies have investigated the effects of SAL on the immune microenvironment and the underlying mechanism. Unlike previously reported findings, in this study, we found that the repolarization ability of SAL on M2 macrophages was positively correlated with the drug concentration and that it had no obvious toxic effect on macrophages.17 This difference may be related to the source of the drug and the states of the cells. Interestingly, free SAL showed significant M1 macrophage polarisation ability in vitro, but its effect was limited in vivo. As shown in Fig. 6d, free SAL struggled to promote the enrichment of CD80 and CD86 cells in the GBM immune microenvironment in vivo. This phenomenon may be caused by the particularity of GBM. Owing to the immunosuppressive environment of the brain and the presence of the BBB, the immunotherapeutic effect of free SAL on GBM was relatively limited. Here, we used the BSA@MnO2 drug delivery system to improve the BBB penetration ability of SAL. Thus, more than 50% of BMS penetrated the BBB model within 8 h. Moreover, the tumour cells in the lower chambers took up more NR–BMS nanoparticles than free NR in flow cytometry analysis. This effect sufficiently proved that BMS improved the drug's ability to penetrate the BBB. Moreover, the Mn2+ produced by BMS decomposition enhanced the immune effect of SAL and significantly increased the proportions of CD80 and CD86 cells, compared with BM and free SAL. This demonstrates that BMS improved the immune microenvironment remodelling ability of SAL. In addition to repolarizing macrophages, the produced Mn2+ participated in MRI.
In vivo experiments showed that free SAL and BM had no obvious inhibitory effect on GBM, whereas BMS significantly inhibited tumour growth. This may be because of the following reasons: (1) the low concentration of SAL at the tumour site (due to the presence of the BBB) resulted in its limited immune remodelling ability and GBM cell cytotoxicity; (2) although BM could penetrate the BBB, the cytotoxicity of BM was not sufficient to inhibit GBM growth; and (3) BMS maintained SAL at a higher concentration at the tumour site and enhanced the immune remodelling effect of SAL. In this study, the polarization ability of BMS on macrophages mainly came from Mn2+ and SAL, but its molecular mechanism was still unclear, which requires further exploration.
4. Conclusions
Our research explored the immune function of SAL and applied the BSA@MnO2 drug delivery system to the immunotherapy of GBM for the first time. Our experimental results demonstrated that both Mn2+ and SAL have the ability to polarize M1 macrophages. BMS successfully combined Mn2+ and SAL, and improved the immune microenvironment of GBM and was of great significance to the treatment of GBM. Moreover, BSA–MnO2, a drug delivery system, has broad prospects in the treatment of GBM due to its ability of BBB penetration.Conflicts of interest
Authors declare no conflict of interests for this article.Acknowledgements
This work was supported by the Strategic Priority Research Program of Chinese Academy of Science (XDB36000000), National Key Research and Development Program of China (2017YFA0205000), National Natural Science Foundation of China (No. 81870927, 21773042, 31971295) and the Youth Innovation Promotion Association of Chinese Academy of Science (2018048) and Natural Science Foundation Project of Chongqing Science and Technology Commission (No. cstc2019jcyj-msxmX0239).References
- A. Omuro and L. M. DeAngelis, JAMA, J. Am. Med. Assoc., 2013, 310(17), 1842 CrossRef CAS PubMed.
- W. Wu, J. L. Klockow and M. Zhang, Pharmacol. Res., 2021, 171, 105780 CrossRef PubMed.
- N. Desbaillets and A. F. Hottinger, Cancers, 2021, 13(15), 3721 CrossRef PubMed.
- Z. An, Y. i. Hu and Y. Bai, OncoImmunology, 2021, 10(1), 1960728 CrossRef PubMed.
- S. Xu, X. Yan and D. Gan, Front. Oncol., 2021, 11, 692403 CrossRef PubMed.
- E. R. Matarredona and A. M. Pastor, Cells, 2019, 9(1), 96 CrossRef PubMed.
- P. Shueng, L. Yu and H. Chiu, Biomaterials, 2021, 276, 121012 CrossRef CAS PubMed.
- Q. Chen, L. Feng and J. Liu, Adv. Mater., 2016, 28(33), 7129 CrossRef CAS PubMed.
- J. Liu, X. Ai and H. Cabral, Biomaterials, 2021, 273, 120847 CrossRef CAS PubMed.
- D. Mrdjen, A. Pavlovic and F. J. Hartmann, Immunity, 2018, 48(3), 599 CrossRef CAS PubMed.
- P. Zhao, Y. Wang and X. Kang, Chem. Sci., 2018, 9(10), 2674 RSC.
- Y. Shi, Y. Ping and W. Zhou, Nat. Commun., 2017, 8, 15080 CrossRef CAS PubMed.
- M. Ovais, M. Guo and C. Chen, Adv. Mater., 2019, 31(19), 1808303 CrossRef PubMed.
- R. Zhao, J. Cao and X. Yang, Biomater. Sci., 2021, 9(13), 4568 RSC.
- H. Shen, C. C. Sun and L. Kang, Eur. J. Pharm. Sci., 2021, 157, 105629 CrossRef CAS PubMed.
- M. Norouzi, J. Firouzi and N. Sodeifi, Int. J. Pharm., 2021, 598, 120316 CrossRef CAS PubMed.
- H. Zhang, T. Wang and Y. Zheng, Biochem. Biophys. Res. Commun., 2018, 499(3), 488 CrossRef CAS PubMed.
- L. Wen, R. Hyoju and P. Wang, Lasers Surg. Med., 2021, 53(3), 390 CrossRef PubMed.
- W. Nie, G. Wu and J. Zhang, Angew. Chem., Int. Ed. Engl., 2020, 59(5), 2018 CrossRef CAS PubMed.
- A. Cugurra, T. Mamuladze and J. Rustenhoven, Science, 2021, 373(6553), eabf7844 CrossRef CAS PubMed.
- Y. Yang, C. Chien and A. Yarmishyn, Cancers, 2021, 13(8), 1799 CrossRef CAS PubMed.
- J. Conde, C. Bao and Y. Tan, Adv. Funct. Mater., 2015, 25(27), 4183 CrossRef CAS PubMed.
- M. Chen, Y. Miao and K. Qian, Nano Lett., 2021, 21(14), 6031 CrossRef CAS PubMed.
- H. Wang, H. Zhang and Y. Zhu, Front. Oncol., 2021, 11, 654428 CrossRef PubMed.
- Z. Wang, T. Feng and L. Zhou, Nanoscale, 2020, 12(38), 19931 RSC.
- N. Tsakiris, F. Fauvet and S. Ruby, J. Controlled Release, 2020, 326, 387 CrossRef CAS PubMed.
| This journal is © The Royal Society of Chemistry 2021 |

