 Open Access Article
Electrochemical biomass upgrading: degradation of glucose to lactic acid on a copper(II) electrode†
Lars Ostervold ab,
Sergio I. Perez Bakovic
 b,
Jamie Hestekin*b and
Lauren F. Greenlee
 *ab
*ab
aDepartment of Chemical Engineering, Pennsylvania State University, University Park, PA, USA. E-mail: greenlee@psu.edu
bRalph E. Martin Department of Chemical Engineering, Fayetteville, AR, USA. E-mail: jhesteki@uark.edu
First published on 22nd September 2021
Abstract
Biomass upgrading – the conversion of biomass waste into value-added products – provides a possible solution to reduce global dependency on nonrenewable resources. This study investigates the possibility of green biomass upgrading for lactic acid production by electrochemically-driven degradation of glucose. Herein we report an electrooxidized copper(II) electrode which exhibits a turnover frequency of 5.04 s−1 for glucose conversion. Chronoamperometry experiments under varied potentials, alkalinity, and electrode preparation achieved a maximum lactic acid yield of 23.3 ± 1.2% and selectivity of 31.1 ± 1.9% (1.46 V vs. RHE, 1.0 M NaOH) for a room temperature and open-to-atmosphere reaction. Comparison between reaction conditions revealed lactic acid yield depends on alkalinity and applied potential, while pre-oxidation of the copper had a negligible effect on yield. Post-reaction cyclic voltammetry studies indicated no loss in reactivity for copper(II) electrodes after a 30 hour reaction. Finally, a mechanism dependent on solvated Cu2+ species is proposed as evidenced by similar product distributions in electrocatalytic and thermocatalytic systems.
Introduction
Biomass upgrading, the conversion of biomass waste into value-added products, provides a possible solution to reduce global dependency on nonrenewable resources. Among value-added products, lactic acid has garnered much attention due to its large market – 1.2 billion kg in 2016 (Grand View Research).1 The current industries that employ lactic acid are numerous – food processing, pharmaceuticals, cosmetics, chemical production2 – and, while exact numbers vary, the market for lactic acid is projected to maintain an annual growth rate of >12% with a market >4 billion USD by 2022.1,3 The current production technology of fermentation (responsible for 90% of lactic acid production1) produces a slurry of products, where separation steps account for 40–70% of the total production cost of lactic acid.4 Combine this energy-inefficient production process with the possibility of lactic acid production from biomass waste products,5,6 and the opportunity for a more selective and greener conversion process through catalysis becomes apparent. In this work, we explore the possibility of producing lactic acid by a green, electrochemically-driven, biomass upgrading process.Biomass waste products with potential as a starting point for lactic acid production come in two primary forms – glycerol5 and cellulose.6 The conversion of glycerol to lactic acid is an active field,7 but the present work will focus on cellulose as the starting substrate. Waste cellulose has several sources (food-waste, paper milling, forestry, algal biomass),8,9 but the most abundant cellulose waste products are from agriculture.10–12 Cellulose is an organic polymer composed of monomer units of glucose. Before being converted to lactic acid, the cellulose must be hydrolyzed into glucose.13 The hydrolyzation of cellulose to glucose is a well-understood field;14–16 therefore, we use glucose as the starting substrate instead of cellulose.
The majority of studies on lactic acid production from glucose have employed thermally-driven systems with catalysts aimed at controlling glucose degradation products.6 The most promising progressions towards green reaction conditions were made by Choudhary et al.,17 Deng et al.,18 and Li et al.19 Choudhary et al.17 were the first to report high lactic acid yields (70%) at moderate temperatures (120 °C) by employing a Cu/MgO catalyst. The main drawbacks were the anaerobic atmosphere (0.4 MPa Ar) and the high temperature required, although 120 °C was a lower temperature than preceding studies. Deng et al.18 increased the lactic acid yield (81%) but raised the reaction temperature to 180 °C. Deng et al. utilized an Al(III)–Sn(II) catalyst – the bimetallic composition catalyzing the rate-limiting steps of glucose–fructose isomerization and C3–C4 cleavage, respectively.
The most promising results to date were achieved by Li et al.19 who employed a Ba(OH)2 salt catalyst and reported a lactic acid yield of 95.4% at room temperature. The downsides to the system employed include a high catalyst-to-substrate ratio (10![[thin space (1/6-em)]](https://www.rsc.org/images/entities/char_2009.gif) :
:![[thin space (1/6-em)]](https://www.rsc.org/images/entities/char_2009.gif) 1 by molarity), long reaction times (48 h), and an inert atmosphere (1 bar N2). The timescale of the Li et al. system offers little to no advantage over the timescales of fermentation. Progress has thus been made towards producing lactic acid from glucose at conditions that could replace fermentation, but a system with both high selectivity and optimized kinetics, while maintaining green conditions, has yet to be developed.
1 by molarity), long reaction times (48 h), and an inert atmosphere (1 bar N2). The timescale of the Li et al. system offers little to no advantage over the timescales of fermentation. Progress has thus been made towards producing lactic acid from glucose at conditions that could replace fermentation, but a system with both high selectivity and optimized kinetics, while maintaining green conditions, has yet to be developed.
A possibility for improvement lies in an electrochemical system, which can provide numerous advantages over traditional reactors, including high energy efficiencies in chemical conversion, higher practical efficiencies,20 low reaction temperatures and pressures compared to hydrothermal reactions, facile separation due to heterogenous catalysis, and the ability to be driven by renewable energy.21,22 The majority of previous electrochemical studies on glucose have been focused on glucose sensing for blood-sugar monitoring but have given insight into the mechanism of the reaction.23
Relatively few studies have been concerned with the products of glucose electrodegradation.24–32 Of studies concerned with products, only a few studies did not use precious metals as a catalyst.26–29 Studies have also predominately avoided carbon–carbon bond cleavage, as desired products were six-carbon molecules such as glucaric acid or gluconic acid.24–27 Only Moggia et al. have mentioned the production of smaller carbon molecules in a study focused on gluconic acid production, where the authors reported 54.2% formic acid (a one-carbon molecule) production by a copper electrode.28 To the best of our knowledge, no research has been published directly focused on production of carbon–carbon cleavage products from glucose electrodegradation, including lactic acid.
Given the lack of electrocatalyst development for glucose conversion to lactic acid, we approached catalyst selection based on progress made in the thermal catalysis literature. We hypothesized that mechanistic understanding of catalyst design from thermocatalytic production of lactic acid may be roughly translated to an electrochemical environment, providing a green pathway for lactic acid production from biomass. To test our hypothesis, we focused on a copper electrode in an alkaline environment since copper catalysts and alkaline environments are both common to thermocatalytic systems for glucose conversion. Cyclic voltammetry studies were first performed to evaluate electrode activity toward glucose. After discovering a large glucose oxidation peak, we used chronoamperometry studies in a room temperature, open-to-atmosphere reactor to degrade glucose. Product solutions were analyzed by high-performance liquid chromatography and the presence of lactic acid was confirmed. Upon the successful production of lactic acid, preliminary investigations into key reaction parameters were made through further electrochemical studies.
Experimental
Chemicals and solutions
D-Glucose (≥99.5%) was obtained from Sigma-Aldrich. Sodium hydroxide pellets (ACS grade), D-fructose (99%), potassium hydroxide pellets (≥85%), 5-hydroxymethylfurfural (≥97%), 1,3-dihydroxyacetone (≥97%), and pyruvic acid (≥98%) were all obtained from VWR. Lactic acid (85%), formic acid (85%), acetic acid (glacial), and glyceraldehyde (95%, dimer) were all obtained from Fischer Scientific. Electrolyte (KOH and NaOH) stock solutions were prepared and stored at room temperature; these stock solutions were used for all experiments. Solutions were prepared with deionized water from a Milli-Q Direct Water Purification system (18.2 MOhm cm).Electrode preparation
Copper foil (99.999%, 1.0 mm thick) was obtained from Sigma-Aldrich and cut into 1.0 cm × 2.5 cm pieces by a metal hand shear. Raw copper was sonicated for 10 minutes in 0.1 M HCl (<20 °C), polished with successive alumina slurries of 5 μm, 1 μm, 0.3 μm, and 0.05 μm until the copper surface resembled a mirror-like shine. The copper foil was then sonicated for 10 minutes in acetone to remove any organic substances. After this process, Kapton tape was wrapped horizontally along the copper to expose a 1 cm × 1 cm surface on each side. To oxidize the surface, the copper foil was held for one hour at 1.03 V vs. RHE in 0.5 M KOH to achieve a Cu2+ surface. This potential was selected based on a study performed by Giri et al.;33 the potential for Cu2+ oxidation was confirmed by our own cyclic voltammetry studies. Successful oxidation to a Cu2+ surface was confirmed by X-ray photoelectron spectroscopy (XPS). This catalyst synthesis is not novel, and detailed characterization can be found in prior literature.34Electrochemical experiments
All electrochemical experiments were performed using an SP-300 potentiostat/galvanostat from Biologic, where Hg/HgO (4.24 M KOH), platinum coil, and copper foil (as prepared in previous section) were used as the reference, counter, and working electrodes, respectively. Data were collected with EC-Lab software, and all potentials were converted to potential vs. RHE by the form of the Nernst equation below:| ERHE = EHg/HgO + 0.059pH + 0.098 |
A two-compartment borosilicate glass cell (Adams & Chittenden) was used as the reaction vessel for all experiments. The internal resistance of the cell was measured before all experiments (cyclic voltammetry or chronoamperometry) and was compensated at 85%. When applicable, solutions were mixed under light stirring until all reagents were completely dissolved. There was no stirring during reactions. All electrochemical studies were performed at room temperature in an open-to-atmosphere reaction vessel.
Product stream analysis
All samples were analyzed by high-performance liquid chromatography (Alliance HPLC System) equipped with a refractive index detector (Waters 2414) using an HPX-87H column (Aminex, Bio-Rad) at 25.0 °C. The eluent used was 10 mM sulfuric acid in deionized water (18.2 MOhm cm) running isocratically at 0.4 mL min−1. The sample injection volume was 30 μL, and samples were run for 35 minutes.External standards analyzed included: lactic acid, formic acid, 5-hydroxymethylfurfural, fructose, glucose, acetic acid, dihydroxyacetone, glyceraldehyde, and pyruvic acid. Time samples from the reaction vessel were obtained by pipetting 200 μL from the reaction vessel into 1800 μL of 0.1124 M HCl, and samples were stored at 4 °C. The stability of the samples over 48 hours under the specified conditions was tested, and no quantifiable change was detected. Two samples were taken at the start of each reaction, and three samples were taken at the conclusion of a reaction.
X-ray photoelectron spectroscopy
X-ray photoelectron spectroscopy (XPS) was performed on a PHI Versaprobe 5000, and analysis was done with CasaXPS software (XPS figures were produced in Origin). A monochromated Al Kα source, along with Ar and C-60 cluster ion guns, was used. An initial survey scan of 0–1200 eV was carried out on the samples, followed by detailed binding energy region scans of copper and oxygen (Fig. 1).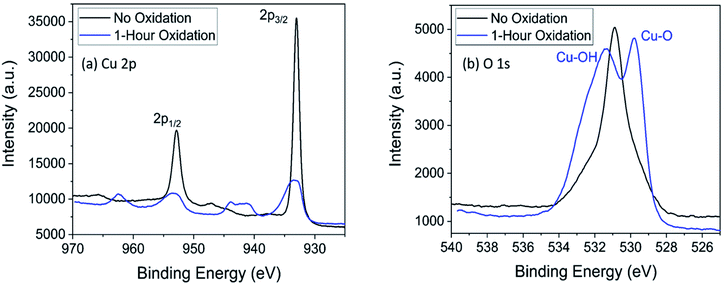 | ||
| Fig. 1 X-ray photoelectron spectroscopy of the Cu 2p region (a) and the O 1s region (b) for copper electrodes with no electrooxidation (black) and 1 hour of oxidation (blue). | ||
Calculations
Example calculations for all values listed in this study can be found in the ESI.†Results and discussion
Electrode preparation
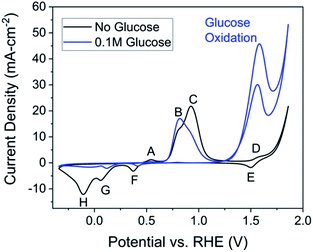
Thermocatalytic studies focused on lactic acid production were used to select the electrode material and oxidation state of the surface.6,17–19,35,36 Divalent metallic catalysts generally achieved the best lactic acid yield, and of those, cupric oxide (CuO) was among the catalysts with the highest yields.17,37 Therefore, a divalently-charged copper surface (Cu2+) was chosen as the working electrode for this system. After preparation, electrodes were analyzed by XPS to determine surface characteristics; survey spectra are presented in Fig. S1† and detailed region scan data are summarized in Fig. 1. In Fig. 1a, a shift to higher binding energies and a broadening of the Cu 2p3/2 peak are observed. This shift is expected for a metal oxide or metal hydroxide species, and peak broadening suggests the presence of both metal oxide and metal hydroxide species.38 The satellite peaks that appear around 962.4 eV, 943.8 eV, and 940.8 eV are characteristic of materials with a d9 electron configuration, i.e., a Cu2+ species.39 Small satellite peaks appear for Cu1+ species, but the relative intensity of the peaks suggests predominately Cu2+ species.40 Additionally, a right-leaning shoulder on the Cu 2p3/2 (933.0 eV) or Cu 2p1/2 (952.8 eV) peaks is expected if considerable amounts of Cu1+ are present; the lack of the shoulder for spectra of the oxidized electrode (blue line, Fig. 1a) indicates lack of Cu1+ species on the oxidized electrode.41,42In the oxygen 1s region (Fig. 1b), the presence of the O 1s peak on the electrode with no oxidation is likely explained by organic contamination since carbon was also detected on the unoxidized electrode. Peak fitting for the O 1s region supported this conclusion (Fig. S2†). The doublet peak (531.4 eV and 529.8 eV) indicates the presence of two species. Supported by expected values from Moulder et al.38 and similar analyses,43–45 we conclude the peak at 531.4 eV is caused by Cu(OH)2 species, and the peak at 529.8 eV is caused by CuO species. By a combination of XPS data with the previous literature on copper electrooxidation (discussed in succeeding section), we conclude that Cu was oxidized to both CuO and Cu(OH)2 species, and little to no Cu2O species remain, as also indicated by the lack of expected reduction peak in Fig. 2 (discussed below) and the relative intensity of the Cu2+ satellite in Fig. 1a. The presence of Cu(OH)2 is expected based on previous literature concerning the electrooxidation of copper.33
Activity of copper electrode towards glucose
A set of cyclic voltammetry (CV) studies was used to prove the oxidized copper electrode exhibits activity towards glucose. CVs were compared in the presence and absence of glucose (Fig. 2). First, each peak related to copper surface redox reactions in the absence of glucose was identified. The cyclic voltammetry of copper in the absence of glucose shows four distinct oxidation peaks (A–D) and four distinct reduction (E–H) peaks (Fig. 2, black). For assistance in understanding cyclic voltammetry, we refer the reader to an introductory cyclic voltammetry article by Elgrishi et al.46Product yield under varying conditions
The goals of the product yield study were to confirm production of lactic acid and assess the quantitative conversion of glucose to lactic acid and other by-products. A thorough pathway discussion is given later, and a simplified progression of the reaction is seen in Scheme 1. Fructose exists in isomerization with glucose and can be considered as an unconverted reactant while formic acid can be viewed as an ‘over-reaction’ product, due to either excessive oxidation or C–C bond cleavage. Product solutions were analyzed by HPLC with a refractive index and UV detector, as detailed in the experimental section. Lactic acid production was doubly confirmed by an external standard (Fig. S3†) comparison to a reaction chromatogram (Fig. S4†) and spiking a reaction sample with purified lactic acid (Fig. S5†). Both of the tests indicated the presence of lactic acid, supporting our primary hypothesis that a copper oxide-based electrode will enable conversion of glucose to lactic acid. Having confirmed the possibility of the reaction, a preliminary study to optimize lactic acid yield was performed.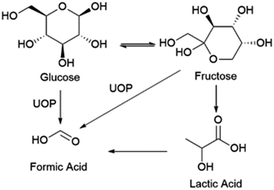 | ||
| Scheme 1 Simplified reaction scheme for the electrochemical oxidation of glucose. UOP is unknown oxidation process. | ||
Three parameters were varied to test their effect on product yield. From previous electrochemical studies, carbon–carbon bond cleavage is also thought to occur at the glucose oxidation peak in Fig. 2.28 Since lactic acid is a three-carbon molecule, some cleavage is required, but further degradation of lactic acid is ideally avoided. There may exist an optimal potential at which to achieve this condition, so voltages were varied to explore this hypothesis. The second parameter varied was alkalinity, as previous studies have shown alkalinity to play a role in both the rate and ratio of product formation in glucose degradation.65 The final parameter varied is the oxidation time during preparation of the Cu2+ electrode. Since the glucose degradation reaction is performed above the potential for Cu2+ formation, the oxidation step in catalyst preparation may be unnecessary as the time copper spends in a Cu0 state would be minimal; however, we wanted to confirm whether pre-oxidation of the copper electrode was required for glucose degradation. The reaction conditions are summarized in Table 1, and respective yields are shown in Fig. 4. Fig. 4 shows fructose and formic acid are the main undesired side-products, consistent with those reported in thermocatalytic literature.6
| Condition | Potential (V vs. RHE) | Concentration of NaOH (M) | Cu electrode oxidation time (min) |
|---|---|---|---|
| 1 | 1.56 | 1.0 | 60 |
| 2 | 1.51 | 1.0 | 60 |
| 3 | 1.46 | 1.0 | 60 |
| 4 | 1.46 | 0.5 | 60 |
| 5 | 1.46 | 1.0 | None |
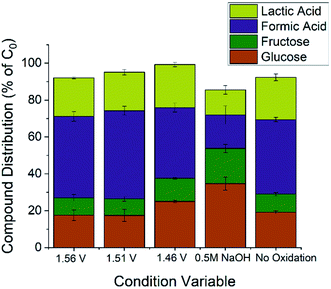 | ||
| Fig. 4 Product distribution for the five conditions outlined in Table 1. Each condition was repeated three times and quantification was performed with external standards on high-performance liquid chromatography. Glucose concentration was 0.10 M for all conditions. Working electrode was Cu foil (2 cm2) after being oxidized for 1 hour (conditions 1–4, no oxidation for condition 5) – reference and counter electrodes were Hg/HgO and platinum coil, respectively. Quantitative data can be found in Table S1.† | ||
The remaining carbons to complete the mass balance lie mostly in a mixture of six-carbon molecules (glucose oxidation products) along with other C–C bond cleavage products. Compounds besides the four quantified were not the focus of this study and were not quantified since Fig. 4 shows side-products would be in the minority of compounds.
Comparing the 1.56 V and 1.51 V conditions to 1.46 V, the concentration for all quantified species in the final solution varies with 95% confidence. The differences between the 1.46 V conditions and the 1.56 V and 1.51 V conditions can be explained by the C–C bond cleavage mechanism. Higher potentials should cause higher glucose conversion and formic acid yield while decreasing the lactic acid yield, which is the trend observed in Fig. 4. The higher fructose concentration for the 1.46 V condition indicates that C–C bonds in fructose are also susceptible to cleavage by electrochemically-driven processes. From these conditions, 1.46 V vs. RHE gave the highest lactic acid yield and selectivity (>95% confidence interval), indicating the ideal potential for this reaction resides in the lower potential range of the glucose oxidation peak for the conditions tested.
All species in the final solution varied significantly (>95% confidence interval) when the alkalinity was halved from 1.0 M NaOH to 0.5 M NaOH. As expected, the glucose conversion decreased with decreased alkalinity, but the magnitude of this change was surprising. However, both the basicity of the solution and hydroxide ion interaction with the electrode promote glucose degradation; the dual dependence on alkalinity could explain the extent of the change. The high concentration of fructose is explained by the dependence of the isomeric equilibrium of glucose and fructose on the concentration of hydroxide species.65
As expected, with a lower glucose conversion, the concentration of products also dropped; however, the drop in lactic acid selectivity (31.1 ± 1.9% for 1.0 M NaOH vs. 20.8 ± 4.7% for 0.5 M NaOH) is noted. While decreased selectivity is partially explained by the higher fructose concentration, the results indicate alkalinity plays an important role in lactic acid selectivity. In thermocatalytic literature, the isomerization between glucose and fructose plays an important role, as lactic acid is suggested to proceed from fructose.6,18,19,35,36 Increasing the pH shifts the equilibrium towards fructose, and, intuitively, increases the lactic acid yield. However, an electrochemical system gives conflicting results compared to this expected result; with increasing pH, the lactic acid yield increases but the concentration of fructose decreases.
The conflicting result may be explained by considering the pH-dependence of carbohydrate oxidation on a copper electrode. Copper electrodes show increased activity with increased pH, likely due to the mechanism requiring an adsorbed hydroxide species.23,66,67 These conclusions are supported by time sampling data for the 1.0 M NaOH and 0.5 M NaOH conditions (Fig. S6†). The glucose conversion is more rapid in 1.0 M NaOH and the equilibrium concentration for fructose is lower, likely due to increased degradation rates of fructose. The formic acid production rate also increases in 1.0 M NaOH, suggesting increased degradation and oxidation rates.
In an additional experiment, the salt was changed from NaOH to KOH, but no statistically significant differences in compound distribution were found.
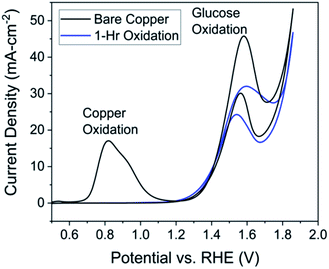
The similar yields for formic and lactic acid could be explained by noticing the reaction is performed at 1.46 V vs. RHE, well above the oxidation potential for a Cu0 to Cu2+ transition, so CuO and Cu(OH)2 species could form on the surface regardless of the pre-reaction oxidation.‡ The almost identical cyclic voltammetry results between pre-oxidized and unoxidized electrodes supports the idea of rapid Cu0 oxidation to Cu2+ without pre-oxidation (Fig. S10†).
| System | g lactic acid·(g catalyst)−1 | g lactic acid L−1 h−1 |
|---|---|---|
| Electrodegradation | 0.23 | 0.140 |
| Fermentation68 | 0.97 | 2.20 |
The fact that the production numbers for glucose electrodegradation are within an order of magnitude is promising for the method of lactic acid production by electrodegradation. For the present study, only preliminary efforts have been made to optimize lactic acid production as the main goal was to prove the possibility of producing lactic acid through electro-degradation of glucose. Improvements to lactic acid production rate and selectivity can be made through catalyst, electrode, and reactor design, with envisioned gains in production rate that could make electrochemical glucose conversion competitive.
Electrode recyclability (pre- vs. post-reaction cyclic voltammetry)
Three CV studies were performed for each condition – one before the reaction, another after the reaction in the same solution, and then one in a new glucose solution (identical to pre-reaction solution) with the same electrode. These data are displayed in Fig. 5. The two goals for the experiments were to (1) assess electrode recyclability by testing the activity of a used electrode in a new solution and (2) determine if new electroactive products are formed during the reaction, indicated by new redox peaks in the cyclic voltammetry. The minimum potential for the CV experiments was kept above the reduction potential (0.6 V vs. RHE) for copper in order to maintain the CuO/Cu(OH)2 layer formed during electrode preparation. Testing the activity of the catalysts by pre vs. post reaction CVs was validated by an integrated Cottrell test (Fig. S7†) and a Tafel slope analysis (Fig. S8†).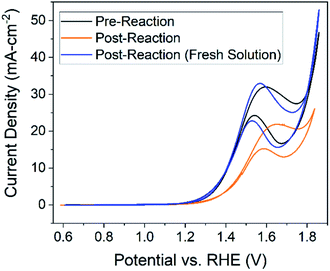 | ||
| Fig. 5 Cyclic voltammetry performed at a scan rate of 50 mV s−1 in 1.0 M NaOH (pH = 13.6 and 13.2 for new and final solutions respectively). Starting glucose concentration was 0.1 M. Scans performed prior to the reaction (black), after a 30 hour 1.46 V chronoamperometry reaction in the same solution (orange), and in a new solution with the same electrode (blue) are all shown. Working electrode was Cu foil (2 cm2) after being oxidized for 1 hour (black) or oxidized for 1 hour plus a 30 hour reaction at 1.46 V vs. RHE (blue and orange) – reference and counter electrodes were Hg/HgO and platinum coil, respectively. All sets of data are taken from the 5th cycle of the scan. Pre- vs. post-reaction studies for all conditions can be found in Fig. S10.† | ||
Additional redox peaks were not expected for the post-reaction CV in the same solution. Recall that C–C bond cleavage is expected to occur under the glucose oxidation peak; therefore, if glucose degradation products are electroactive, reactions of those products would likely fall underneath the same peak. However, in CV experiments involving expected products (Fig. S9†), the oxidation peak shifted to higher potentials relative to the glucose oxidation peak, reflecting the orange curve shift in Fig. 5. Therefore, we suspect the shift by the orange curve is indicative of the increase in glucose degradation products. This assertion is additionally supported by the fact that the glucose oxidation peak returns to its original potential in a new solution. The post-reaction peak does exhibit more plateau behavior compared to the pre-reaction peak, which is explained by considering the limiting-mechanism discussion related to Fig. 3.
The most important conclusion from this experiment comes from comparing peak current in the pre-reaction solution (Fig. 5, black) to the post-reaction current in a fresh solution (Fig. 5, blue). If the electrode is stable over the course of the reaction the peak current would be the same for both cyclic voltammetry experiments, which is largely observed in Fig. 5. From these data, we can conclude the electrode, in terms of activity, is stable over at least 30 hours. The post-reaction electrode even exhibits a higher current density than the pre-reaction electrode and the shape of the peak resembles that of the unprepared electrode (Fig. 3, black).
Changes in the post-reaction peak shape indicate alteration of electrode surface characteristics over the course of the reaction. Given earlier discussions of hydroxide and glucose adsorption, the differences in the cyclic voltammograms can be explained by acknowledging pre-measurement conditions. The pre-reaction electrode was transferred from a 0.5 M KOH solution containing no glucose, while the post-reaction electrode had just finished reacting for 30 hours in a 1.0 M NaOH and 0.1 M glucose solution. We should expect active sites on the pre-reaction electrode to be occupied by only hydroxide ions while active sites on the post-reaction electrode will contain a mixture of hydroxide ions along with glucose and subsequent degradation products. In other words, differences in species occupying the electrode active sites cause the changes in cyclic voltammetry experiments between the pre-reaction (Fig. 5, black) and post-reaction in fresh solution (Fig. 5, blue) measurements. Additionally, observed dissolution of Cu species would change the surface site density and also explains differences between voltammograms.
Mechanism
There are two plausible mechanisms for glucose oxidation. The mechanism most often reported is oxidation driven by the parallel chemical reduction of Cu3+ species.67 In the alternative mechanism, oxidation is driven by the semi-conductor properties of CuO by pairing electron vacancies with hydroxide ions.69Recently, Barragan et al.69 used Raman spectroscopy to show Cu3+ (actually d9L Cu2+)§ species were not detected during glucose oxidation and, concluding Cu3+ species were not involved in the reaction, proposed an alternative mechanism based on the semiconductor properties of CuO.69 However, lack of the distinctive Cu3+ Raman peak could either indicate Cu3+ is not present during the reaction or that Cu3+ is a highly-reactive intermediate whose time-scale of existence is too short to be detected by Raman. The findings by Barragan et al. are nevertheless interesting and warrant further investigation into the mechanism of glucose degradation in an electrochemical environment.
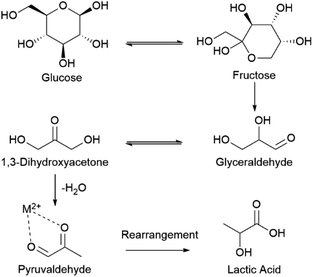 | ||
| Scheme 2 Consensus mechanism for homogenous thermocatalytic conversion of glucose to lactic acid.6,18,19,34,35 | ||
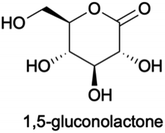
We propose a similar mechanism for an electrocatalytic system (Fig. 6); however, the behavior of thermocatalytic and electrocatalytic systems are fundamentally different so some clarifications must be made. In thermocatalytic literature, the retro-aldol step is driven by the alkaline environment. In an electrocatalytic system, the retro-aldol step can additionally be catalyzed by electrooxidation and a 3 + 3 cleavage could be promoted by adsorption to the Cu2+ surface or by solvated Cu2+ ions (Fig. 6f–i). We note the preference of 3 + 3 cleavage is indicated by the lack of 5, 4, and 2 carbon molecules detected during HPLC analysis. Also note that in an electrochemical reaction, an oxidation of glucose yields 1,5-gluconolactone23,27,32,69 (Chart 1), which would form lactic acid after a C3–C4 bond cleavage and a dehydration reaction (Fig. 6b–e).
The hydride shifting is likely present in an electrocatalytic system as well, and formation of lactic acid could also be favored due to interaction with Cu2+ species. However, in an electrocatalytic system, we note these intermediates could be oxidized by the electrode during shifting. Oxidation of intermediates could explain the absence of some expected intermediates as well as the high formic acid yields. Oxidation of intermediates is expected based on previous studies.72
Conclusions
The primary objective of this study was to produce lactic acid by green electrooxidation of glucose. Lactic acid production was doubly confirmed by an external standard and spiking reaction samples with purified lactic acid. The maximum lactic acid yield was 23.3 ± 1.2%, and the maximum lactic acid selectivity was 31.1 ± 1.9%. Compared with the rate of lactic acid production by fermentation, the rate for electrochemical processes was within an order of magnitude for the conditions tested, suggesting further development of both electrocatalyst and reactor conditions could enable a competitive process.Cyclic voltammetry studies in the presence of glucose showed high activity of the copper oxide surface towards glucose oxidation. A limiting mechanism of hydroxide adsorption was proposed based on the shape of the glucose oxidation peak for oxidized and unoxidized electrodes, which was later supported by pre-reaction and post-reaction cyclic voltammetry. Post-reaction cyclic voltammetry also revealed the electrode maintains activity after a 30 hour reaction, indicating excellent recyclability. A brief evaluation of proposed glucose oxidation mechanisms was performed and revealed a gap in mechanistic understanding. A pathway for lactic acid production from glucose in an electrocatalytic system is proposed and parallels the consensus thermocatalytic pathway.
Conflicts of interest
There are no conflicts to declare.Acknowledgements
This work was supported by the College of Engineering and the Ralph E. Martin Department of Chemical Engineering at the University of Arkansas. We thank Dr Geletu Qing for their input on the fundamentals of electrode poisoning.Notes and references
- A. Komesu, J. A. Rocha de Oliveira, L. H. da Silva Martins, M. R. Wolf Maciel and R. Maciel Filho, BioResources, 2017, 12, 4364–4383 CAS.
- J. Ouyang, R. Ma, Z. Zheng, C. Cal, M. Zhang and T. Jiang, Bioresour. Technol., 2013, 135, 475–480 CrossRef CAS PubMed.
- M. A. Abdel-Rahman, Y. Tashiro and K. Sonomoto, J. Biotechnol., 2011, 156, 286–301 CrossRef CAS PubMed.
- K. L. Wasewar, A. B. M. Heesink, G. F. Versteeg and V. G. Pangarkar, J. Biotechnol., 2002, 97, 59–68 CrossRef CAS PubMed.
- N. Razali and A. Z. Abdullah, Appl. Catal., A, 2017, 543, 234–246 CrossRef CAS.
- A. Bayu, A. Abudula and G. Guan, Fuel Process. Technol., 2019, 196, 106162 CrossRef CAS.
- S. Rahim, C. S. Lee, F. Abnisa, M. K. Aroua, W. A. W. Daud, P. Cognet and Y. Peres, Sci. Total Environ., 2020, 705, 27 CrossRef PubMed.
- S. Hama, S. Mizuno, M. Kihara, T. Tanaka, C. Ogino, H. Noda and A. Kondo, Bioresour. Technol., 2015, 187, 167–172 CrossRef CAS PubMed.
- I. Y. Eom, Y. H. Oh, S. J. Park, S. H. Lee and J. H. Yu, Bioresour. Technol., 2015, 185, 143–149 CrossRef CAS PubMed.
- M. Pruckler, C. Lorenz, A. Endo, M. Kraler, K. Durrschmid, K. Hendriks, F. S. da Silva, E. Auterith, W. Kneifel and H. Michlmayr, Food Microbiol., 2015, 49, 211–219 CrossRef PubMed.
- J. L. Hu, Z. T. Zhang, Y. X. Lin, S. M. Zhao, Y. X. Mei, Y. X. Liang and N. Peng, Bioresour. Technol., 2015, 182, 251–257 CrossRef CAS PubMed.
- S. Nakano, C. U. Ugwu and Y. Tokiwa, Bioresour. Technol., 2012, 104, 791–794 CrossRef CAS PubMed.
- R. Datta and M. Henry, J. Chem. Technol. Biotechnol., 2006, 81, 1119–1129 CrossRef CAS.
- A. Onda, T. Ochi and K. Yanagisawa, Green Chem., 2008, 10, 1033–1037 RSC.
- Y.-B. Huang and Y. Fu, Green Chem., 2013, 15, 1095–1111 RSC.
- A. Shrotri, H. Kobayashi and A. Fukuoka, Acc. Chem. Res., 2018, 51, 761–768 CrossRef CAS PubMed.
- H. Choudhary, S. Nishimura and K. Ebitani, Appl. Catal., B, 2015, 162, 1–10 CrossRef CAS.
- W. P. Deng, P. Wang, B. J. Wang, Y. L. Wang, L. F. Yan, Y. Y. Li, Q. H. Zhang, Z. X. Cao and Y. Wang, Green Chem., 2018, 20, 735–744 RSC.
- L. Li, F. Shen, R. Smith and X. Qi, Green Chem., 2017, 19, 76–81 RSC.
- A. Schafer, J. B. Heywood and M. A. Weiss, Energy, 2006, 31, 2064–2087 CrossRef.
- C. H. Lam, A. J. Bloomfield and P. T. Anastas, Green Chem., 2017, 19, 1958–1968 RSC.
- C. C. Dai, L. B. Sun, H. B. Liao, B. Khezri, R. D. Webster, A. C. Fisher and Z. C. J. Xu, J. Catal., 2017, 356, 14–21 CrossRef CAS.
- K. E. Toghill and R. G. Compton, Int. J. Electrochem. Sci., 2010, 5, 1246–1301 CAS.
- D. S. Bin, H. Wang, J. X. Li, Z. Yin, J. L. Kang, B. Q. He and Z. H. Li, Electrochim. Acta, 2014, 130, 170–178 CrossRef CAS.
- J. Lee, B. Saha and D. G. Vlachos, Green Chem., 2016, 18, 3815–3822 RSC.
- M. Ibert, P. Fuertes, N. Merbouh, C. Fiol-Petit, C. Feasson and F. Marsais, Electrochim. Acta, 2010, 55, 3589–3594 CrossRef CAS.
- W. J. Liu, Z. R. Xu, D. T. Zhao, X. Q. Pan, H. C. Li, X. Hu, Z. Y. Fan, W. K. Wang, G. H. Zhao, S. Jin, G. W. Huber and H. Q. Yu, Nat. Commun., 2020, 11, 11 CrossRef PubMed.
- G. Moggia, T. Kenis, N. Daems and T. Breugelmans, ChemElectroChem, 2020, 7, 86–95 CrossRef CAS.
- V. Vedovato, K. Vanbroekhoven, D. Pant and J. Helsen, Molecules, 2020, 25, 37 CrossRef PubMed.
- Y. Holade, K. Servat, T. W. Napporn, C. Morais, J. M. Berjeaud and K. B. Kokoh, ChemSusChem, 2016, 9, 252–263 CrossRef CAS PubMed.
- K. Kokoh, J.-M. Léger, B. Beden, H. Huser and C. Lamy, Electrochim. Acta, 1992, 37, 1909–1918 CrossRef CAS.
- B. Beden, F. Largeaud, K. B. Kokoh and C. Lamy, Electrochim. Acta, 1996, 41, 701–709 CrossRef CAS.
- S. Giri and A. Sarkar, J. Electrochem. Soc., 2016, 163, I1252–I1259 CrossRef.
- S. Anantharaj, H. Sugime and S. Noda, ACS Appl. Mater. Interfaces, 2020, 12, 27327–27338 CrossRef CAS PubMed.
- A. Marianou, C. Michailof, A. Pineda, E. Iliopoulou, K. Triantafyllidis and A. Lappas, Appl. Catal., A, 2018, 555, 75–87 CrossRef CAS.
- Z. Huo, Y. Fang, D. Ren, S. Zhang, G. Yao, X. Zeng and F. Jin, ACS Sustainable Chem. Eng., 2014, 2, 2765–2771 CrossRef CAS.
- Y. Q. Wang, F. M. Jin, M. Sasaki, Wahyudiono, F. W. Wang, Z. Z. Jing and M. Goto, AIChE J., 2013, 59, 2096–2104 CrossRef CAS.
- J. F. Moulder and J. Chastain, Handbook of X-ray Photoelectron Spectroscopy: A Reference Book of Standard Spectra for Identification and Interpretation of XPS Data, Physical Electronics Division, PerkinElmer Corporation, 1992 Search PubMed.
- Q. Wang, Q. Wang, M. Li, S. Szunerits and R. Boukherroub, RSC Adv., 2015, 5, 15861–15869 RSC.
- D. Tahir and S. Tougaard, J. Phys.: Condens. Matter, 2012, 24, 175002 CrossRef PubMed.
- H. Maaoui, F. Teodoresu, Q. Wang, G.-H. Pan, A. Addad, R. Chtourou, S. Szunerits and R. Boukherroub, Sensors, 2016, 16, 1720 CrossRef PubMed.
- H. Maaoui, S. K. Singh, F. Teodorescu, Y. Coffinier, A. Barras, R. Chtourou, S. Kurungot, S. Szunerits and R. Boukherroub, Electrochim. Acta, 2017, 224, 346–354 CrossRef CAS.
- O. Akhavan, R. Azimirad, S. Safa and E. Hasani, J. Mater. Chem., 2011, 21, 9634–9640 RSC.
- O. Akhavan, J. Phys. D: Appl. Phys., 2008, 41, 235407 CrossRef.
- A. Katerski, A. Mere, V. Kazlauskiene, J. Miskinis, A. Saar, L. Matisen, A. Kikas and M. Krunks, Thin Solid Films, 2008, 516, 7110–7115 CrossRef CAS.
- N. Elgrishi, K. J. Rountree, B. D. McCarthy, E. S. Rountree, T. T. Eisenhart and J. L. Dempsey, J. Chem. Educ., 2018, 95, 197–206 CrossRef CAS.
- A. M. S. El Din and F. M. A. El Wahab, Electrochim. Acta, 1964, 9, 113–121 CrossRef CAS.
- M. J. Dignam and D. B. Gibbs, Can. J. Chem., 1970, 48, 1242–1250 CrossRef CAS.
- N. A. Hampson, J. B. Lee and K. I. Macdonald, J. Electroanal. Chem. Interfacial Electrochem., 1971, 32, 165–173 CrossRef CAS.
- S. M. A. Elhaleem and B. G. Ateya, J. Electroanal. Chem., 1981, 117, 309–319 CrossRef.
- B. Miller, J. Electrochem. Soc., 1969, 116, 1675 CrossRef CAS.
- J. Ambrose and D. Shoesmit, J. Electroanal. Chem., 1973, 47, 47–64 CrossRef CAS.
- L. P. Xia, L. Liu, N. Deng, Y. W. Zhu and J. B. He, Microchim. Acta, 2015, 182, 1289–1295 CrossRef CAS.
- M. W. Lister, Can. J. Chem., 1953, 31, 638–652 CrossRef CAS.
- I. M. DiMucci, J. T. Lukens, S. Chatterjee, K. M. Carsch, C. J. Titus, S. J. Lee, D. Nordlund, T. A. Betley, S. N. MacMillan and K. M. Lancaster, J. Am. Chem. Soc., 2019, 141, 18508–18520 CrossRef CAS PubMed.
- J. K. Burdett and S. Sevov, J. Am. Chem. Soc., 1995, 117, 12788–12792 CrossRef CAS.
- J. H. Choy, D. K. Kim, S. H. Hwang and J. C. Park, J. Am. Chem. Soc., 1995, 117, 7556–7557 CrossRef CAS.
- Y. Deng, A. D. Handoko, Y. Du, S. Xi and B. S. Yeo, ACS Catal., 2016, 6, 2473–2481 CrossRef CAS.
- D. Naumann, T. Roy, K. F. Tebbe and W. Crump, Angew. Chem., Int. Ed. Engl., 1993, 32, 1482–1483 CrossRef.
- Y. K. Maurya, K. Noda, K. Yamasumi, S. Mori, T. Uchiyama, K. Kamitani, T. Hirai, K. Ninomiya, M. Nishibori, Y. Hori, Y. Shiota, K. Yoshizawa, M. Ishida and H. Furuta, J. Am. Chem. Soc., 2018, 140, 6883–6892 CrossRef CAS PubMed.
- B. Yao, D. X. Wang, Z. T. Huang and M. X. Wang, Chem. Commun., 2009, 2899–2901 RSC.
- T. Mizokawa, A. Fujimori, H. Namatame, K. Akeyama and N. Kosugi, Phys. Rev. B: Condens. Matter Mater. Phys., 1994, 49, 7193 CrossRef CAS PubMed.
- D. Pletcher, J. Appl. Electrochem., 1984, 14, 403–415 CrossRef CAS.
- Y. Xie and C. O. Huber, Anal. Chem., 1991, 63, 1714–1719 CrossRef CAS.
- A. A. Marianou, C. M. Michailof, A. Pineda, E. F. Iliopoulou, K. S. Triantafyllidis and A. A. Lappas, ChemCatChem, 2016, 8, 1100–1110 CrossRef CAS.
- A. Bagger, R. M. Aran-Ais, J. H. Stenlid, E. C. dos Santos, L. Arnarson, K. D. Jensen, M. Escudero-Escribano, B. R. Cuanya and J. Rossmeisl, ChemPhysChem, 2019, 20, 3096–3105 CrossRef CAS PubMed.
- J. M. Marioli and T. Kuwana, Electrochim. Acta, 1992, 37, 1187–1197 CrossRef CAS.
- D.-M. Bai, Q. Wei, Z.-H. Yan, X.-M. Zhao, X.-G. Li and S.-M. Xu, Biotechnol. Lett., 2003, 25, 1833–1835 CrossRef CAS PubMed.
- J. T. C. Barragan, S. Kogikoski, E. da Silva and L. T. Kubota, Anal. Chem., 2018, 90, 3357–3365 CrossRef CAS PubMed.
- L. D. Burke, Electrochim. Acta, 1994, 39, 1841–1848 CrossRef CAS.
- J. M. Zadeii, J. Marioli and T. Kuwana, Anal. Chem., 1991, 63, 649–653 CrossRef CAS.
- K. Kano, M. Torimura, Y. Esaka, M. Goto and T. Ueda, J. Electroanal. Chem., 1994, 372, 137–143 CrossRef CAS.
- W. R. Zheng, Y. Li, C. S. Tsang, L. S. Hu, M. J. Liu, B. L. Huang, L. Y. S. Lee and K. Y. Wong, ChemElectroChem, 2017, 4, 2788–2792 CrossRef CAS.
- Q. Xu, Y. Zhao, J. Z. Xu and J. J. Zhu, Sens. Actuators, B, 2006, 114, 379–386 CrossRef CAS.
- H. Wei, J.-J. Sun, L. Guo, X. Li and G.-N. Chen, Chem. Commun., 2009, 2842–2844 RSC.
- J. Yang, Q. Lin, W. Yin, T. Jiang, D. Zhao and L. Jiang, Sens. Actuators, B, 2017, 253, 1087–1095 CrossRef CAS.
- C.-H. Wu, E. Onno and C.-Y. Lin, Electrochim. Acta, 2017, 229, 129–140 CrossRef CAS.
- A. Molazemhosseini, L. Magagnin, P. Vena and C.-C. Liu, J. Electroanal. Chem., 2017, 789, 50–57 CrossRef CAS.
- S. D. Sun, X. Z. Zhang, Y. X. Sun, S. C. Yang, X. P. Song and Z. M. Yang, ACS Appl. Mater. Interfaces, 2013, 5, 4429–4437 CrossRef CAS PubMed.
- P. Si, Y. J. Huang, T. H. Wang and J. M. Ma, RSC Adv., 2013, 3, 3487–3502 RSC.
- L. Hou, H. Zhao, S. Bi, Y. Xu and Y. Lu, Electrochim. Acta, 2017, 248, 281–291 CrossRef CAS.
- J. Song, L. Xu, C. Zhou, R. Xing, Q. Dai, D. Liu and H. Song, ACS Appl. Mater. Interfaces, 2013, 5, 12928–12934 CrossRef CAS PubMed.
Footnotes |
| † Electronic supplementary information (ESI) available: XPS survey scans; HPLC data; CV data; calculation details. See DOI: 10.1039/d1ra06737k |
| ‡ A study by Deng et al. with chemically-oxidized copper surfaces has indicated Cu2+ species will not form from Cu0 at these potentials,58 but those studies were not performed in the presence of glucose and underwent different oxidation processes. The Cu–glucose complex that forms during this reaction and interactions thereof remain unstudied so conclusions from the Deng study cannot be applied to this system. |
| § The distinctive Cu3+ Raman peak for this study was based on a NaCuO2 reference material. Mizokawa et al.62 showed Cu in NaCuO2 exists as d9L Cu2+ rather than d8 Cu3+, where dn denotes the number n of electrons in the 3d orbital of copper and L denotes an electron vacancy in oxygen. |
| This journal is © The Royal Society of Chemistry 2021 |

