 Open Access Article
Study on the kinetic characteristics of gas hydrate in the dioctyl sodium sulfosuccinate system
Xiaofang Lv *ab,
Shu Jing
 a,
Deyin Zhaob,
Dayong Lua,
Yang Liu*a,
Qianli Maa,
Shangfei Songc and
Shidong Zhou
 a
a
aJiangsu Key Laboratory of Oil and Gas Storage & Transportation Technology, Changzhou University, Changzhou 213016, China. E-mail: lvxiaofang5@cczu.edu.cn; lvxiaofang5@126.com; Tel: +86-519-8329-0280
bChina Petroleum & Chemical Corporation Northwest Oilfield Branch, Petroleum Engineering Technology Research Institute, Urumqi 830011, China
cNational Engineering Laboratory for Pipeline Safety/MOE Key Laboratory of Petroleum Engineering/Beijing Key Laboratory of Urban Oil and Gas Distribution Technology, China University of Petroleum-Beijing, Beijing 102249, China
First published on 7th December 2021
Abstract
Surfactants promote the production of hydrates, which provide a possibility for the industrialization of hydrate technology. In this paper, methane and CO2 hydrate formation experiments were carried out, respectively, with surfactant-dioctyl sodium sulfosuccinate (DSS) using a visual experimental apparatus at a constant pressure. This study explored the influence of the surfactant dosage, experimental pressure, and subcooling temperature on the dynamic characteristics of hydrate formation. The results indicated that a small amount of surfactant had a significant promotion effect on the formation of hydrate, i.e., 600 mg L−1 DSS shortened the induction time of methane hydrate by 60 times and that of CO2 hydrate by 2.4 times, while it increased the formation rate by 3.4 times. Due to the weak acidity of the CO2 solution, the effect of DSS on CO2 hydrate formation was significantly reduced. The DSS concentration had a limited effect on changing the rate of the gas storage capacity of the two hydrates. Compared with other surfactants reported in the literature, DSS showed a better promotion effect on hydrate formation. This study reveals the mechanisms of interfacial tension reduction and the promotion of hydrate growth adhering to the wall using a surfactant with a double-chain structure, which further enriched the hydrate-promoting mechanism, and provides experimental data and a theoretical research basis for the study of kinetic characteristics of hydrates in surfactant systems.
1. Induction
Hydrate technology has a great potential in natural gas storage and transportation, CO2 capture and storage, mixed gas separation, seawater desalination and cold storage applications,1–5 which face many obstacles in large-scale industrialization. At present, one of the key problems is achieving the rapid and massive generation of gas hydrates. The utilization of surfactants is promising because the investment cost and energy consumption are far lower than those of other strengthening methods, such as bubbling and spraying.6 It also has the advantages of low dosage and good effectiveness, because of which it has attracted wide attention and become the most commonly used research method.7,8Zhong et al.9 conducted gas hydrate formation experiments in different surfactant systems and found that the surfactants could significantly enhance the automatic separation of the solid–liquid double phase for a continuous reaction. Moreover, the surfactant did not participate in the reaction, but acted more like a catalyzer and was not consumed. The possibility of using surfactants for industrial applications has attracted great attention, especially for their promotion of hydration formation. Zhang et al.10 investigated the effects of different concentrations of SDS on the induction time of methane hydrate. In the pure water system, methane hydrate was not formed within 3 days during the experiment, while in the SDS system under the same conditions, the methane hydrate induction time was less than 14 hours, which clearly indicated that SDS promoted methane hydrate formation. However, in the static systems, the induction time did not change with the variation of SDS concentration. Kang11 studied the growth kinetics of CO2 hydrate in the SDS system and found that when the driving force (subcooling or overpressure) was increased, the gas hydrate formation rate and conversion rate were higher. In addition, inhibition occurred when the SDS concentration was too high (1500 mg L−1), and they believed that particle aggregation might have weakened the mass transfer effect. Ganji et al.12,13 studied the promoting effects of different surfactants on methane hydrate, and the results showed that with an SDS concentration of 500 ppm, the formation rate of methane hydrate increased by 35 times and the gas storage capacity increased by 1 time. Straight-chain alkylbenzene sulfonate (LABS) had the same effect as SDS, and it is believed that the key to the promotion of hydrate formation was to improve gas solubility and the effective gas–liquid contact area. Yoslim et al.14 found that the surfactants changed the hydrate form to porous dendritic crystals, which adhered to the inner wall of the container. The gas consumption for hydrate formation after SDS addition was increased by about 14 times compared with the pure water system, and this increase was related to the more porous hydrate structure. Delroisse et al.15 found that at high concentrations of a water-soluble quaternary ammonium surfactant (DA 50), the lateral growth rate of the hydrate crystal nucleus was only half that in pure water. Okutani et al.16,17 also found that appropriate concentrations of surfactants could promote hydrate nucleation and improve the formation rate, whereas excessive concentrations would inhibit hydrate formation. Sun et al.18 found that dodecyl polyglycoside (DPG) improved the formation rate of hydrate and increased the storage capacity, but the effects were slightly weaker than those of SDS. Zhang et al.19 found that surfactants, such as alkyl polyglycosides (APG), sodium dodecylbenzene sulfonate (SDBS), and potassium oxalate monohydrate (POM), improved the growth rate and gas storage density of hydrate to varying degrees. Common fruits, vegetables, and tea extracts also had a promotion effect on hydrate formation.20–22
Currently, fluorocarbon surfactants, such as SDS, have been widely proven to have a highly effective promotion effect on hydrate formation,23 but most of them come from chemical raw materials. They are expensive, harmful to humans, and pollute the environment and therefore, are not suitable for large-scale use. Finding new promoters with high efficiency, low dosage and environment-friendliness is the key to the effective application of hydrate technology in the industrial fields.24 Therefore, in this paper, green surfactant systems were used for the hydrate formation experiments using a visualization experimental apparatus at constant pressure, and the kinetics and hydrate-promoting mechanism were explored.
2. Experimental research
2.1. Experimental materials and equipment
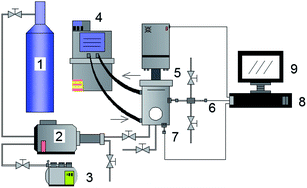
The methane and carbon dioxide with purity ≥99.8% used in this study were manufactured and supplied by Changzhou Jinghua Industrial Gas Co., Ltd.; the deionized water was lab-made; the surfactant dioctyl sulfosuccinate sodium (DSS) with purity ≥96.0% was provided by Shandong Xiya Chemical Industry Co., Ltd.The experimental setup was composed of the hydrate reaction system, gas supply and pressurization system, temperature control system, and data acquisition system. The schematic of the setup is shown in Fig. 1. The piston could be moved downwards to maintain the system pressure in the kettle. Its working principle is shown in Fig. 2. The maximum volume of the kettle was 100 mL, and it could hold liquid up to 50 mL. Besides, with 30 mL liquid injection, the gas–liquid interface could be just observed at the center of the lens, which was beneficial to obtain clear images of the hydrate growth process. The working pressure range was 0–15 MPa, and the working temperature range was −10–30 °C. The temperature sensor in the kettle was a platinum resistance thermometer (Pt100) with a precision of ±0.1 °C. The gas pressure in the autoclave was measured by a pressure sensor with a precision of ±0.01 MPa. The experimental temperature of the reaction kettle was controlled by a water bath with an adjusting precision of ±0.01 °C, for which an antifreeze solution composed of 40% ethylene glycol and 60% distilled water was selected as the coolant.25
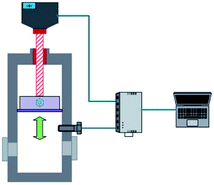 | ||
| Fig. 2 Schematic of the piston in the reactor. The piston can move downwards to maintain the system pressure in the kettle. | ||
2.2. Experimental process
The high-pressure reactor was cleaned and purged with distilled water 3 times to remove the air from the reactor and gas line. Solutions of different concentrations were prepared accordingly and injected into the reactor. A water bath circulation system was used to make sure the reactor reached a certain temperature before the gas was injected into the reactor to the specified pressure. The reactor was maintained at the pressure required for the experiment through the automatic movement control of the piston, and data were recorded through the experiment. The significant changes in temperature and gas-phase volume indicated the initiation of hydration formation, which was exothermic and gas consuming. When the temperature and volume of the reactor reached steady values, the was experiment ended.2.3. Data processing
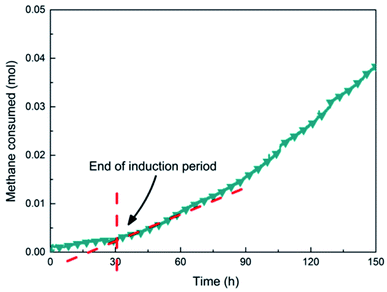
(1) Measurement of induction timeThe induction time was divided into micro-induction time and macro-induction time 26. Micro-induction time was the time needed for the hydrate to form a stable crystal nucleus, but the current technologies have not been able to accurately determine the emergence time of the critical crystal nuclei. Therefore, in this paper, the timing of the system was started from the initial equilibrium state until the first significant temperature rise occurred in the system, that is, the time required for visible hydrate formation, defined as the induction time (macro-induction time).
(2) Calculation of gas storage
Volumetric storage is the most commonly used method to calculate gas storage capacity and is defined as the gas volume stored in per unit volume hydrate under standard conditions,8 and the unit is m3 m−3. In this experiment, the gas consumption could be directly calculated by the reduction of gas in the reactor. The gas storage capacity of the hydrate was expressed as the ratio between the volumes of reduction in the gas phase and hydrate generated under standard conditions.27
 | (1) |
 | (2) |
(3) Hydrate formation rate
The hydrate formation rate is of great importance in both industry and academia. During the growth of hydrates, the gas is densely packed in the hydrate cage, and the growth process is controlled by the internal dynamics of heat/mass transfer. In order to reflect the speed of the hydrate formation reaction under the effect of new promoters more directly and compare the influence of different conditions on the gas consumption rate of hydrate, the average formation rate30 was adopted in this work, which is defined as the ratio of the volume of hydrate generated in a certain period to time and can be expressed as:
 | (3) |
 is the average rate of hydrate formation, mL h−1; VH is the volume of hydrate generated, mL or cm3; Δt is the relative time, h.
3. Results and analysis
3.1. The kinetics of hydrate formation in water–CH4 and water–CO2 systems containing DSS
This experiment involved the control of variables by changing the amount of added DSS, pressure, and subcooling temperature to study the effect of dioctyl sodium sulfosuccinate (DSS) on the growth kinetic characteristics of methane hydrate and CO2 hydrate in a static system, and the internal relationship between the influencing factors and the kinetic parameters were further explored. A total of 16 groups of experiments under different conditions were set up, and each group of the experiment was carried out under constant temperature and pressure, and hydrate index parameters, including induction time, average formation rate, and gas storage, were obtained under various conditions (Table 1).| Experimental gas | Experiment no. | Added amount mg−1 L−1 | Pressure/MPa | Subcooling/°C | Injection volume/mL | Induction time/h | Average hydrate formation rate/mL h−1 | Gas storage/m3 m−3 |
|---|---|---|---|---|---|---|---|---|
| Methane | 1-1 | 0 | 6.00 | 5.5 | 20 | 30.00 | 0.06 | 42.02 |
| 1-2 | 600 | 6.00 | 5.5 | 20 | 0.50 | 25.13 | 45.63 | |
| 1-3 | 900 | 6.00 | 5.5 | 20 | 0.33 | 33.44 | 52.24 | |
| 1-4 | 1200 | 6.00 | 5.5 | 20 | 0.21 | 22.44 | 51.43 | |
| 1-5 | 900 | 4.90 | 5.5 | 20 | 0.77 | 15.25 | 43.10 | |
| 1-6 | 900 | 7.31 | 5.5 | 20 | 0.24 | 41.61 | 46.86 | |
| 1-7 | 900 | 6.00 | 7.5 | 20 | 0.31 | 34.03 | 63.62 | |
| 1-8 | 900 | 6.00 | 3.5 | 20 | 1.27 | 17.20 | 49.28 | |
| Carbon dioxide | 2-1 | 0 | 3.23 | 5.0 | 20 | 7.35 | 0.94 | 48.24 |
| 2-2 | 600 | 3.23 | 5.0 | 20 | 2.20 | 4.10 | 48.28 | |
| 2-3 | 1200 | 3.23 | 5.0 | 20 | 0.51 | 5.32 | 50.67 | |
| 2-4 | 2400 | 3.23 | 5.0 | 20 | 1.17 | 4.60 | 47.53 | |
| 2-5 | 1200 | 2.51 | 5.0 | 20 | 1.27 | 3.69 | 43.45 | |
| 2-6 | 1200 | 4.29 | 5.0 | 20 | 0.18 | 7.14 | 91.59 | |
| 2-7 | 1200 | 3.23 | 7.0 | 20 | 0.28 | 5.78 | 68.39 | |
| 2-8 | 1200 | 3.23 | 3.0 | 20 | 1.16 | 2.24 | 44.07 |
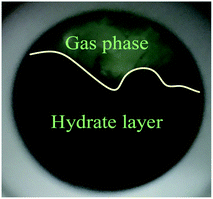
As shown in Fig. 4A, under the effect of increasing concentrations of the promoter (600 mg L−1, 900 mg L−1 and 1200 mg L−1), the gas consumption of the liquid in the reactor increased significantly, but the gas consumption curves at the different concentrations showed a similar trend. At 900 mg L−1 DSS, the curve grew rapidly in the first 0.2 h and then entered a relatively slow growth process between 0.2–1.5 h. In the later period, the curve exhibited a slower growth trend and tended to be steady. This phenomenon occurred because the initial growth of hydrate was mainly controlled by the intrinsic kinetics, and the gas consumption showed a stable and rapid increase; however, as the reaction continued, the hydrate formed a ring and thin layer at the gas–liquid interface31 (as shown in Fig. 5), which reduced the gas–liquid contact area and weakened the mass transfer effect, leading to relatively slow hydration gas consumption. As seen in Fig. 4B, the curves of the CO2 system also had similar trends, but the methane hydrate curves grew more rapidly than those of the systems of CO2 hydrate. This was because the electrolysis of the carbonate ions and bicarbonate ions formed after the contact of CO2 with water made the solution acidic, affecting the hydrate promotion effects of DSS.
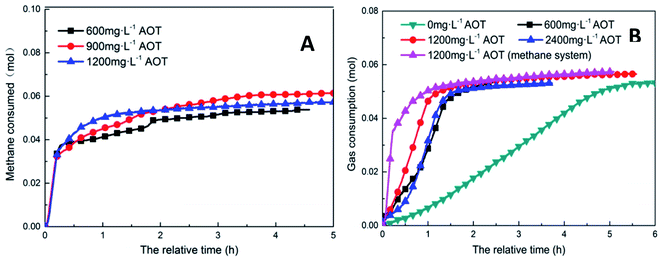 | ||
| Fig. 4 Gas consumption over time at different concentrations of DSS (A: CH4 system. (#1-2, #1-3, #1-4; B: CO2 system. #2-1, #2-2, #2-3, #2-4, # | ||
Fig. 6 shows the trends of the kinetic parameters of methane and CO2 hydrates under different DSS concentrations. From the figures, it is evident that the addition of DSS could promote hydrate formation, and the induction time of methane hydrate formation had shortened from 30 h to 0.50 h, 0.33 h, and 0.21 h at different DSS concentrations, indicating that the hydrates could be formed within 1 h. Compared with 600 mg L−1, the induction time at 1200 mg L−1 was shortened by 58.0%, showing that the concentration itself had a significant effect in promoting hydrate formation. CO2 hydrate had a longer induction time in the pure water system (7.35 h), and the addition of DSS could also significantly shorten the induction time. With the increase in DSS concentration, the induction times obtained were 2.20 h, 0.51 h, and 1.17 h, respectively because the addition of surfactant could reduce the gas–liquid interface tension, the critical nucleation size of the hydrate, as well as the time needed for stable crystal nucleus formation.32 The reduction of liquid surface tension would increase the solubility of gas molecules in the liquid phase, thereby promoting the nucleation of hydrates, which was reflected by the shortened induction time. However, when the amount of DSS added was increased to 2400 mg L−1, the induction time of CO2 hydrate extended to 1.17 h because the excess DSS molecules adsorbed on the hydrate particles inhibited further growth of the particles, reducing the activity of the reactants in the solution.16 Therefore, it was clear that high concentrations of promoters would inhibit the formation of CO2 hydrates.
 | ||
| Fig. 6 The effect of addition amount on the formation of methane hydrate (A: CH4 system. (#1-1, #1-2, #1-3, #1-4; B: CO2 system. #2-1, #2-2, #2-3, # | ||
The addition of DSS enhanced the formation rate of the hydrates. However, with an increase in concentration, the rate started declining after a certain point. At the DSS concentration of 1200 mg L−1 at a low temperature, a large number of hydrates were formed at the gas–liquid interface, which blocked the contact between the gas and liquid and reduced the solubility of methane and mass transfer efficiency. In the CO2 system, when the amount of DSS added was increased to 2400 mg L−1, the formation rate was 4.60 mL h−1, which was a decrease of 13.5% compared with that in the pure water system. Although both systems showed a decrease in the formation rate, the internal mechanisms were completely different. In the CO2 system, excessive DSS molecules were attached to the hydrate particles, which affected the further formation of the hydrate in the liquid and thereby inhibited the rapid formation of CO2 hydrate.33
In the methane system, when the amount of DSS added was increased from 0 mg L−1 to 900 mg L−1, the final gas storage capacity also exhibited an increase of 24.3%. At 1200 mg L−1, the final gas storage capacity was 51.43 m3 m−3, which had slightly reduced by 1.6% compared to that at 900 mg L−1. In the CO2 system, the gas storage capacity at different DSS concentrations were 48.24 m3 m−3, 48.28 m3 m−3, 50.67 m3 m−3, 47.53 m3 m−3, respectively, showing no significant difference. The reason was that DSS, being a kinetic promoter, would change the surface tension, promote the nucleation of gas hydrate and increase the hydrate formation rate but would not change the configuration of the hydrate cage structure.33 Therefore, changing the concentration of DSS did not obviously increase the gas storage capacity of the hydrate. In addition, in the DSS systems with different concentrations, due to the different reaction rates during the formation of the hydrate, the final gas storage capacity at each concentration would be slightly different, which was more obvious in the methane hydrate system.
3.2. The influence of intrinsic kinetic factors on the DSS system
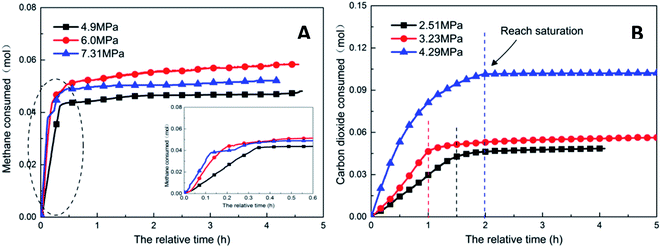 | ||
| Fig. 7 Gas consumption over time at different pressures (A: CH4 system. #1-2, #1-5, #1-6; B: CO2 system. #2-2, #2-5, #2-6). | ||
Pressure negatively correlated with the induction time and positively correlated with the production rate. Fig. 8 shows that the formation rate increased by 93.5%, which indicated that increasing the pressure could significantly promote the rapid formation of the type I hydrate. With the increase in pressure, the amount of gas dissolved in the liquid phase and the nucleation positions of crystals increased, which were conducive to the formation of crystal nuclei. In addition, under higher pressure, the hydrate formed at the gas–liquid interface would become rough with many needle-like branches, which could further strengthen mass transfer. Therefore, after increasing the pressure, the induction time of hydrate decreased, and the formation rate increased continuously.
 | ||
| Fig. 8 Effects of pressure on the formation of methane hydrate (A: CH4 system. #1-2, #1-5, #1-6; B: CO2 system. #2-2, #2-5, #2-6). | ||
As the experimental pressure was increased, the final gas storage capacity of CO2 hydrate raised continuously. When the experimental pressure was 4.29 MPa, the gas storage capacity was 91.59 m3 m−3, which was an increase by 48.14 m3 m−3 compared with that at 2.51 MPa, i.e., an increase of 110.8%. This phenomenon was consistent in the methane hydrate system. However, as seen in Fig. 8A, when the experimental pressure was 7.31 MPa, the gas storage capacity of methane hydrate was 46.86 m3 m−3, showing a decrease by 5.38 m3 m−3 or 10.3% compared with the value at 6.0 MPa.
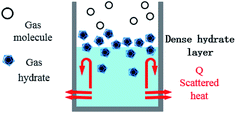
Under high-pressure conditions, methane hydrate formed in the early stage would generate dense layers at the gas–liquid interface,35 affecting the continuous formation of hydrates by reducing the amount of methane hydrate in the static reactor and decreasing the gas storage capacity accordingly. Therefore, higher experimental pressures could increase the driving force for hydrate formation and improve the gas storage capacity of the hydrate. At the same time, it also helped the hydrate to form a dense layer at the gas–liquid interface, which was not conducive to the continuous formation of methane hydrate and reduced the final gas storage capacity. In practical industrial applications, pressure adjustment is needed for a continuous reaction. In addition, in comparison, the gas storage capacity of CO2 hydrate was found to be much higher than that of methane hydrate. This was mainly because CO2 could react with water to promote dissolution; thus, even under similar conditions, CO2 hydrate could still consume more gas. Secondly, the growth process of CO2 hydrate was slow, the reaction time was sufficient, and therefore, the mass transfer effect of the gas in the reactor was moderate and uniform, which was conducive to the increase in the gas storage capacity of CO2 hydrate.
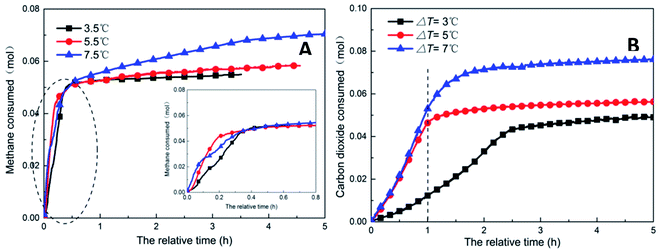 | ||
| Fig. 9 Change of gas consumption with time under different subcooling conditions (A: CH4 system. #1-2, #1-7, #1-8; B: CO2 system. #2-2, #2-7, #2-8). | ||
As shown in Fig. 11, increasing the subcooling temperature reduced the hydrate induction time and increased the hydrate formation rate; when the subcooling temperature exceeded a certain value, this effect was not significant. In this respect, the induction time and formation rate had a similar trend. In the methane system, when the subcooling temperature was increased from 3.5 °C to 5.5 °C, the induction time of methane hydrate shortened by 74.0% from 1.27 h to 0.33 h, and the formation rate increased by 94.4% from 17.20 mL h−1 to 33.44 mL h−1. This was mainly because the reduction in temperature enhanced crystallization in the DSS solution; in other words, the reduction in the free energy in the system made nucleation easier, thereby promoting the rapid formation of the hydrate. When the subcooling temperature was increased from 5.5 °C to 7.5 °C for the same interval, the induction time reduced (from 0.33 h to 0.31 h) only by 7%, and the formation rate increased only by 1.8%. The gas storage capacity of methane hydrate was directly proportional to the subcooling temperature. When the subcooling temperature increased from 3.5 °C to 7.5 °C, the final gas storage capacity also increased from 49.28 m3 m−3 to 63.62 m3 m−3 by 29.1%. This was because, on the one hand, the decrease in the experimental temperature increased the subcooling temperature, which increased the driving force of hydrate formation; on the other hand, the lower temperature led to a greater temperature difference, enhanced heat transfer, and promoted hydrate formation, reflecting as increased gas storage. In the CO2 system, there was a similar trend. When the subcooling temperature increased from 3.0 °C to 7.0 °C, its gas storage capacity also increased by 55.2% from 44.07 m3 m−3 to 68.39 m3 m−3. In addition, the comparison showed that the increase in subcooling temperature had a higher effect on the gas storage capacity of CO2 hydrate than that of methane hydrate, indicating that the change in system temperature had a greater impact on the gas storage behavior of the soluble hydrate.
3.3. Comparative discussion of the gas hydrate formation experiments
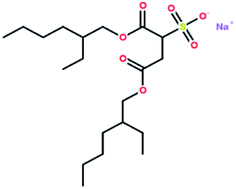
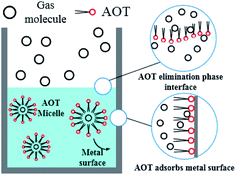
Table 2 shows the results of gas hydrate formation reported by other groups in static systems with the traditional surfactant SDS and some results from this work. It is evident that the gas hydrate induction time in the DSS system was in the range of 0.23–2.2 h, which still indicated a better hydrate-promoting effect compared with traditional surfactants. Each DSS anionic surfactant molecule has a hydrophilic head (sodium sulfonate group) and two hydrophobic tails (dioctyl dibutyrate carbon chain), and the molecular structure is shown in Fig. 12. This structure makes DSS amphiphilic and suitable to be arranged directionally at the gas–liquid interface. The hydrophilic DSS head faces the liquid phase, while the two hydrophobic tails remain pointed to the gas phase, as shown in Fig. 13. Since both the hydrophobic group of DSS and the gas molecules are non-polar, the distribution of the gas molecules would be more towards the tail of the hydrophobic group. In addition, since DSS is amphiphilic, the gas molecules would enter the solution through the longitudinal gap between the DSS molecules, making it easier for the water-insoluble gas to pass through the two-phase interface into the solution. Therefore, DSS showed excellent performance as a surfactant toward increasing the gas solubility, and these structural properties were conducive to promoting the formation of hydrates.37,38| Experimental materials | Pressure/MPa | Temperature/°C | Added amount/mg L−1 | Induction time/h | Gas storage/m3 m−3 |
|---|---|---|---|---|---|
| SDS + CH4 (ref. 10) | 7.0 | 0.85 | 1150 | 1.21 | 95.57 |
| SDS + CH4 (ref. 17) | 3.9 | 1.85 | 1000 | 0.40 | 154.7 |
| DSS + CH4 (#1-7) | 6.0 | 1.0 | 900 | 0.31 | 63.62 |
| DSS + CH4 (#1-5) | 4.9 | 1.0 | 900 | 0.77 | 43.10 |
| water + CH4 (#1-1) | 6.0 | 3.0 | 0 | ≅30 | 42.02 |
| SDS + CO2 (ref. 36) | 4.0 | 4.85 | 300 | ≅0.09 | — |
| SDS + CO2 (ref. 11) | 3.0 | 2.05 | 100 | 1.67 | — |
| DSS + CO2 (#2-6) | 4.29 | 5.0 | 1200 | 0.18 | 91.59 |
| DSS + CO2 (#2-3) | 3.23 | 3.0 | 1200 | 0.51 | 50.67 |
| water + CO2 (#2-1) | 3.23 | 3.0 | 0 | ≅7.35 | 48.24 |
| SDS + CH4 (additional #1) | 5.5 | 3.0 | 1000 | 0.45 | 74.79 |
| SDS + CH4 (additional #2) | 7.5 | 3.0 | 1000 | 0.25 | 61.88 |
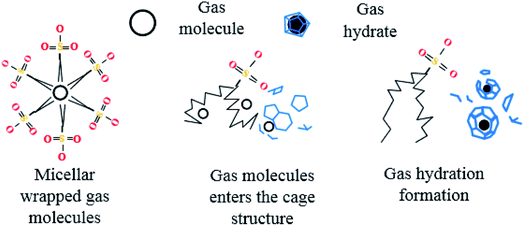
After entering the solution, the gas molecules are wrapped by multiple DSS hydrophobic tails to form micelles.39 Since the outside of the micelles have hydrophilic groups with a negative charge, the whole micelles would move towards the positively charged metal wall, adsorb on the inner wall surface and be arranged directionally,10 as shown in Fig. 13. After the gas molecules are separated from the micelles, they would combine with the cage grids formed near the water molecules and finally form gas hydrates near the metal walls. The whole process is shown in Fig. 14.
In pure water, the hydrate crystals aggregated together due to hydrogen bonding, thus reducing the number of hydrate crystals, which was not conducive to the formation of a large number of hydrate crystals. In the DSS system, there were many free hydrogen atoms on the side chains of the hydrate crystals that preferentially combined with the DSS hydrophilic groups to form hydrogen bonds, while the hydrophobic group tails pointing toward the solution formed a hydrophobic circle between the hydrate crystal and the solution, which facilitated more guest molecules to contact the cage crystals and promoted the nucleation and growth of the hydrate.40 Then, the hydrophobic tails on the surface of the hydrate crystals and solution combine with each other to form a structure similar to that formed by double-layer adsorption. This structure reduces adhesion between the hydrate crystals, increases contact between the hydrate crystals and water molecules, and further promotes the formation of hydrates.41
4. Conclusions
(1) The addition of 600 mg L−1 DSS reduced the induction time of methane hydrate by 60 times and the induction time of CO2 hydrate by 2.4 times. Firstly, an appropriate amount of DSS could speed up the entire hydrate formation process, and its promotion effect on the formation of insoluble methane hydrate was more obvious. On the other hand, an excessive DSS concentration had an inhibitory effect on CO2 hydrate. Secondly, the presence of acidic gas (CO2) reduced the activity of DSS and weakened the promotion effect on the soluble carbon dioxide hydrate formation. By comparing the gas storage capacity of the two gas hydrates under similar conditions, it was found that carbon dioxide hydrate was easier to generate and had a gas storage capacity higher than that of methane hydrate. In addition, changes in system temperature had a great influence on the gas storage capacity of the soluble hydrate.(2) Increasing the driving force (subcooling or overpressure level) shortened the induction time of hydrate formation and accelerated the formation rate. When the subcooling temperature exceeded a certain value, this effect was not significant. In this respect, the induction time and generation rate had a similar trend. Excessive pressure also reduced the amount of hydrate. Therefore, multiple factors can be integrated toward promoting the hydrate formation reaction in a static system. These findings are of practical significance in guiding the industrial mass production of hydrates.
(3) Through comparative analysis, it was found that the surfactant DSS had a good promoting effect on hydrate formation. DSS is pollution-free and harmless and can be completely degraded naturally. In addition, the mechanism of DSS was analyzed at the micro-level, further enriching our understanding of this surfactant. Chemical strengthening is the main research direction to promote the formation of hydrates. New environment-friendly surfactants with high efficiency at low dosage are key to the industrialization of hydrate technology.
Conflicts of interest
There are no conflicts to declare.Acknowledgements
This work was supported by the National Natural Science Foundation of China (Grant No. 51804046, 52004039 & 51974037), China Postdoctoral Science Foundation (Grant No. 2021M693908), the major project of universities affiliated to Jiangsu Province Basic Science (Natural Science) Research (Grant No. 21KJA440001), Jiangsu Qinglan Project, Postgraduate Research & Practice Innovation Program of Jiangsu Province (Grant No. SJCX21_1210).References
- H. P. Veluswamy, A. Kumar and Y. Seo, et al., A review of solidified natural gas (SNG) technology for gas storage via clathrate hydrates, Appl. Energy, 2018, 216, 262–285 CrossRef CAS.
- Y. Chen, Y. H. Gao and Y. P. Zhao, et al., Experimental investigation of different factors influencing the replacement efficiency of CO2 for methane hydrate, Appl. Energy, 2018, 228, 309–316 CrossRef CAS.
- B. Partoon, K. M. Sabil and K. K. Lau, et al., Production of gas hydrate in a semi-batch spray reactor process as a means for separation of carbon dioxide from methane, Chem. Eng. Res. Des., 2018, 138, 168–175 CrossRef CAS.
- A. Parker, Potable water from sea-water, Nature, 1942, 149, 184–186 CrossRef CAS.
- Q. Sun, S. Kim and Y. T. Kang, Study on dissociation characteristics of CO2 hydrate with THF for cooling application, Appl. Energy, 2017, 190, 249–256 CrossRef CAS.
- D. L. Zhong, S. Y. He and D. J. Sun, et al., Comparison of methane hydrate formation in stirred reactor and porous media in the presence of SDS, Energy Procedia, 2014, 61, 1573–1576 CrossRef CAS.
- J. Verrett, D. Posteraro and P. Servio, Surfactant effects on methane solubility and mole fraction during hydrate growth, Chem. Eng. Sci., 2012, 84, 80–84 CrossRef CAS.
- H. Najibi, M. M. Shayegan and H. Heidary, Experimental investigation of methane hydrate formation in the presence of copper oxide nanoparticles and SDS, J. Nat. Gas Sci. Eng., 2015, 23, 315–323 CrossRef CAS.
- Y. Zhong and R. E. Rogers, Surfactant effect on gas hydrate formation, Chem. Eng. Sci., 2000, 55, 4175–4187 CrossRef CAS.
- J. S. Zhang, S. Lee and W. J. Lee, Kinetics of methane hydrate formation from SDS solution, Ind. Eng. Chem. Res., 2007, 46(19), 6353–6359 CrossRef CAS.
- S. P. Kang and J. W. Lee, Kinetic Behaviors of CO2 Hydrates in Porous Media and Effect of Kinetic Promoter on the Formation Kinetics, Chem. Eng. Sci., 2010, 65(5), 1840–1845 CrossRef CAS.
- H. Ganji, M. Manteghian and M. R. Omidkhah, et al., Effect of different surfactants on methane hydrate formation rate, stability and storage capacity, Fuel, 2007, 86(3), 434–441 CrossRef CAS.
- H. Ganji, M. Manteghian and H. R. Mofrad, Effect of mixed compounds on methane hydrate formation and dissociation rates and storage capacity, Fuel Process. Technol., 2007, 88(9), 891–895 CrossRef CAS.
- J. Yoslim, P. Linga and P. Englezos, Enhanced growth of methane-propane clathrate hydrate crystals with sodium dodecyl sulfate, sodium tetradecyl sulfat, and sodium hexadecyl sulfate surfactants, J. Cryst. Growth, 2010, 313(1), 68–80 CrossRef CAS.
- H. Delroisse, J. P. Torre and C. Dicharry, Effect of a hydrophilic cationic surfactant on cyclopentane hydrate crystal growth at the water/cyclopentane interfacel, Cryst. Growth Des., 2017, 17, 5098–5107 CrossRef CAS.
- C. Y. Sun, G. J. Chen and C. F. Ma, et al., The growth kinetics of hydrate film on the surface of gas bubble suspended in water or aqueous surfactant solution, J. Cryst. Growth, 2007, 306(2), 491–499 CrossRef CAS.
- K. Okutani, Y. Kuwabara and Y. H. Mori, Surfactant effects on hydrate formation in an unstirred gas/liquid system: an experimental study using methane and sodium alkyl sulfates, Chem. Eng. Sci., 2008, 63(1), 183–194 CrossRef CAS.
- Z. G. Sun, R. S. Ma and R. Z. Wang, et al., Experimental studying of additives effects on gas storage in hydrates, Energy Fuels, 2003, 17, 1180–1185 CrossRef CAS.
- C. Zhang, S. Fan and D. Liang, et al., Effect of additives on formation of natural gas hydrate, Fuel, 2004, 83(16), 2115–2121 CrossRef CAS.
- W. Wang, Z. Huang and H. Chen, et al., Methane hydrates with a high capacity and a high formation rate promoted by biosufactants, Chem. Commun., 2012, 48(95), 11638–11640 RSC.
- W. Wang, C. Ma and P. Lin, et al., Gas storage in renewable bioclathrates, Energy Environ. Sci., 2013, 6(1), 105–107 RSC.
- W. Wang, P. Zeng and X. Long, et al., Methane storage in tea clathrates, Chem. Commun., 2014, 50(10), 1244–1246 RSC.
- D. D. Link, E. P. Lader and H. A. Elsen, et al., Formation and dissociation studies for optimizing the uptake of methane by methane hydrates, Fluid Phase Equilib., 2003, 211(1), 1–10 CrossRef CAS.
- J. Chen, T. Wang and Z. Zeng, et al., Oleic acid potassium soap: a new potential kinetic promoter for methane hydrate formation, Chem. Eng. J., 2019, 363, 349–355 CrossRef CAS.
- X. F. Lv, D. Y. Lu and Y. Liu, et al., Study on Methane Hydrate Formation in Gas-water Systems with the New Compound Promoter, RSC Adv., 2019, 9, 33506–33518 RSC.
- Y. X. Pan, D. P. Liu and W. J. Huang, et al., The induction time and the affected factors in gas hydrate formation, Nat. Gas Geosci., 2005, 16(2), 255–260 Search PubMed.
- A. Melchuna, A. Cameirao and J. M. Herri, et al., Topological modeling of methane hydrate crystallization from low to high water cut emulsion systems, Fluid Phase Equilib., 2015, 413, 158–169 CrossRef.
- S. A. Naghibzade, H. Kahrizi and A. S. Mehr, Comparison of different equations of state in a model based on VdW-P for prediction of CO2, hydrate formation pressure in Lw-H-V phase and a new correlation to degrade error of the model, J. Nat. Gas Sci. Eng., 2015, 22(6), 292–298 CrossRef CAS.
- V. R. Avula, R. L. Gardas and J. S. Sangwai, An improved model for the phase equilibrium of methane hydrate inhibition in the presence of ionic liquids, Fluid Phase Equilib., 2014, 382, 187–196 CrossRef CAS.
- Y. C. Chen, B. H. Shi and Y. Liu, et al., Experimental and Theoretical Investigation of the Interaction between Hydrate Formation and Wax Precipitation in Water-in-Oil Emulsions, Energy Fuels, 2018, 32(9), 9081–9092 CrossRef CAS.
- L. A. Sten, S. H. Kirby and W. B. Durham, Peculiarities of Methane Clathrate Hydrate Formation and Solid-State Deformation, Including Possible Superheating of Water Ice, Science, 1996, 273(5283), 1843–1848 CrossRef.
- P. Englezos, N. Kalogerakis and P. D. Dholabhai, et al., Kinetics of formation of methane and ethane gas hydrates, Chem. Eng. Sci., 1987, 42(87), 2647–2658 CrossRef CAS.
- H. P. Veluswamy, J. Y. Chen and P. Linga, Surfactant effect on the kinetics of mixed hydrogen/propane hydrate formation for hydrogenstorage as clathrates, Chem. Eng. Sci., 2015, 126(4), 488–499 CrossRef CAS.
- M. Ricaurte, C. Dicharry and X. Renaud, et al., Combination of surfactants an d org anic compounds for boosting CO2 separation from natural gas by clathrate hydrate formation, Fuel, 2014, 122, 206–217 CrossRef CAS.
- A. Mohammadi, M. Manteghian and A. Haghtalab, et al., Kinetic study of carbon dioxide hydrate formation in presence of silver nanoparticles and SDS, Chem. Eng. J., 2014, 237(1), 387–395 CrossRef CAS.
- Y. X. Li, C. Zhu and W. C. Wang, Promoting Effects of Surfactants on Carbon Dioxide Hydrate Formation and the Kinetics, Petrochem. Technol., 2012, 041(006), 699–703 CAS.
- R. Zana, H. Levy and D. Papoutsi, et al., Micellization of two triquaternary ammonium surfactants in aqueous solution, Langmuir, 1995, 11(10), 3694–3698 CrossRef CAS.
- Y. P. Zhu, A. Masuyama and Y. I. Kirito, et al., Preparation and properties of glycerol-based double-or triple-chain surfactants with two hydrophilic ionic groups, J. Am. Oil Chem. Soc., 1992, 69(7), 626–632 CrossRef CAS.
- R. M. J. Geminis, A new generation of surfactants : These materials have better properties than conventional ionic surfactants as well as positive synergistic effects with non-ionics, CHEMTECH, 1993, 23(3), 30–33 Search PubMed.
- C. Lo, J. S. Zhang and P. Somasundaran, et al., Adsorption of Surfactants on Two Different Hydrates, Langmuir, 2008, 24(22), 12723–12726 CrossRef CAS PubMed.
- C. Lo, J. S. Zhang and A. Couzis, et al., Adsorption of cationic and anionic surfactants on cyclopentane hydrates, J. Phys. Chem. C ., 2010, 114(31), 13385–13389 CrossRef CAS.
| This journal is © The Royal Society of Chemistry 2021 |

