 Open Access Article
Study of the structural, electronic, magnetic and magnetocaloric properties of La0.5Ca0.5Mn0.9V0.1O3 sample: first-principles calculation (DFT–MFT)
A. Mabrouki a,
O. Messaoudib,
M. Mansouric,
S. Elgharbid and
A. Bardaouie
aLaboratory of Applied Physics, Faculty of Sciences of Sfax, University of Sfax, B.P. 1171, 3000 Sfax, Tunisia. E-mail: mabroukiala1993@gmail.com
bPhysics Department, College of Sciences, University of Ha'il, Ha'il, Saudi Arabia
cDigital Research Center of Sfax, LT2S Lab (LR16 CRNS 01), Technopark. Cité El Ons, BP. 275, 3021, Sfax, Tunisia
dChemistry Department, College of Sciences, University of Ha'il, Saudi Arabia
eLaboratory of Nanomaterials and Systems for Renewable Energy, Research and Technology Center of Energy, Hammam Lif, Tunisia
First published on 24th November 2021
Abstract
This paper presents a correlation between experimental and theoretical approaches to study the structural, electronic, magnetic, and magnetocaloric properties of La0.5Ca0.5Mn0.9V0.1O3. The studied compound crystallizes in the Pbnm orthorhombic space group. The calculated DOS using the DFT + U method proves that La0.5Ca0.5Mn0.9V0.1O3 sample exhibits semi-metallic behavior, which is preferred in spintronic applications. The calculated PDOS proves that the high hydration among Mn 3d, V 3d and O 2p at the Fermi energy level is responsible for the FM behavior of La0.5Ca0.5Mn0.9V0.1O3. The magnetic moment has been calculated using DFT results by estimating the valence electron population. The optical properties show high light absorption in the UV region. By using the Bean–Rodbell method, the magnetic phase shows a second-order transition where η = 0.85, and the exchange parameter λ is found to be 1.19 T g−1 emu−1. Based on the mean-field theory, the saturation magnetization (M0), the Landé factor (g), and the total angular momentum (J) were determined. These parameters were used to simulate magnetization as a function of the magnetic field at different temperatures as well as the variation of the magnetic entropy change ΔSM (T).
1. Introduction
Manganites have been used as promising candidates for different technologies, such as sensors, magnetic storage media, magnetic refrigeration and photocatalysis, owing to their diverse and interesting properties.1–4 Among the different families of manganites, the (LaCa)MnO3 system has attracted much interest, since it presents a high-temperature colossal magneto-resistance (CMR) effect and metal–insulator transition (MI).5,6 The coupling between the charge, spin, orbit, and distorted lattice is the origin of its special properties. The double exchange (DE) effect is responsible for the ferromagnetic (metallic behavior)/paramagnetic (insulator) behavior,7 where Mn ions transfer electrons through the middle oxygen ions to change their valence.Manganites are known for their potential magnetocaloric effect (MCE) and their use as refrigerants for magnetic refrigeration applications, which replace the conventional refrigeration based on the compression and expansion of toxic gases such as CFC and HCFC. The investigation of green refrigerants is of great interest, and different parameters should be defined and optimized for such magnetocaloric materials. The magnetic entropy change, adiabatic temperature change, and relative cooling power (RCP) are key parameters that could define a good magnetic refrigerant and its performance.
Many researchers have investigated the first-principles calculations to study the electronic structure and the magnetic and magnetocaloric properties.8,9 A better concordance has been obtained between theoretical and experimental properties of manganites using the SGGA + U method.3,9–12
Phenomenological theories have been developed to study the performance of different magnetocaloric materials.12 Mean-field theory13–15 has been used in the study of magnetic materials.11 Amaral et al. have developed a scaling method based on this model,15 and have shown that the exchange parameter (λ), the total angular momentum (J), the gyromagnetic factor (g), and the saturation magnetization (M0) can simulate the magnetic isotherms M (H, T), thus simulating the variation of the magnetic entropy (−ΔSM(T)) by utilizing the Bean–Rodbell model.16
In this work, the structural, electronic, optical, and magnetic properties of the La0.5Ca0.5Mn0.9V0.1O3 compound are investigated. The novelty of the current work includes two important aspects: first, the electronic, optical and magnetic properties of the La0.5Ca0.5Mn0.9V0.1O3 sample were studied for the first time using DFT calculations and mean-field theory; second, a correlation among the DFT results, mean-field theory, and the experimental results has been performed.
2. Experimental details
The La0.5Ca0.5Mn0.9V0.1O3 sample was prepared using a solid-state reaction.17 High purity powders (99.9%) of La2O3, CaCO3, V2O5, and MnO2 were mixed in stoichiometric proportions, and the obtained mixture was heated at 800 °C for 12 h. The as-obtained powder was then pressed into pellets of 13 mm diameter and 2 mm thickness and sintered at 1150 °C for 24 h. The final sintering was performed at 1400 °C for 8 h after the regrinding and pelleting processes. The structural properties were determined using the X-ray diffraction method and have been well studied in a previous work.17 Magnetic measurements were realized using a Vibrating Sample Magnetometer.3. Theoretical considerations
3.1. Ab initio calculation details
DFT calculations were performed using the hybrid spin polarized generalized gradient approximation (SGGA(PBE) + U). Due to the high Coulombian interaction behavior between 3d electrons in the Mn ion,3,18 the orbital-dependent potential (Hubbard U) Ueff = U − J = 4.0 eV was included. This value has been optimized by other researchers.19–21 The calculation was affected via the hybrid full-potential FP L/APW + lo method implemented in the Wien2k package.22 The spin–orbit coupling effect was not included in the calculation because it had little effect in this case. We chose 500 K points in the irreducible Brillouin zone, which corresponded to a 11 × 11 × 3 grid mesh. The convergence of the self-consistent cycles (SCF) was considered when the energy and charge difference between them was 10−4 eV.3.2. Mean-field theory (MFT)
Based on the MFT, for a ferromagnetic material the magnetization can be simulated using the Brillouin functions Bj(x) by the following equation:15,16
 | (1) |
 | (2) |
 , J = |L ± S| as the total angular momentum and
  as the Lande factor, where L is the orbital momentum and S is the spin momentum.
The exchange mean field Hexch (Weiss field) is linked to magnetization by the following relation:
 | (3) |
The magnetic entropy change is determined using Maxwell relations:
 | (4) |
Based on the MFT, ΔSM can be simulated by the following formula:
 | (5) |
Using the Bean–Rodbell method, the magnetic transition order is determined by the parameter η, which is linked to the compressibility K, the total momentum J, and the spin density N by this relation:16
 | (6) |
This model assumes a linear variation of the system's Curie temperature (TC) on a relative volume (v) change (with a proportionality factor β) in the following way:23
| TC = T0[1 + βω] | (7) |
 presents the cell deformation, and ν and v0 present the cell volume and the equilibrium volume obtained in the absence of magnetic interaction, respectively.13,16,24 T0 is the Curie temperature of the incompressible system.
4. Results
4.1. Structural properties
The La0.5Ca0.5Mn0.9V0.1O3 sample crystallized in the orthorhombic structure with a Pbnm space group.17 To investigate the electronic properties and to clearly understand the origin of the magnetic and optical properties of this compound, a DFT calculation was adopted.Firstly, we adopted the structural parameters of orthorhombic LaMnO3.25 Then, a 1 × 1 × 5 supercell containing 20 atoms of La, 20 atoms of Mn and 60 atoms of oxygen was created. To modulate the La0.5Ca0.5Mn0.9V0.1O3 sample, 10 La atoms were replaced with 10 Ca atoms and two Mn atoms with V atoms (Fig. 1a). The structure was then optimized and all atomic positions were relaxed.
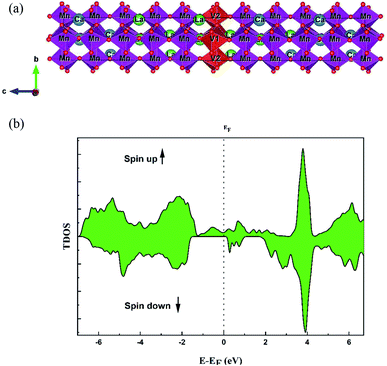 | ||
| Fig. 1 (a) The super cell representation of the La0.5Ca0.5Mn0.9V0.1O3 sample adopted for the DFT calculation. (b) The calculated total DOS of the La0.5Ca0.5Mn0.9V0.1O3 sample. | ||
Generally, the structure of perovskite materials can be distorted when it is doped with larger or smaller ions. To evaluate the stability of La0.5Ca0.5Mn0.9V0.1O3 sample, the Goldschmidt tolerance factor (t),  26,27 was calculated, where 〈RA〉 and 〈RB〉 are the average cation ionic radii of A and B, respectively, and 〈RX〉 is the anion radius. The ionic radius of the elements was obtained from the Shannon table.28
The perovskite structures are stable when the value of the tolerance factor is 0.75 < t < 1.06.26,27 The structure is cubic if 0.99 < t < 1.06, rhombohedral if 0.96 < t < 0.99 and orthorhombic if 0.76 < t < 0.96.26,27
According to this definition, the calculated value of the tolerance factor for La0.5Ca0.5Mn0.9V0.1O3 sample is t = 0.918, indicating an orthorhombic distortion for the sample, which is consistent with the XRD experimental result.
Table 1 depicts the experimental and theoretical structural parameters. A good accordance between the theoretical and the experimental values was noted.
| a (Å) | b (Å) | c (Å) | 〈Mn–O〉 (Å) | 〈Mn–O–Mn〉 (°) | |
|---|---|---|---|---|---|
| Experimental | 5.4442 | 5.4568 | 7.6870 | 1.9936 | 160.4132 |
| DFT + U | 4.4803 | 5.4929 | 7.7379 | 1.99425 | 158.2266 |
4.2. Electronic properties
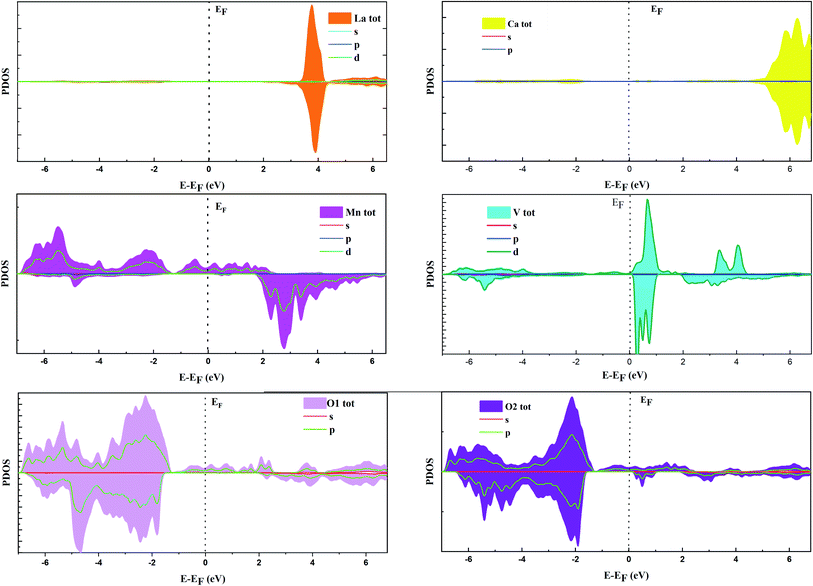
Fig. 1 shows the total electronic density states (TDOS), which proves that the La0.5Ca0.5Mn0.9V0.1O3 material presents a metallic behavior for the spin up state, while the material comportment in spin-down states is a semiconductor. The coexistence of these two behaviors proves the semi-metal comportment; consequently, this compound can be a good candidate for electronic applications. The non-symmetry of the total DOS indicates the ferromagnetic character of the compound. The calculated total magnetic moment is 3 μB.It is shown in Fig. 1b and 2 that, below −4 eV and above 3 eV, the electron energy states are composed of the La 3d, Ca 2p, and O 2p states. Remarkably, near the Fermi energy (EF) level for spin-up, the electron energy states are composed of O 2p, Mn 3d, and V 3d. The strong hybridization at the EF level between these orbitals indicates a stronger covalent interaction between Mn/V and O ions, which is responsible for the metallic behavior.
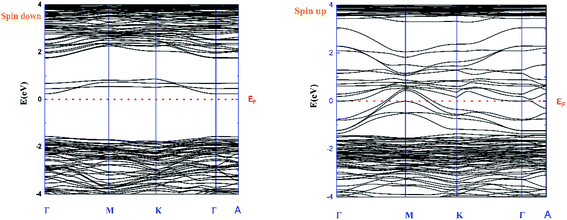
Fig. 3 shows the band structure in both cases “spin-up and -down”. It can be seen from the spin-down case that the compound is a semiconductor type n with a bandgap Eg = 1.8 eV. By correlating between the band structure and the calculated DOS, it can be concluded that this bandgap value is related to the electron density state for V 3d, Mn 3d and, O 2p.
4.3. Optical properties
In order to study the optical properties of the La0.5Ca0.5Mn0.9V0.1O3 sample, the Kramer–Kronig relation was used. In the field of linear optics, all optical parameters are described using the dielectric functions ε1 and ε2.3,29,30| ε(ω) = ε1(ω) + iε2(ω) | (8) |
The variation of the real dielectric constant as a function of photon energy is depicted in Fig. 4a. It is shown that the static real dielectric constant ε1 (0) presents a high value ε1 (0) = 19.27, which corresponds to the plasmon resonance.3 Then, ε1 dramatically decreases to reach a minimum of ε1 = 3.73 at 0.87 eV, which may be related to the metallic character for the spin-up states and the ferroelectric nature of the perovskite.3 From E = 7 eV, ε1 (ω) starts to decrease again to a negative value at 7.8 eV, indicating that, beyond this energy value, the incident radiation is completely reflected by the surface.3,28–32 Fig. 4b shows the variation of ε2 (ω) vs. the photon energy. The existence of four dielectric peaks P1, P2, P3 and P4 was noticed which agree with the photon energy values of 0.62 eV, 2.85 eV, 6.5 eV, and 8.16 eV.
 | ||
| Fig. 4 Optical proprieties: (a) the real dielectric constants ε1 (ω), (b) the imaginary dielectric constants ε2 (ω), (c) the absorption coefficient α (ω), and (d) the optical conductivity. | ||
According to the DOS results, the P1 and P2 dielectric peaks are related to the electronic transition between the top of the valence band and the bottom of the conduction band. The transition electrons come mainly from the electrons of Mn 3d, V 3d, and O 2p. However, the other peaks come mainly from the electronic transition between the La 5p, Ca 2p and O 2s orbitals.
The absorption coefficient was calculated directly using the following relation:
 | (9) |
Fig. 4c and d show the variation of the absorption coefficient and the optical conductivity as a function of the photon energy, respectively. The La0.5Ca0.5Mn0.9V0.1O3 compound has a high light absorption in the UV region. In fact, the charge carriers available in the material absorb the energy of photons/phonons; therefore, a significant increase in optical conductivity occurs.
4.4. Magnetic properties
The magnetic and magnetocaloric properties of the La0.5Ca0.5Mn0.9V0.1O3 sample were investigated in detail.17 The study showed that the present compound exhibits a second order magnetic transition from a FM phase to a PM phase when the temperature increases. The Curie temperature, TC1 is found to be 228 K.17By correlating the magnetic phase transition with the electronic properties, it can be concluded that, in the ordered phase (FM), the properties of the studied material are essentially described by the behavior of the spin-up states, in which the materials have a metallic behavior, whereas, in the disordered phase (PM), the material has a semiconductor behavior that is related to the behavior of the spin-down states.
Based on the available DOS results, the population of the 2p and 3d bands can be estimated. Consequently, the valence electron numbers can be computed by the integration of DOS. The difference between the numbers of spin-up and spin-down states leads to calculate the spin magnetic moment based on the following equations:33
 | (10) |
 | (11) |
Then, the magnetic moment is given by:33
| m = g·S·μB = (Nval↑ − Nval↓)μB | (12) |
The magnetization of saturation per molecule formula was found to be 3.05214 μB, which corresponds to 88.767 emu. The obtained results are summarized in Table 2.
| MS (μB) | MS (emu) | m Mn (μB) | m V (μB) | |
|---|---|---|---|---|
| DFT | 3.05214 | 88.767 | 3.3724 | 0.1698 |
To simulate the magnetization isotherms and ΔS curves, a new method based on MFT has been developed by Amaral et al.15,24 This method determines the total momentum J and focuses on the saturation magnetization MS by adjusting the scaling plot curves of magnetization (M versus  ) using eqn (1).
To determine the Hexch values, the variation of μ0H/T was firstly plotted as a function of 1/T with a constant value of magnetization equal to 5 emu g−1, as shown in Fig. 5.
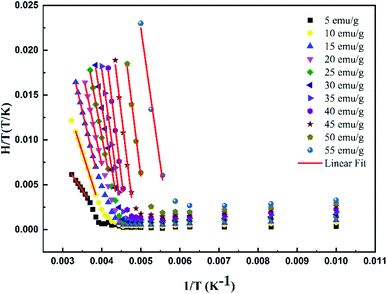 | ||
| Fig. 5 Variation of H/T vs. 1/T curves with constant values of magnetization for the La0.5Ca0.5Mn0.9V0.1O3 sample. | ||
According to eqn (4), a linear fit applied in the PM region allowed the determination of the Hexch values (slope of each curve). Fig. 6 presents the variation of Hexch as a function of magnetization M adjusted by the following equation:
| Hexch = λ1M + λ3M3 | (13) |
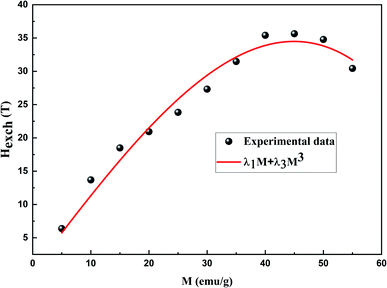 | ||
| Fig. 6 Exchange field dependence of magnetization for the La0.5Ca0.5Mn0.9V0.1O3 sample. Red line represents the fit by the equation Hexch = λ1M + λ3M3. | ||
It is found that λ1 and λ3 are equal to 1.344 T g−1 emu−1 and −1.8987 × 10⁻⁴ T g−3 emu−3, respectively.
In comparison to λ3, the λ1 value is extremely high. For this reason, λ3 was diregarded. Consequently, the exchange field can be written as follows:
| Hexch = λ1M ≈ λM | (14) |
Then, using a scaling plot, M vs. (H + Hexch)/T was plotted, as shown in Fig. 7. It is remarked that all magnetization isotherms are reduced in a single curve, which has been adjusted using eqn (1) under the MATLAB software to extract the experimental MS, J, and g values.15,34 The obtained values are summarized in Table 3.
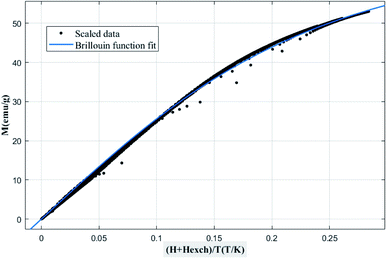 | ||
| Fig. 7 Scaled data in magnetization vs. (H + Hexch)/T and the Brillouin function fit for the La0.5Ca0.5Mn0.9V0.1O3 compound. | ||
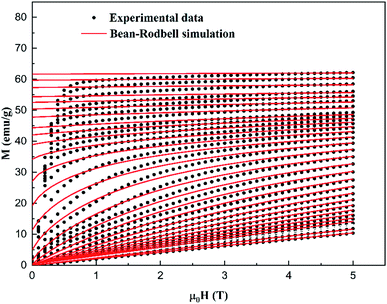 | ||
| Fig. 8 Experimental (symbols) and simulated (red lines) magnetization M vs. μ0H of the La0.5Ca0.5Mn0.9V0.1O3 sample. | ||
According to the neutrality formula and Hund rules, the developed formula of the studied material is given as La0.53+Ca0.52+Mn0.6+3+Mn0.3+4V0.1+5O32−. Due to the effect of the crystal field, for transition metals, the orbital moment (L) is blocked (L = 0).34 Only the spin moments of ions of manganese (Mn3+, Mn4+) are responsible for the magnetism in the compound. Therefore, the total moment J was calculated as J = 0.6 S(Mn3+) + 0.3 S(Mn4+) + 0.1 S(V5+) = 1.65, and the Lande factor was
| g = 0.6g(Mn3+) + 0.3g(Mn4+) + 0.1g(V4+) = 1.9 |
The large difference between the theoretical and adjusted J value (Table 3) can probably be attributed to the presence of magnetic spin clustering as a result of the presence of another magnetic phase.35 This phase was detected using dM/dT, which corresponds to another FM/PM phase transition at TC2 = 263 K. The extracted MS, J, and g values (Table 3) were then used to modulate the M (H, T) and −ΔSM curves (Fig. 8 and 9) using the MFSS software running the MATLAB program.
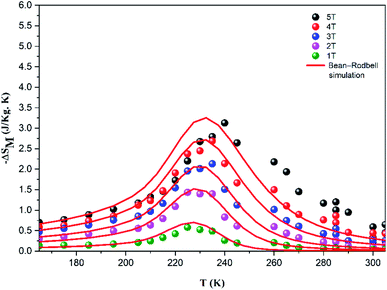 | ||
| Fig. 9 Experimental (symbol) and theoretical (red line) magnetic entropy change versus temperature under different magnetic fields. | ||
It can be seen in Fig. 8 that, below TC, the magnetization rapidly reaches saturation. In fact, a small applied magnetic field arranges the Weiss domains in their direction. Meanwhile, below TC, the magnetization becomes increasingly linear, and the material enters the PM state. This phenomenon is responsible for the interesting magnetocaloric properties seen in this type of material. The good agreement between the experimental and the simulated curves proves the pertinence of the employed model for the prediction of the magnetocaloric properties of La0.5Ca0.5Mn0.9V0.1O3 sample.
| Sample | Method | J | g | M0 (emu g−1) | T0 | λ (T g−1 emu−1) | η |
|---|---|---|---|---|---|---|---|
| La0.5Ca0.5Mn0.9V0.1O3 | Theoretical values | 1.65 | 1.9 | 228 | |||
| Adjusted values | 5.6 | 2.0023 | 65.5 | 228 | 1.344 | 0.85 |
However, at lower fields, a difference between the experimental and simulated data which could be attributed to the magnetic, anisotropy, and demagnetization effects, which were not accounted for in this model.36–38
5. Conclusion
In summary, the La0.5Ca0.5Mn0.9V0.1O3 sample was prepared by a solid-state reaction. The structural studies show that our material crystallized in the orthorhombic Pbnm phase. To better understand the origin of the physical properties of La0.5Ca0.5Mn0.9V0.1O3, the theoretical approaches DFT and MFT were used. The calculated TDOS proved the coexistence of metallic and p-type semiconductor behaviors for the spin-up and spin-down states, respectively. Therefore, the material La0.5Ca0.5Mn0.9V0.1O3 can be a good candidate for electronic applications. By estimating the valence electron population, the magnetization of saturation at 0 K was calculated, which equaled 3.05214 μB. The magnetic and magnetocaloric properties were investigated using MFT. Firstly, the application of the scaling method on the experimental magnetization data allowed the estimation of the values of the saturation magnetization M0, the exchange parameters λ, J, and g. Then, these factors were used to modulate the magnetization isotherms and the variation of the magnetic entropy. The Bean–Rodbell model confirmed that the La0.5Ca0.5Mn0.9V0.1O3 sample presented a second order magnetic phase transition with η parameter = 0.85.Conflicts of interest
The authors declare that there is no conflict of interest.Acknowledgements
This research was funded by the Research Department of Ha’il-Saudi Arabia University, and the project number is RG-20085.References
- N. Assoudi, I. Walha, E. Dhahri, S. Alleg and E. K. Hlil, Solid State Commun., 2018, 277, 13–18 CrossRef CAS.
- M. Mansouri, H. Omrani, R. M’nassri and A. Cheikhrouhou, J. Mater. Sci.: Mater. Electron., 2018, 29, 14239–14247 CrossRef CAS.
- A. Mabrouki, T. Mnasri, A. Bougoffa, A. Benali, E. Dhahri and M. A. Valente, J. Alloys Compd., 2021, 860, 157922 CrossRef CAS.
- C. Henchiri, R. Hamdi, T. Mnasri, M. A. Valente, P. R. Prezas and E. Dhahri, Appl. Phys., 2019, 125, 725 Search PubMed.
- C. L. Ma, Z. Q. Yang and S. Picozzi, J. Phys.: Condens. Matter, 2006, 18, 7717e7728 CrossRef.
- J. Jiang, Q.-M. Chen and X. Liu, Curr. Appl. Phys., 2018, 18, 200–208 CrossRef CAS.
- H. Saoudi, H. Denawi, A. Benali, M. Bejar, E. Dhahri and R. Hayn, Solid State Ionics, 2018, 324, 157–162 CrossRef CAS.
- N. Tahiri, S. Dahbi, I. Dani, O. El Bounagui and H. Ez-Zahraouy, Comput. Theor. Chem., 2021, 1204, 113421 CrossRef CAS.
- N. Tahiri, S. Dahbi, I. Dani, O. El Bounagui and H. Ez-Zahraouy, Phase Transitions, 2021, 94(11), 826–834 CrossRef CAS.
- V. Ferrari, J. M. Pruneda and E. Artacho, Density functionals and half-metallicity in La2/3Sr1/3MnO3, Phys. Status Solidi A, 2006, 203, 1437e1441 CrossRef.
- G. Colizzi, A. Filippetti and V. Fiorentini, Magnetism of La0.625Sr0.375MnO3 under high pressure from first principles, Phys. Rev. B: Condens. Matter Mater. Phys., 2007, 76, 064428 CrossRef.
- M. Jeddi, H. Gharsallah, M. Bejar, M. Bekri, E. Dhahri and E. K. Hlil, RSC Adv., 2018, 8, 9430 RSC.
- J. M. D. Coey and W. Cheikhrouhou-Koubaa, Magnetism and Magnetic Materials, Cambridge University Press, Cambridge, 2009, 978–0-521-81614-4 Search PubMed.
- C. Kittel, Introduction to Solid State Physics, Wiley, NewYork, 7th edn, 1996 Search PubMed.
- J. S. Amaral, S. Das and V. S. Amaral, The Mean-Field Theory in the Study of Ferromagnets and the Magnetocaloric Effect, in Thermodynamics–Systems in Equilibrium and Non-Equilibrium, IntechOpen, London, UK, 2011 Search PubMed.
- C. Bean and D. Rodbell, Magnetic Disorder as a First-Order Phase Transformation, Phys. Rev., 1962, 126, 104 CrossRef CAS.
- M. Mansouri, H. Omrani, W. Cheikhrouhou- Koubaa, M. Koubaa, A. Madouri and A. Cheikhrouhou, J. Magn. Magn. Mater, 2016, 401, 593–599 CrossRef CAS.
- O. Messaoudi, A. Mabrouki, M. Moufida, L. Alfhaid, A. Azhary and S. Elgharbi, J. Mater. Sci.: Mater. Electron., 2021, 32, 22481–22492 CrossRef CAS.
- N. Ahmed, S. Khan, A. A. Khan, G. Nabi, H. Ahmed, Z. Rehman and M. H. Nasim, J. Supercond., 2018, 31, 4079–4089 CrossRef CAS.
- L. Lee, D. Morgan, J. Kleis and J. Rossmeisl, ECS Trans., 2009, 25, 2761–2767 CrossRef.
- L. Wang, T. Maxisch and G. Ceder, Phys. Rev. B: Condens. Matter Mater. Phys., 2006, 73, 195107 CrossRef.
- K. Schwarz, P. Blaha and G. K. H. Madsen, Comput. Phys. Commun., 2002, 147, 71 CrossRef.
- M. Oumezzine, J. S. Amaral, F. J. Mompean, M. G. Hernández and M. Oumezzine, RSC Adv., 2016, 6, 32193–32202 RSC.
- J. S. Amaral, M. S. Reis, V. S. Amaral, T. M. Mendonca, J. P. Araujo, M. A. Sa, P. B. Tavares and J. M. Vieira, J. Magn. Magn. Mater, 2005, 686–689, 290–2941 Search PubMed.
- J. R. Carvajal, M. Hennion, F. Moussa, A. Moudden and L. Pinsard, Phys. B, 1998, 57, 3189–3192 Search PubMed.
- V. M. Goldschmidt, GeochemischeVerteilungsgesetze du Elementen VII, VIII, 1927 Search PubMed.
- J. B. Philipp, P. Majewski, D. Reisinger, S. Geprägs, M. Opel, A. Erb, L. Alff et and R. Gross, Acta Phys. Pol. A, 2004, 105, 7 CrossRef CAS.
- R. D. Shannon, Acta Crystallogr., Sect. A: Cryst. Phys., Diffr., Theor. Gen. Crystallogr., 1976, 32, 751 CrossRef.
- R. Asahi, W. Mannstadt and A. J. Freeman, Phys. Rev. B: Condens. Matter Mater. Phys., 1999, 59, 7486e7492 CrossRef.
- J. Jiang, Q.-M. Chen and X. Liu, Curr. Appl. Phys., 2018, 18, 200–208 CrossRef CAS.
- M. Mahmooda, K. C. Hassan, M. Bhamu, S. M. Yaseend, A. Ramaye and J. Mahmood, Phys. Chem. Solids, 2019, 128, 275–282 CrossRef.
- M. Hassan, N. A. Noor, Q. Mahmood and B. Amin, Curr. Appl. Phys., 2016, 16, 1473–1483 CrossRef.
- B. Karim, F. Riadh, H. El Kebir, B. Lotfi and T. M. Najeh, J. Phys.: Condens. Matter, 2018, 30, 095704 CrossRef.
- M. Nasri, J. Khelifi, S. Hcini, H. Al Robei, E. Dhahri and M. L. Bouazizi, J. Supercond. Novel Magn., 2020, 34, 143–147 CrossRef.
- M. Khlifi, J. Dhahri, E. Dhahri and E. K. Hlil, J. Magn. Magn. Mater., 2019, 480, 1–5 CrossRef CAS.
- J. S. Amaral and V. S. Amaral, J. Magn. Magn. Mater., 2010, 322, 1552–1557 CrossRef CAS.
- J. A. Turcaud, A. M. Pereira, K. G. Sandeman, J. S. Amaral, K. Morrison, A. Berenov, A. Daoud-Aladine and L. F. Cohen, Phys. Rev. B: Condens. Matter Mater. Phys., 2014, 90, 024410 CrossRef CAS.
- J. S. Amaral and V. S. Amaral, Phys. Status Solidi A, 2014, 5, 971–974 CrossRef.
| This journal is © The Royal Society of Chemistry 2021 |

