 Open Access Article
One-pot synthesis of spherical nanoscale zero-valent iron/biochar composites for efficient removal of Pb(II)
Yunlong Shiac,
Changjiang Yu *abc,
Mengying Liuc,
Qiang Lin
 abc,
Man Leic,
Darun Wangc,
Mengwei Yangc,
Yuting Yangc,
Jian Ma
 abc and
Zhengya Jia*d
aKey Laboratory of Water Pollution Treatment & Resource Reuse of Hainan Province, College of Chemistry and Chemical Engineering, Hainan Normal University, No. 99 Longkunnan Road, Haikou, 571158, China. E-mail: ycjhnsfdx@163.com
bKey Laboratory of Tropical Medicinal Resource Chemistry of Ministry of Education, College of Chemistry and Chemical Engineering, Hainan Normal University, No. 99 Longkunnan Road, Haikou, 571158, China
cKey Laboratory of Natural Polymer Function Material of Haikou City, College of Chemistry and Chemical Engineering, Hainan Normal University, No. 99 Longkunnan Road, Haikou, 571158, China
dHainan Huantai Inspection Technology Co. Ltd, Haikou, 571158, China. E-mail: jiazhenya10@163.com
First published on 17th November 2021
Abstract
In this study, a spherical Fe/C composite (AIBC) was successfully prepared via carbonization of Fe3+-crosslinked sodium alginate. The removal capacity and mechanism of AIBC were evaluated for the adsorption of Pb(II) from aqueous solution and compared with that of commercial nanoscale zero-valent iron (nZVI). The effects of the initial concentration, pH of Pb(II) solution, the contact time, coexisting anions, and aging under air were investigated. The results showed that the pH had a strong impact on the adsorption of Pb(II) by AIBC. The adsorption data for AIBC followed the Langmuir model, while the maximum adsorption capacity at pH 5 was 1881.73 mg g−1. The AIBC had a higher adsorption capability than nZVI, especially under the condition of relatively high Pb(II) concentrations. The oxidation–reduction reaction between Fe and Pb(II) was the main mechanism for the adsorption of Pb(II) onto nZVI. AIBC converted the largest amount of Pb(II) into PbO·XH2O/Pb(OH)2 mainly by generating Fe2+.
1. Introduction
At present, environmental contamination by heavy metals has become a serious problem for public health, but also for animals, plants, solid, water, and air. One of the most common toxic metals is lead.1 Although physical and chemical methods are explored for heavy metals' removal, neither of them satisfactorily addresses this serious issue. The core of the most currently used technologies for heavy metal removal is the adsorbent material, which should be cost-effective, eco-friendly, robust, and efficient. Therefore, it is necessary to develop an effective, economical, and environmentally friendly technology for lead removal.2 So far, nanoscale zero-valent iron (nZVI) has been used to remove various metallic ions.3 However, the instability and aggregation of nZVI is challenging due to the easy oxidation and strong magnetic interaction, which were the main issues limiting its further application.4 Various types of porous materials such as graphite,5 activated carbon,6 and biochar7 have been employed as nZVI supporters to overcome these limitations. Among these materials, biochar has attracted considerable attention, because it can enhance the activity of nZVI by both increasing dispersion and decreasing oxidation tendency, as well as improving electron transfer. Biochar-supported nZVI has been widely synthesized using liquid phase reduction, but the method is costly, the reagent is toxic, and secondary pollution is generated.8 Therefore, the development of an appropriate method to synthesis nZVI/biochar has become a hot topic. An effective approach to produce nZVI/biochar is one-step pyrolysis, in which FeCl3 or Fe(NO3)3 is mixed with straw,9 cellulose,10 yellow pine8 or sawdust11 and then calcined under low-oxygen conditions.12 However, the conversion of iron sources during the pyrolysis process is relatively low.Sodium alginate (SA) is a natural polymer extracted from marine brown algae. During adsorption of cations (e.g., divalent-Ca2+ or trivalent-Fe3+) it forms a three-dimensional gel by the exchange of sodium ions from the β-D-guluronic acid residues with those cations.13,14 When iron is used to change the sodium alginate compositon and molecular organization, a SA-Fe materials is obtained, whose carbonization generates a spherical Fe/C composite(AIBC).15 AIBC can provide a certain protective effect on the internal Fe, ensuring a better antioxidant capacity and maintaining a high removal efficiency in the environmental pollution treatment. Clearly, it is essential to test the AIBC properties and compared it with commercial nano zero-valent iron, which can assess the suitability of the former. In this study, AIBC was fabricated via a simple carbonization method using sodium alginate and FeCl3 as carbon and iron precursors, respectively. The Pb2+ removal performances of AIBC were investigated in comparison with those of commercial nZVI. The results of physico-chemical characterization obtained for the adsorbent loaded with lead (XRD, EDS, XPS, and FTIR) allowed to propose the mechanism of adsorption. In addition, the influence of various experimental conditions was analyzed in regards to the adsorption of Pb(II) by AIBC.
2. Materials and methods
2.1 Materials
Sodium alginate was purchased from Shanghai Jingchun Technology Co. Ltd (Shanghai, China), nZVI (size 50 nm) was purchased from Shanghai Xiangtian Nanomaterials Co. Ltd. FeCl3·6H2O and NaOH were supplied by Guangzhou Chemical Reagent Factory (Guangzhou, China), PbCl2 was purchased Aladdin Holdings Group and the Pb standard solution was obtained from Shanghai Fusheng Co. Ltd. (Shanghai, China). All chemicals were of analytical grade and used without any further purification.2.2 Fabrication of magnetic carbon nanoadsorbents
30 g of sodium alginate were dissolved into 1000 mL of ultra-pure water and stirred continuously to form a homogeneous solution. This latter was then dropped into a FeCl3 solution (0.3 M) to form microspheres. Said microspheres were kept in the FeCl3 solution for 24 h, after which they were washed with ultra-pure water (8 times), dried in a vacuum drying oven at 50 °C first and then at 100 °C for 3 h inside an air oven. The dried microspheres were carbonized at 200 °C at a heating rate of 5 °C min−1, then at 900 °C at a heating rate of 10 °C min−1 and maintained at 900 °C for 3 h. The thermal treatments were performed in a tube furnace under N2 atmosphere. A bottle containing 1000 mL of 0.5 M NaOH was connected to the furnace to collect the released gas aiming to avoid air pollution. The sample was denoted as AIBC and stored in a vacuum drying oven.2.3 Digestion experiment
The Fe content in the obtained AIBC was measured by flame atomic absorption spectroscopy. AIBC (0.1 g) was impregnated in 5 mL of HNO3 solution, shaken at a constant speed for 1 h, and allowed to settle for 24 h.15 The solution was diluted with 0.1 M HNO3 and then Fe content measured.2.4 Characterization
The Pb(II) concentration was analyzed using an atomic absorption spectrophotometer (AAS, AA-7000, Shimadzu, Japan). The morphology and surface composition of the samples were investigated with a scanning electron microscopy equipped with energy dispersive X-ray spectroscopy (SEM-EDS, JSM-7401F, JEOL, Japan). The crystalline phases of the materials were inspected by X-ray diffraction (UItima IV, Rigaku, Japan). X-ray photoelectron spectroscopy (XPS, PHI5000 Versaprobe-II, Ulvac-Phi, Japan) was used to analyze the surface chemical composition of the carbon. The magnetic property of the composite was determined using a magnetic property measurement system (7404, LakeShore, USA). The Fourier Transform Infrared (FTIR) spectra were measured by using Nicolet 6700 infrared spectrometer (Thermo Electro Corp, USA). The surface area was calculated via NLDFT method, from the adsorption data measured using a chemisorption analyzer (ASIQ-C000-2, Quantachrome, USA). After adsorption, AIBC-Pb(II) or nZVI-Pb(II) was separated with a magnet, washed with ultra-pure water (6 times), and dried at 60 °C in a vacuum drying oven. The recovered solid sample was analyzed by XRD, EDS, XPS, and FTIR.2.5 Adsorption kinetic study
The adsorption experiments were carried out at 25 °C into conical flasks. A stock solution of 100 mg L−1 Pb(II) was prepared by dissolving PbCl2 in water at pH 5. The pH value of the solutions was adjusted using a solution of either 0.1 M HNO3 or 0.1 M NaOH solutions. Subsequently, 0.05 g of AIBC or nZVI were introduced into 100 mL of the Pb(II) solution. The flasks were placed within an incubator shaker and then shaken at a constant speed (120 rpm) for a given period of time (from 1 to 24 h). At the end of experiment, the solid was separated with a magnet, while the concentrations of Pb(II) in the recovered solutions was measured using a flame atomic absorption spectrometer.16 The experiments were performed in triplicate.The adsorption capacity of Pb(II) at time t (qt) was calculated using eqn (1).
 | (1) |
2.6 Isotherm of adsorption
AIBC or nZVI (0.05 g) were introduced in a 100 mL volume of the Pb(II) solution with different concentration(300–1000 mg L−1) at 25 °C, and then shaken at a constant speed (120 rpm) for 24 h.17 At the end of the experiment, the solid was separated with a magnet and the concentrations of Pb(II) in the recovered solutions was measured using a flame atomic absorption spectrophotometer. Again, the experiments were performed in triplicate.The equilibrium adsorption capacity (qe) of Pb(II) was calculated using eqn (2).
 | (2) |
2.7 Consecutive adsorption of AIBC
The consecutive adsorption ability of the AIBC was assessed by performing four successive adsorption cycles without regeneration. Typically, 0.05 g of AIBC were introduced into 100 mL of Pb(II) solution in a conical flask. The flask was placed into an incubator shaker and shaken at a constant speed (120 rpm) for 24 h. After each cycle, the supernatant was decanted and fresh Pb(II) aqueous solution was introduced into the conical flasks for another 24 h.18 The experiment was performed in triplicate.2.8 Influence of coexisting anions
The effect of coexisting anions (Cl− and NO3−, 10 to 50 mM) on Pb(II) removal (100 mg L−1) was evaluated.8 AIBC (0.05 g) was introduced into 100 mL Pb(II) solution at 25 °C at a certain concentration of coexisting anions as a back-ground electrolyte and shaken at a constant speed (120 rpm) for 24 h. The experiments were performed in triplicate.2.9 Aging experiments in air
The freshly prepared AIBC was put in a watch-glass and exposed to the air. The adsorption experiments were carried out at 25 °C and pH 5 in conical flasks. AIBC (0.05 g) was introduced into 100 mL of Pb(II) solution (100 mg L−1) at a certain time (from 2 to 24 h).19 The flasks were shaken at a constant speed (120 rpm) for 24 h in an incubator shaker. The experiment was performed in triplicate.3. Results and discussion
3.1 Characterization of materials
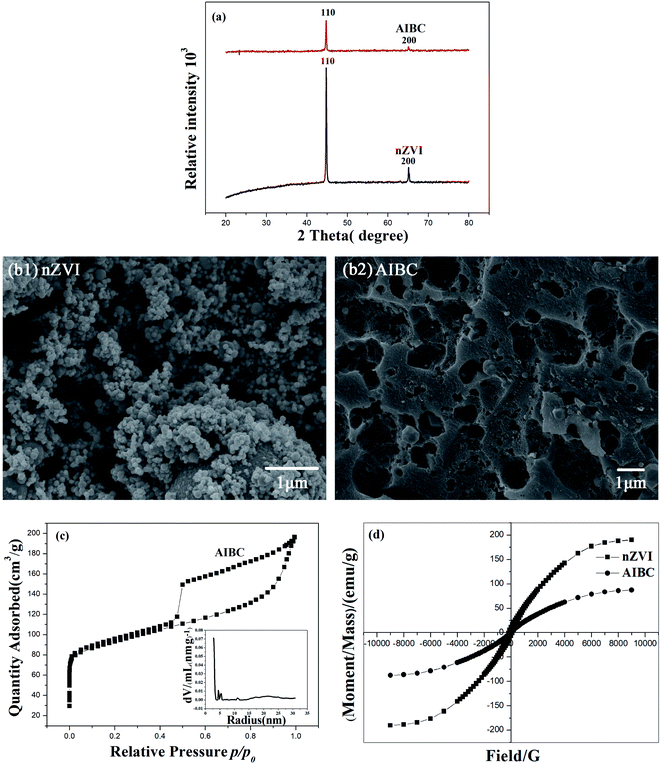
Fig. 1(a) shows the XRD patterns of AIBC and nZVI. The diffraction peaks displayed in both diffractograms are consistent with the JCPDS no. 06-0696 of Fe0.20 Since the diffraction peaks at 44.7°, 65.0° correspond to the (110) and (200) crystal planes, respectively, it can be stated that most of Fe3+ in AIBC sample have been reduced into Fe0. In addition, the XRD diffractogram of AIBC did not displayed obvious miscellaneous peaks, suggesting that the iron particles did not changed in the environment and only a few impurities were generated as a result of the protection of carbon material against air. Therefore, AIBC exhibits improved antioxidative properties. SEM image of nZVI (Fig. 1(b1)) shows that the commercial material is made of sphere-like particles with a quite homogenous size distribution, which aggregated into clusters because of magnetic and electrostatic forces between nanoparticles. The average diameter of nZVI particles is about 50 nm according to the sales instructions. Fig. 1(b2) illustrates the SEM image of AIBC sample. The morphology is completely changed, displaying large and uneven pores created during the thermal treatment. In addition, the abundant Fe nanoparticles were anchored on the external and internal carbon layers. As can be seen in Fig. 1(c), the N2 adsorption/desorption isotherm of AIBC is of type IV with a type H2 hysteresis loop according the IUPAC classification.8,21 The pore size distribution curve of AIBC indicates the presence of both micropores and mesopores with a diameter in the range of 5–60 nm. Yet, the formation of macropores is not excluded based on the shape of the hysteresis loop at high relative pressure (>0.9). The specific surface area of AIBC is 464 m2 g−1. The larger specific surface area of AIBC enhances the adsorption capacity toward Pb(II), whereas the transfer of Pb(II) and products is improved due to the interconnected channels, which increases the diffusion of molecules and ions. The magnetization curves of nZVI and AIBC are depicted in Fig. 1(d). The results showed that the maximum saturation magnetization of nZVI and AIBC are 190.5 and 87.5 emu g−1, respectively. The values of the coercivity and remanence are very small, indicating that nZVI and AIBC are typical superparamagnetic materials. AIBC showed a great magnetic response when a permanent magnet was nearby, indicating the recyclability of AIBC, a critical aspect in avoiding the secondary pollution.3.2 Effect of pH on removal of Pb(II)
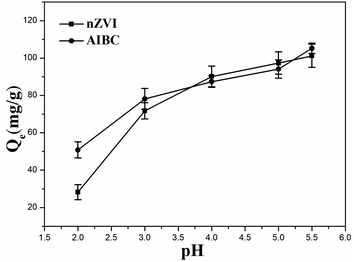
The effect of the pH on the adsorption capacity of nZVI and AIBC was further investigated. The adsorption experiments were carried out starting with at an initial Pb(II) concentration of 100 mg L−1. The effect of the pH on the removal capacity of nZVI and AIBC was investigated within a range from 2 to 5.5. The results are depicted in Fig. 2. Although a small difference between the adsorption capacities of nZVI and AIBC was observed, the removal capacity increased with the pH for both samples. This can be explained by the fact that, at the lower pH, a larger number of protons (H+) reacted with the active sites. When pH is increased, the concentration of H+ ions decreased, resulting in a higher amount of Pb(II) being adsorbed.. Since, Pb(II) ions precipitate at pH above 5.5,22 a pH value of 5 was selected as the optimum value and used throughout the following experiments.3.3 Kinetics of adsorption
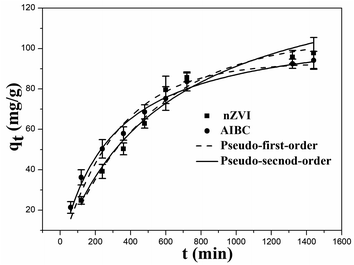
The experimental adsorption data was fitted with two specific models to study the kinetic behavior of nZVI and AIBC, namely the pseudo-first-order kinetic model and pseudo-second-order kinetic models. These models are defined by eqn (3) and eqn (4).23| qt = qe(1 − ek1t) | (3) |
 | (4) |
As noticed, the rate of Pb(II) adsorption on nZVI was faster within the first 10 h, followed by a decreasing trend after this time threshold and increasing again in the subsequent adsorption step, albeit only slightly. It is assumed that most of nZVI was converted into FeOOH and Fe2O3 under the catalytic effect of Pb(II) accumulated on the adsorbent surface. These new phases acted as adsorption sites for Pb(II) the second part of the experiment.
The removal rate of Pb(II) by AIBC was almost as fast as for nZVI within the first 8 h, then decreased but slower as compared to nZVI. In addition, the adsorption capacity for this sample was noticeably increased. The relatively fast adsorption rate of Pb(II) by AIBC within the first 8 h is mainly attributed to the oxidation–reduction reaction of Fe0 on the surface of AIBC. The products generated by the redox reaction of Fe0 and Pb(II) partially obstructed the pores of AIBC, which increased the diffusion of adsorbed in the second part of the adsorption.
The kinetic parameters and correlation coefficients (R2) for the adsorption of Pb(II) on nZVI and AIBC are listed in Table 1.
| Sample | Pseudo-first-order model | Pseudo-second-order model | ||||
|---|---|---|---|---|---|---|
| qe,cal (mg g−1) | k1 (10−3 min−1) | R2 | qe,cal (mg g−1) | k2 (10−5 g mg−1 min−1) | R2 | |
| nZVI | 105.75 | 2.02 | 0.9817 | 145.84 | 1.14 | 0.9752 |
| AIBC | 93.12 | 3.11 | 0.9749 | 112.30 | 3.08 | 0.9916 |
It can be seen that the pseudo-first-order model describes better the adsorption of Pb(II) on nZVI. The correlation coefficient (0.9817) of the pseudo-first-order model for nZVI was superior in comparison to pseudo-second-order model (0.9752). In addition, the adsorption capacity estimated from the pseudo-first-order equation was more consistent with the experimental results, suggesting that the diffusion is the rate-controlling step.24
Taking into account AIBC, the correlation coefficients (R2) were not significantly different for both models, i.e., 0.9916 for the pseudo-second-order model and 0.9749 for the pseudo-first-order equation model. The adsorption capacity estimated from the pseudo-second-order equation was slightly higher compared to the experimental results. In addition, the adsorption capacity obtained from the pseudo-first-order equation was more consistent with the experimental results, suggesting once again that the rate-limiting step was governed by diffusion while the ions were mainly retained on the surface by chemical forces.25 The results showed that the kinetic constant for Pb(II) adsorption on AIBC was higher than for nZVI. The main reason could be due to the porous nature of AIBC.
3.4 Isotherms adsorption experiments
The adsorption isotherm of adsorption was analyzed using the Langmuir and Freundlich models. The Langmuir isotherm model is described by eqn (5).26
 | (5) |
The Freundlich isotherm model is described by eqn (6).27
| qe = KFC1/ne | (6) |
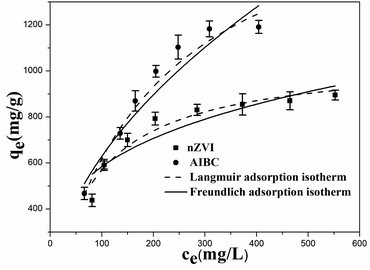
The Langmuir and Freundlich isotherms for the adsorption of Pb(II) on nZVI and AIBC are displayed in Fig. 4.
The parameters of adsorption isotherms of Pb(II) on nZVI and AIBC and the correlation coefficients (R2) are summarized in Table 2.
| Sample | Langmuir | Freundlich | ||||
|---|---|---|---|---|---|---|
| qm (mg g−1) | KL (L mg−1) | R2 | n | KF (mg g−1) | R2 | |
| nZVI | 1057.99 | 0.0116 | 0.9427 | 3.6264 | 163.99 | 0.8471 |
| AIBC | 1881.73 | 0.0049 | 0.9671 | 1.9564 | 59.76 | 0.9274 |
As shown in Table 2, the correlation coefficients R2 for the Langmuir model are higher than those obtained from the Freundlich model for both solids. Hence, the experimental results suggest that the Langmuir model fits the adsorption with a much higher goodness. The qm value for Pb(II) adsorption on AIBC is 1881.73 mg g−1, which is higher in respect to nZVI (1057.99 mg g−1). The Fe content in AIBC is about 580 mg g−1, but it has a high adsorption capacity, especially in a high concentrations Pb(II) solution (700–1000 mg L−1). The pH of the Pb(II) solutions (700–1000 mg L−1) after adsorption is about 5.5. Pb(II) ions do not hydrolyze or precipitate. The improved adsorption capacity might be attributed to the difference between nZVI and AIBC regarding the mechanism of Pb2+ removal. In addition, the mesoporous structures and higher surface area of AIBC is beneficial for metal ions diffusion and adsorption.
3.5 Comparison with other adsorbents
The maximum adsorption capacity of Pb(II) on AIBC was compared with those reported for other adsorbents (Table 3). According to this latter, AIBC appears as a promising adsorbent for the removal of Pb(II) from aqueous solutions.| Adsorbents | pH | Concentration range(mg L−1) (mg L−1) | Qmax (mg g−1) | Ref. |
|---|---|---|---|---|
| PPG-nZVI beads | 6 | 1–180 | 59.82 | 28 |
| L-cysteine stabilized zero valent iron | 5 | 50 | 25 | 29 |
| Fe–Cu alloy coated cellulose nanocrystals | — | 20–50 | 85.8 | 30 |
| Vermicompost biochar | 5 | 100–1000 | 230.95 | 31 |
| Salecan/CMCS PEC hydrogel films | 6 | 50–600 | 418.4 | 32 |
| LMR-210 | 5 | 10–200 | 57.4 | 33 |
| CMC-nZVI | 6 | 100–1000 | 1237.32 | 34 |
| Chitosan/Mg–Al-layered double hydroxide nanocomposite biochar | 6 | 20–2000 | 333.3 | 35 |
| Fe3O4/MgAl-layered double hydroxide oxide | 5 | — | 266.6 | 36 |
| Fe3O4@MnO2/CT | 6 | 100–2000 | 935 | 37 |
| HHP-assisted E pectin | 7 | — | 263.15 | 38 |
| Graphene oxide–montmorillonite nanocompositemontmorillonite nanocomposite | 6 | — | 44.96 | 39 |
| AIBC | 5 | 300–1000 | 1881.73 | This study |
3.6 Adsorption mechanism
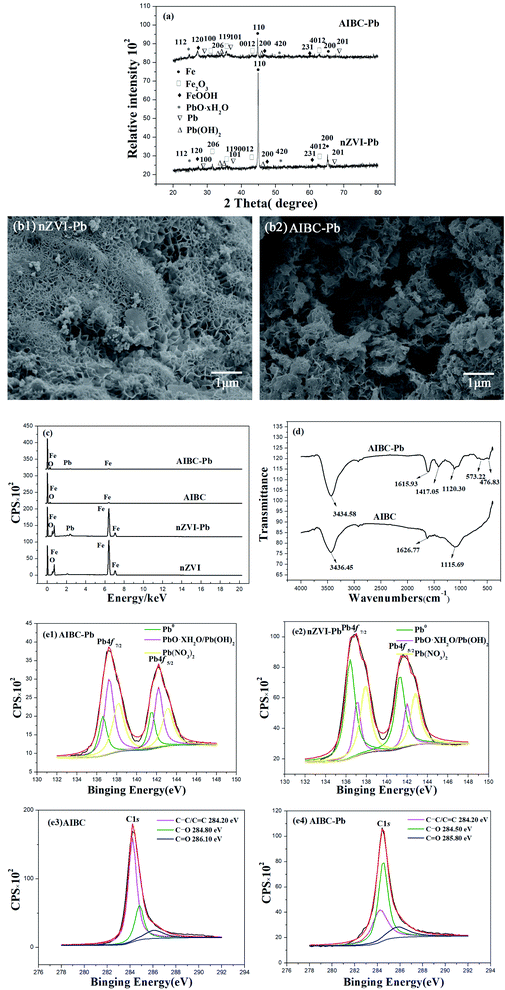
Fig. 5(a) illustrates the XRD patterns of nZVI and AIBC after adsorption of Pb(II). As compared with the diffraction patterns recorded before adsorption (Fig. 1(a)), the diffractogrmas of used adsorbents are more complex, indicating the presence of several crystalline phases. Therefore, the diffraction peaks are consistent with those corresponding to PbO·xH2O (diffraction peaks at 24.78° and 50.95° attributed to the (112) and (420) crystal planes, respectively, according to JCPDS no. 21-0474),40 Pb (diffraction peaks at 31.70°, 35.74°, and 68.59° correspond to (100), (101), and (201) crystal planes, respectively, according to JCPDS no. 23-0345),34 FeOOH (diffraction peaks at 27.08°, 46.86°, and 60.72° correspond to the (120), (200), and (231) crystal planes, respectively, according to the JCPDS no. 44-1415),41 and Fe2O3 (diffraction peaks at 30.27°, 35.68°, 43.34°, and 63.01° correspond to the (206), (119), (0012), and (4012) crystal planes, respectively, according to the JCPDS no. 25-1402).42 In addition, the XRD patterns show the presence of Pb(OH)2(JCPDS no. 11-1070).40 Hence, XRD results revealed that most of Pb(II) was reduced to PbO·xH2O, Pb(OH)2 and Pb, whereas most of nZVI was converted into FeOOH and Fe2O3.Fig. 5(b) illustrates the SEM images of nZVI and AIBC after adsorption of Pb(II). As compared with the SEM images taken before adsorption (Fig. 1(b)), it is obvious that the morphology of solids completely changed during the adsorption. The particles are agglomerated on the surface of the nZVI, probably due to the reaction products. In addition, abundant micro- and nanoparticles are clearly seen on the AIBC surface. Moreover, part of them is embedded into the biochar pores, causing their blockage. Fig. 5(c) displays the EDS patterns of nZVI and AIBC before and after adsorption of Pb(II). The contents of Fe and C elements on the surface of AIBC are 73.35 and 26.65%, respectively. Similarly, the contents of Fe and O on the surface of nZVI are 92.65 and 7.35%, respectively. The higher amount of O on the surface of nZVI is that it is easy to self-ignite in air, so it must be aged before it leaves the factory. The results revealed that the amount of Fe element in nZVI and AIBC decreased after adsorption while Pb appeared in the spectra after adsorption. The amount of Pb element on the surface of nZVI and AIBC was 6.19% and 15.51%, respectively.
FTIR was used to analyze the functional groups of the adsorbent and understand the molecular interactions occurring between Pb(II) and AIBC. In Fig. 5(d), the spectrum of AIBC displays a vibration band at 3436.45 cm−1, corresponding to O–H stretching,43,44 a vibration band at 1626.77 cm−1 attributed to C![[double bond, length as m-dash]](https://www.rsc.org/images/entities/char_e001.gif) O stretching,45 and a vibration band at 1115.69 cm−1 assigned to C–O stretching.46,47 After Pb(II) removal, the FTIR spectrum of AIBC displays slight displacements for certain vibration bands. Hence, band of O–H and C
O stretching,45 and a vibration band at 1115.69 cm−1 assigned to C–O stretching.46,47 After Pb(II) removal, the FTIR spectrum of AIBC displays slight displacements for certain vibration bands. Hence, band of O–H and C![[double bond, length as m-dash]](https://www.rsc.org/images/entities/char_e001.gif) O shifted downfield, indicating the formation of a complex with Pb(II). The increased ionic volume weakened the stretching and bending vibrations of the functional groups, thus causing a downfield shift.48,49 The vibration band of C–O after Pb(II) removal shifted highfield as compared with that before adsorption, phenomenon attributed to the inductive effect.50 New bands at 476.83, 573.22 and 1417.05 cm−1, corresponding to Fe–O stretching can be observed in the spectrum of AIBC after Pb(II) adsorption.7
O shifted downfield, indicating the formation of a complex with Pb(II). The increased ionic volume weakened the stretching and bending vibrations of the functional groups, thus causing a downfield shift.48,49 The vibration band of C–O after Pb(II) removal shifted highfield as compared with that before adsorption, phenomenon attributed to the inductive effect.50 New bands at 476.83, 573.22 and 1417.05 cm−1, corresponding to Fe–O stretching can be observed in the spectrum of AIBC after Pb(II) adsorption.7
The AIBC after adsorption of Pb(II) was also analyzed by XPS. Fig. 5(e1) depicts the high resolution spectrum of Pb 4f, which displays the peak of Pb 4f7/2 and Pb 4f5/2.51 Each of them is fitted with three peaks. The peaks at 136.60 and 141.50 eV are ascribed to Pb0 (21%),40 the peak at 137.25 and 142.20 eV are assigned to PbO·H2O/Pb(OH)2 (43%),40 and the peak at 138.15 eV and 143.10 eV are attributed to Pb(II) (36%).40 The relatively high area of PbO·XH2O/Pb(OH)2 and Pb(II) signals in AIBC spectrum indicate a significant role played by the deposition and chelation in the adsorption. The fitting analysis of Pb 4f7/2 and Pb 4f5/2 of nZVI is shown in Fig. 5(e2). The lead is presented as Pb0 (61%), PbO·XH2O/Pb(OH)2 (11%), and Pb(II) (28%) in the nZVI loaded with Pb. The relatively high area of Pb0 signal in the spectrum of nZVI loaded with Pb indicates that most Pb(II) is reduced on nZVI. On the basis of XPS results, it can be stated that Pb(II) removal by nZVI and AIBC might be due to both adsorption and reduction processes. The high resolution spectrum of C 1s of AIBC before adsorption is shown in Fig. 5(e3). The peaks at 284.2, 284.8, and 286.1 eV could be ascribed to C–C/C![[double bond, length as m-dash]](https://www.rsc.org/images/entities/char_e001.gif) C, C–O and C
C, C–O and C![[double bond, length as m-dash]](https://www.rsc.org/images/entities/char_e001.gif) O bonds, respectively.52,53 The high resolution spectrum of C 1s of AIBC after adsorption of Pb(II) is shown in Fig. 5(e4). It can be seen that the binding energy of C–C/C
O bonds, respectively.52,53 The high resolution spectrum of C 1s of AIBC after adsorption of Pb(II) is shown in Fig. 5(e4). It can be seen that the binding energy of C–C/C![[double bond, length as m-dash]](https://www.rsc.org/images/entities/char_e001.gif) C did not change after adsorption of Pb(II), which indicated that C–C/C
C did not change after adsorption of Pb(II), which indicated that C–C/C![[double bond, length as m-dash]](https://www.rsc.org/images/entities/char_e001.gif) C may not involve the adsorption of Pb(II). The binding energy of C–O and C
C may not involve the adsorption of Pb(II). The binding energy of C–O and C![[double bond, length as m-dash]](https://www.rsc.org/images/entities/char_e001.gif) O showed a significant drop compared to the energy before adsorption of Pb(II), which indicated that C–O and C
O showed a significant drop compared to the energy before adsorption of Pb(II), which indicated that C–O and C![[double bond, length as m-dash]](https://www.rsc.org/images/entities/char_e001.gif) O are involved in a coordination complex with and Pb(II). As a result, the binding energy of these functional groups was reduced as a consequence of the electronic densities changes, related to their modified local environment.54 The observation was consistent with FTIR results.
O are involved in a coordination complex with and Pb(II). As a result, the binding energy of these functional groups was reduced as a consequence of the electronic densities changes, related to their modified local environment.54 The observation was consistent with FTIR results.
The changes occurred in nZVI and AIBC after Pb(II) adsorption have been evaluated by FTIR, SEM, XRD, EDS, and XPS and compared with those obtained before adsorption. According to Fig. 5(e1), it is obvious that a little amount of Pb2+ was converted into Pb0 via eqn (7) while the remained parts of Pb2+ species were immobilized on the AIBC surface according to eqn (8)–(12). In addition, it is evident that the most of Pb2+ was converted into Pb0 on nZVI surface via eqn (7) (Fig. 5(e2)). The difference between nZVI and AIBC regarding the mechanism of Pb2+ removal may be due to the influence of the biochar.55,56 It should be recalled that AIBC is rich in functional groups, such as C–O–C, C![[double bond, length as m-dash]](https://www.rsc.org/images/entities/char_e001.gif) O, and –O–H, which acted as adsorption sites for Pb2+ (Fig. 5(e3, e4)). In addition, the oxygen-based functional groups of FeOOH and Fe2O3 provided binding sites for Pb(II) adsorption.57
O, and –O–H, which acted as adsorption sites for Pb2+ (Fig. 5(e3, e4)). In addition, the oxygen-based functional groups of FeOOH and Fe2O3 provided binding sites for Pb(II) adsorption.57
| 2Fe0 + 3Pb2+ + 4H2O → 3Pb0 + 2FeOOH + 2H+ | (7) |
| 2Fe0 + O2 + 4H+ → 2Fe2+ + H2O | (8) |
| Fe2+ + H2O → FeOH+ + H+ | (9) |
| FeOH+ + H2O → Pb(OH)2 + H+ | (10) |
| PbOH+ + H2O → Pb(OH)2 + H+ | (11) |
| PbOH+ → PbO + H+ | (12) |
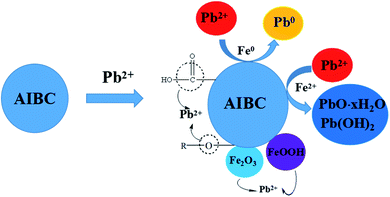
The oxidation–reduction reaction between Fe and Pb(II) was the main mechanism for the adsorption of Pb(II) onto nZVI. AIBC converted Pb(II) into PbO·XH2O/Pb(OH)2 mainly by generating Fe2+. The difference in the mechanisms of the adsorption of Pb(II) onto AIBC and nZVI was the main reason why AIBC had higher adsorption capability when treating high-concentration Pb(II) sewage. During the adsorption, a large amount of oxides was formed to cover the surface of nZVI, which severely hindered the contact of Pb(II) with the active sites inside nZVI. It is relatively difficult for the reduction reaction between Pb(II) and Fe. In contrast, it was relatively easy for the Fe2+, generated by the AIBC in the solution, to contact Pb(II), converting a large amount of Pb(II) into PbO·XH2O/Pb(OH)2 and removing it. In addition, the relatively high specific area and mesoporous structure of AIBC also contributed towards the removal of Pb(II). Based on the analysis of experimental data as well as the characterizations of AIBC, the potential mechanism of Pb(II) adsorption by AIBC was proposed (Fig. 6).
3.7 Application experimentation
The AIBC were recycled and used as consecutive absorbent for four repeated cycles (Fig. 7(a)). Compared with the initial adsorption capacity, the adsorption capacity of AIBC for Pb(II) was reduced by 16% in the second cycle experiment, maintaining a relatively good adsorption effect. In the third cycle experiment, the adsorption capacity was reduced by 59%, during which the adsorption capacity was remarkably reduced. The adsorption capacity of the fourth cycle experiment was reduced by 82%. After four cycles of experiments, AIBC was still able to maintain a relatively high adsorption capacity. This could be explained by the fact that a part of nZVI located in the mesopores of AIBC (Fig. 5(a)) was not accessible to Pb(II), which can continue to remove Pb(II) when was injected into the fresh Pb(II) aqueous. The effect of the two coexisting anions on the Pb(II) removal for AIBC was investigated (Fig. 7(b)). In the presence of Cl− (10 and 50 mM), the removal efficiency decreased from 100 to 99%, which indicates that Cl− had a little effect on the Pb(II) removal. In contrast, at similar concentrations of NO3−, the removal efficiency increased from 109 to 116%, which is significant. Fe may react with NO3−, especially when the concentration of NO3− is relatively high, which will accelerate the consumption of Fe. The Fe2+ and iron oxides produced by the reaction could further increase the adsorption capacity of Pb(II).58,59 The aging test showed that, when exposed to the air for 24 hours, the adsorption amount of AIBC for Pb(II) did not decrease significantly (Fig. 7(c)). The adsorption amount of AIBC for Pb(II) fluctuated slightly at various time periods within the 24 hours. However, the overall deviation was not large, indicating good oxidation resistance. This could be due to the reason that the loading and coating of biochar enhanced the oxidation resistance of Fe.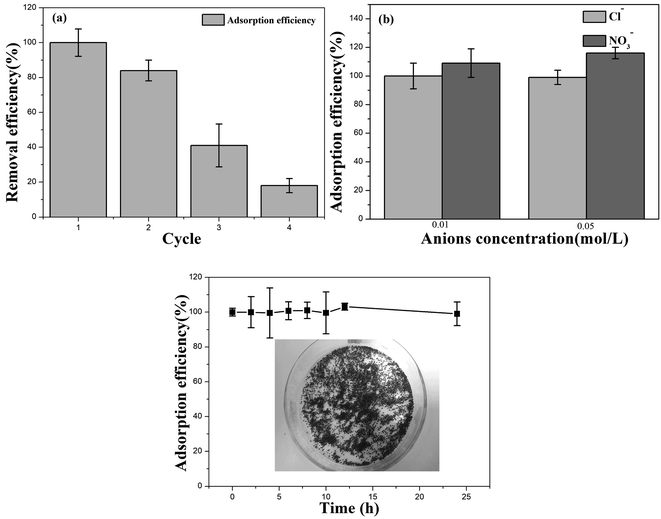 | ||
| Fig. 7 (a) Recyclability of AIBC, (b) influence of coexisting anions by AIBC, (c) aging experiments in air by AIBC. | ||
4. Conclusions
In summary, a maximum adsorption capacity of 1881.73 mg g−1 was obtained for AIBC, which was higher compared with that of nZVI (1057.99 mg g−1). The AIBC has a high adsorption capacity, especially in a high concentrations Pb(II) solution. The investigation of the alleged mechanism of adsorption showed that the removal of Pb2+ by AIBC was mainly attributable to adsorption phenomena. However, the largest amount of Pb2+ was converted into Pb0 on the nZVI surface via chemical reduction. The AIBC has good antioxidant capability in the air. When exposed to this latter, for 24 hours, the adsorbed amount of Pb(II) onto AIBC did not decrease significantly. The AIBC was used for four adsorption cycles and could maintain a total of removal capacity of 18%. Therefore, AIBC has relatively strong cyclic adsorption capability. This work proved that the AIBC, a low cost material, can be successfully used for the treatment of Pb(II)-contaminated wastewater.Conflicts of interest
There are no conflicts to declare.Acknowledgements
This work was supported by the Science and Technology special fund of Hainan Province of China (Project No. ZDYF2020079); Hainan Provincial Natural Science Foundation of China (Project No. 219QN208); Hainan Provincial Natural Science Foundation of China (Project No. 2019RC180).References
- J. Zhang, J. Shao, Q. Jin, X. Zhang, H. Yang, Y. Chen, S. Zhang and H. Chen, Sci. Total Environ., 2020, 716, 137016 CrossRef CAS.
- J. Liu, M. Dai, S. Song and C. Peng, RSC Adv., 2018, 8, 32063–32072 RSC.
- J. Yang, T. Ma, X. Li, J. Tu, Z. Dang and C. Yang, J. Environ. Qual., 2018, 47, 1196 CrossRef CAS.
- W. Tan, Y. Ruan, Z. Diao, G. Song, M. Su, L. Hou, D. Chen, L. Kong and H. Deng, Chemosphere, 2021, 280, 130626 CrossRef CAS.
- C. Xu, W. Yang, W. Liu, H. Sun, C. Jiao and A.-j. Lin, J. Environ. Sci., 2017 DOI:10.1016/j.jes.2017.11.003.
- Y. Zhang, B.-T. Zhang, Y. Teng and J. Zhao, Environ. Technol. Innovation, 2020, 19, 100956 CrossRef.
- L. Qian, X. Shang, B. Zhang, W. Zhang, A. Su, Y. Chen, D. Ouyang, L. Han, J. Yan and M. Chen, Chemosphere, 2019, 215, 739–745 CrossRef CAS.
- Z. Lv, S. Yang, L. Chen, A. Alsaedi, T. Hayat and C. Chen, J. Environ. Sci., 2019, 76, 377–387 CrossRef.
- R. He, Z. Peng, H. Lyu, H. Huang, Q. Nan and J. Tang, Sci. Total Environ., 2018, 612, 1177–1186 CrossRef CAS.
- B. Qiu, Y. Wang, D. Sun, Q. Wang, X. Zhang, B. L. Weeks, R. O'Connor, X. Huang, S. Wei and Z. Guo, J. Mater. Chem. A, 2015, 3, 9817–9825 RSC.
- P. Wang, L. Tang, X. Wei, G. Zeng, Y. Zhou, Y. Deng, J. Wang, Z. Xie and W. Fang, Appl. Surf. Sci., 2017, 392, 391–401 CrossRef CAS.
- M. Lawrinenko, D. A. Laird and J. H. van Leeuwen, ACS Sustainable Chem. Eng., 2016, 5, 767–773 CrossRef.
- A. F. Hassan, A. M. Abdel-Mohsen and H. Elhadidy, Int. J. Biol. Macromol., 2014, 68, 125–130 CrossRef CAS.
- X. Li, Y. Qi, Y. Li, Y. Zhang, X. He and Y. Wang, Bioresour. Technol., 2013, 142, 611–619 CrossRef CAS PubMed.
- J. Wu, H. Zheng, F. Zhang, R. J. Zeng and B. Xing, Chem. Eng. J., 2019, 362, 21–29 CrossRef CAS.
- T. Wu, L. Mao and H. Wang, J. Fluorine Chem., 2017, 200, 8–17 CrossRef CAS.
- Y. Guo, W. Tang, J. Wu, Z. Huang and J. Dai, J. Environ. Sci., 2014, 26, 2123–2130 CrossRef.
- Y. Zeng, H. Walker and Q. Zhu, J. Hazard. Mater., 2017, 324, 605–616 CrossRef CAS PubMed.
- J. Wu, M. Yan, S. Lv, W. Yin, H. Bu, L. Liu, P. Li, H. Deng and X. Zheng, Chemosphere, 2021, 262, 127733 CrossRef CAS PubMed.
- S.-F. Jiang, L.-L. Ling, W.-J. Chen, W.-J. Liu, D.-C. Li and H. Jiang, Chem. Eng. J., 2019, 359, 572–583 CrossRef CAS.
- Z. Wang, Y. Cheng, K. Zhang, C. Hao, L. Wang, W. Li and B. Hu, Fuel, 2018, 232, 495–505 CrossRef CAS.
- P. Regmi, J. L. Garcia Moscoso, S. Kumar, X. Cao, J. Mao and G. Schafran, J. Environ. Manage., 2012, 109, 61–69 CrossRef CAS PubMed.
- S. Bo, J. Luo, Q. An, Z. Xiao, H. Wang, W. Cai, S. Zhai and Z. Li, J. Cleaner Prod., 2020, 250, 119585 CrossRef CAS.
- M. Zhang, B. Gao, S. Varnoosfaderani, A. Hebard, Y. Yao and M. Inyang, Bioresour. Technol., 2013, 130, 457–462 CrossRef CAS PubMed.
- H. Jin, S. Capareda, Z. Chang, J. Gao, Y. Xu and J. Zhang, Bioresour. Technol., 2014, 169, 622–629 CrossRef CAS.
- Y. Yang, Y. Xie, L. Pang, M. Li, X. Song, J. Wen and H. Zhao, Langmuir, 2013, 29, 10727–10736 CrossRef CAS.
- L. Wang, Y. Luo, H. Li, D. Yu, Y. Wang, W. Wang and M. Wu, Colloids Surf., A, 2020, 585, 124106 CrossRef CAS.
- H. Li, Y. Ge and X. Zhang, Colloids Surf., A, 2017, 513, 306–314 CrossRef CAS.
- Y. Bagbi, A. Sarswat, S. Tiwari, D. Mohan, A. Pandey and P. R. Solanki, Environmental Nanotechnology, Monitoring & Management, 2017, 7, 34–45 Search PubMed.
- L. Chen, H. Yu, C. Deutschman, T. Yang and K. C. Tam, Carbohydr. Polym., 2020, 234, 115889 CrossRef CAS.
- W. Zhang, W. Du, F. Wang, H. Xu, T. Zhao, H. Zhang, Y. Ding and W. Zhu, Sci. Total Environ., 2020, 716, 137108 CrossRef CAS PubMed.
- X. Hu, L. Yan, Y. Wang and M. Xu, Chem. Eng. J., 2020, 388, 124189 CrossRef CAS.
- S. Ahmad, X. Zhu, J. Luo, M. Shen, S. Zhou and S. Zhang, Sci. Total Environ., 2019, 687, 1381–1388 CrossRef CAS PubMed.
- W. Jiao, Y. Song, D. Zhang, G. Chang, H. Fan and Y. Liu, Adv. Powder Technol., 2019, 30, 2251–2261 CrossRef CAS.
- F. Lyu, H. Yu, T. Hou, L. Yan, X. Zhang and B. Du, J. Colloid Interface Sci., 2019, 539, 184–193 CrossRef CAS.
- J. Sun, Y. Chen, H. Yu, L. Yan, B. Du and Z. Pei, J. Colloid Interface Sci., 2018, 532, 474–484 CrossRef CAS PubMed.
- H. Yang, M. Lu, D. Chen, R. Chen, L. Li and W. Han, J. Colloid Interface Sci., 2020, 563, 218–228 CrossRef CAS.
- M. P. Mudugamuwa Arachchige, T. Mu and M. Ma, Chemosphere, 2021, 262, 128102 CrossRef CAS.
- C. Zhang, J. Luan, X. Yu and W. Chen, J. Hazard. Mater., 2019, 378, 120739 CrossRef CAS.
- Z. H. Diao, J. J. Du, D. Jiang, L. J. Kong, W. Y. Huo, C. M. Liu, Q. H. Wu and X. R. Xu, Sci. Total Environ., 2018, 642, 505–515 CrossRef CAS PubMed.
- P.-R. Liu, Z.-Y. Yang, Y. Hong and Y.-L. Hou, Algal Res., 2018, 31, 173–182 CrossRef.
- Z. Su, L. Tan, R. Yang, Y. Zhang, J. Tao, N. Zhang and F. Wen, Chem. Phys. Lett., 2018, 695, 153–157 CrossRef CAS.
- S. Mandal, S. Pu, L. He, H. Ma and D. Hou, Environ. Pollut., 2020, 259, 113851 CrossRef CAS PubMed.
- C. Yu, H. Li, H. Ma, L. Zhang, Y. Li and Q. Lin, Polym. Bull., 2021 DOI:10.1007/s00289-021-03555-7.
- S. Zhu, S.-H. Ho, X. Huang, D. Wang, F. Yang, L. Wang, C. Wang, X. Cao and F. Ma, ACS Sustainable Chem. Eng., 2017, 5, 9673–9682 CrossRef CAS.
- B. Zhou, Z. Wang, D. Shen, F. Shen, C. Wu and R. Xiao, Ecol. Eng., 2017, 98, 189–195 CrossRef.
- C. Yu, M. Wang, X. Dong, Z. Shi, X. Zhang and Q. Lin, RSC Adv., 2017, 7, 53135–53144 RSC.
- G. R. Mahdavinia, S. Mousanezhad, H. Hosseinzadeh, F. Darvishi and M. Sabzi, Carbohydr. Polym., 2016, 147, 379–391 CrossRef CAS.
- C. Yu, D. Zhang, X. Dong and Q. Lin, RSC Adv., 2018, 8, 34151–34160 RSC.
- Y. T. Zhou, C. Branford-White, H. L. Nie and L. M. Zhu, Colloids Surf., B, 2009, 74, 244–252 CrossRef CAS.
- Z. Li, L. Wang, J. Meng, X. Liu, J. Xu, F. Wang and P. Brookes, J. Hazard. Mater., 2018, 344, 1–11 CrossRef CAS.
- J. M. Lázaro Martínez, E. Rodríguez-Castellón, R. M. T. Sánchez, L. R. Denaday, G. Y. Buldain and V. Campo Dall’ Orto, J. Mol. Catal. A: Chem., 2011, 339, 43–51 CrossRef.
- Q. Fang, B. Chen, Y. Lin and Y. Guan, Environ. Sci. Technol., 2014, 48, 279–288 CrossRef CAS PubMed.
- C. Bertagnolli, A. Uhart, J. C. Dupin, M. G. da Silva, E. Guibal and J. Desbrieres, Bioresour. Technol., 2014, 164, 264–269 CrossRef CAS PubMed.
- X. Yu, W. Gong, X. Liu, L. Shi, X. Han and H. Bao, J. Hazard. Mater., 2011, 198, 340–346 CrossRef CAS PubMed.
- Y. Yuan, N. Bolan, A. Prevoteau, M. Vithanage, J. K. Biswas, Y. S. Ok and H. Wang, Bioresour. Technol., 2017, 246, 271–281 CrossRef CAS PubMed.
- P. Huang, Z. Ye, W. Xie, Q. Chen, J. Li, Z. Xu and M. Yao, Water Res., 2013, 47, 4050–4058 CrossRef CAS PubMed.
- J. Huang, W. Yin, P. Li, H. Bu, S. Lv, Z. Fang, M. Yan and J. Wu, Sci. Total Environ., 2020, 744, 140715 CrossRef CAS PubMed.
- Y. Liu and J. Wang, Sci. Total Environ., 2019, 671, 388–403 CrossRef CAS.
| This journal is © The Royal Society of Chemistry 2021 |

