 Open Access Article
Docking studies and molecular dynamics simulation of triazole benzene sulfonamide derivatives with human carbonic anhydrase IX inhibition activity†
Gopinath P. and
Kathiravan M. K.*
Dr. A. P. J. Abdul Kalam Research Lab, Department of Pharmaceutical Chemistry, SRM College of Pharmacy, SRMIST, Kattankulathur, Chennai, Tamil Nadu – 603 203, India. E-mail: mkkathiravan.srmist@gmail.com; kathirak@srmist.edu.in
First published on 25th November 2021
Abstract
Carbonic anhydrase IX has been used as a hypoxia endogenous marker in a range of solid tumors including renal cell, lung, bladder and tumors of the head and neck. α-CA IX isozyme is over-expressive in hypoxic environment which becomes an attractive target for the design of inhibitors' targeting cancer particularly, tumor progression and invasion. In the process of designing new leads for the inhibition of tumor-associated hCA IX, the best triazole benzene sulfonamide derivatives were obtained from the QSAR model published in the research paper as cited. The statistically validated QSAR model was utilized for bioactivity prediction of novel leads. Further the designed molecules having good scores were subjected to molecular docking studies and molecular dynamic simulation studies. Designed compounds 1, 2, 20, 24 and 27 have shown predicted bioactivity of 9.13, 9.65, 10.05, 10.03 and 10.104 logarithmic units respectively using QSAR model 2. The low energy conformations of the above compounds exhibited good Autodock binding energy scores (−8.1, −8.2, −8.1, −8.3 and −9.2 K cal mol−1) and interactions with Gln92, Thr200, Asn66 and His68. Desmond's molecular dynamics simulations studies for 100 ns of compound 27 compared to reference SLC0111 provided useful structural insights of human carbonic anhydrase IX inhibition. Compound 27 with new chemical structure displayed both hydrophobic and hydrophilic stable interactions in the active site. RMSD, RMSF, RoG, H-bond and SASA analysis confirmed the stable binding of compound 27 with 5FL4 structure. In addition, MM-PBSA and MM-GBSA also affirm the docking results. We propose the designed compound 27 (predicted Ki = ∼0.07 nM) as the best theoretical lead which may further be experimentally studied for selective inhibition.
1. Introduction
Solid tumors such as breast, prostate, head and neck tumors have characteristic hypoxia, which promotes tumor progression and therapeutic treatment resistance through augmented proliferation, reduced apoptosis and angiogenesis. Carbonic anhydrase IX has been used as a hypoxia endogenous marker in a range of solid tumors including renal cell, lung, bladder and tumors of the head and neck.1 In hypoxia, the CA IX enzyme is upregulated in response to HIF 1-α binding to the hypoxia responsive elements.2,3 These hypoxia responsive elements have a pro-survival function maintaining high intra-cellular pH preventing apoptosis and low extracellular pH for activation of proteolytic and signal transduction pathways for invasion. However, the fluctuating hypoxia in tumors leads to limited CA IX expression thus hindering any available monoclonal antibody uptake.4 In this view, the CA IX specific small molecule ligands such as the focused sulfonamides will be appropriate for the inhibition purpose.5,6 The objective of this study was to investigate the designed selective CA IX inhibitors through molecular modelling approaches.The computation of quantitative structure–activity relationship (QSAR) models is an essential step in preclinical drug development, i.e. models linking chemical character of compounds with bioactivities towards a target macromolecule. In general, the QSAR models were computed by information obtained from the physicochemical and structural features of a library/dataset, typically assembled from biological data of one or more in vitro assays. Since these statistical models provide key information with respect to structural features and biological activity they can be used as starters for further optimization. Further, a QSAR model must contain compounds with an unbiased variation of the molecular features spanning the chemical space held to be significant for interaction with the protein target.
In our published research work,7 a series of 70 compounds dataset containing 1,2,3-triazole benzene sulfonamide derivatives with human carbonic anhydrase IX inhibitory activity from the in vitro studies of P. K. Sharma et al.8–10 were subjected to QSARINS software for developing validated models using 3D-MoRSE molecular descriptors. The best QSAR model with MoRSE molecular descriptors thoroughly validated the dataset with efficient statistical parameters. Further compounds designed were tested for prediction power and subsequently molecular docking studies were done. Fig. 1 display the leads generated from our previous work7 along with their predicted bioactivities.
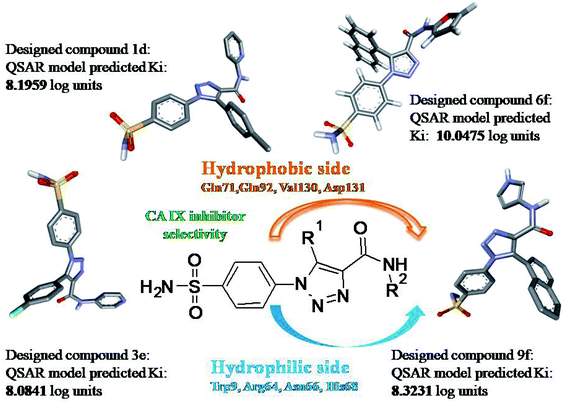 | ||
| Fig. 1 Leads generated from our previous studies displaying naphthyl, methylphenyl, fluorophenyl substituents on triazole ring at R1 position and heterocyclic rings at R2 position. | ||
The designing and optimizing a new drug candidate is a challenging process which can be accelerated by computational drug discovery utilizing molecular dynamics simulations. High computing power with graphic processing units is indeed beneficial for calculating molecular descriptors. Utilizing the best quantitative structure–activity relationship model generated in our published work,7 the lead compounds with carbonic anhydrase IX inhibitory activity were considered as template (Fig. 1) for investigating a novel series of triazole benzene sulfonamide derivatives with good predicted bioactivity. The best five designed compounds were subjected to receptor binding interactions using Autodock V 4.2 and stability of the top binding complex was validated by molecular dynamics simulations using Desmond V 5.9 in comparison with pre-clinical reference molecule, SLC0111. The binding free energy estimation was done to validate the binding affinity and further the stability and interactions of the complex were assessed through dynamics simulation studies.
2. Results and discussion
2.1. Designed compounds
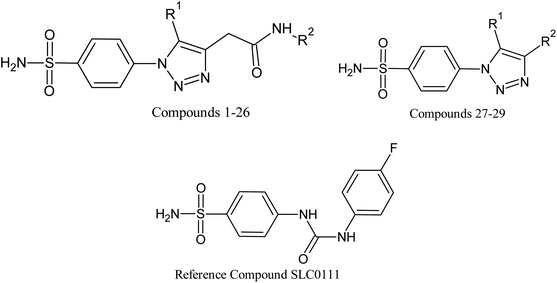
Based on positively correlated structural and molecular descriptor information from the QSAR model (pKi = 2.0573 + 3.3553 (MoRSEV22) + 16.4033 (MoRSEC17) + 0.2339 (MoRSEV1) + 2.0175 (MoRSEC4) + 0.1158 (MoRSEE22)), the triazole benzene sulfonamide core structure was explored with alkyl carboxamide linkers on triazole along with heterocyclic ring on tail. ESI Table 1† display the structural information of dataset compounds utilized for QSAR model generation and the best leads obtained. Utilizing the lead structure as template, twenty nine designed molecules were subjected to the descriptor calculation tools of ChemDes–ChemoPy servers to calculate the respective MoRSEV22, MoRSEC17, MoRSEV1, MoRSEC4 and MoRSEE22 values. Usually, the MoRSE descriptors were (molecular representation of structure by electron diffraction) weighted by volume, atomic charges, Sanderson's electronegativity etc. along with the scattering parameter from 1 to 31. Table 1 displays structure of 29 best designed compounds with nano/subnano-molar predictions along with molecular descriptor values utilized for the predicted bioactivity.From the Table 1, it was clear that N-pyridyl-3-yl group at R2 position (compound 1) of triazole ring have shown better predicted activity (pKi = 9.13), whereas ortho and para positions of the same group doesn't enhance activity (compounds 10, 12, 18, 21). It was notable that, N-piperidin-4-yl group at R2 position and 4-methylphenyl group at R1 position (compound 2) of triazole ring have shown better predicted activity (pKi = 9.65), whereas R1 groups with fluorophenyl, naphthyl, methoxy phenyl groups displayed lesser activity (compounds 14, 19 and 22 respectively). N-[3-(1-Methylpyrrolidin-2-yl)pyridin-4-yl] group at R2 position along with methoxyphenyl group at R1 position (compound 24) have shown better predicted activity (pKi = 10.03) compared to 4-methylphenyl group at R1 position (compound 4). R1 position with methyl [4-methylbenzene]-1-sulfonate group favored the structure (compound 27) having predicted bioactivity value 10.1037.
From the QSAR studies and the designed compounds prediction, it was clear that methyl carboxamide linker on triazole ring along with the N-pyridyl-3-yl heterocyclic ring have shown better predicted bioactivity. Substituting bulkier groups both at R1 and R2 position or increasing alkyl chain length between triazole and tail heterocyclic ring resulted in decreased bioactivity. ESI Table 2† displays molecular descriptor contribution information of the designed compounds for predicted bioactivity.
2.2. Molecular docking studies
The designed compounds with best pKi values were subjected to the molecular docking studies for binding affinity and H-bond interactions prediction. The selected compounds (1, 2, 20, 24 and 27) and the reference compound SLC0111 have shown good interactions and binding affinity scores. Compound 1 with N-pyridyl-3-yl group interacted with Val130 and Asp131 by the hydrogen bonding. The sulfonamide oxygen on p-phenylene moiety interacted with Thr200, Thr201 via H-bond and the nitrogen of sulfonamide bonded with Zn264. The methyl group of methylphenyl moiety on tail showed Pi–Pi interactions with Leu91. The best conformation of compound 1_5FL4 complex from Autodock displayed binding affinity as −8.1 K cal mol−1.Likewise, the H-bond interactions were predicted in compound 2 with the residues Zn264, Thr200, Gln71, Trp9 and His94 of 5FL4 protein. Compound 2 displayed H-bonds near to the triazole ring with Gln71 followed by the oxygen of sulfonamide on p-phenylene ring interaction with Thr200 and Thr201. The Asn66 interacted with the oxygen of carboxamide linker forming a favorable H-bond. The phenyl group attached to the sulfonamide group displayed Pi–Pi interaction with His94. The compound 2 displayed binding affinity of −8.2 K cal mol−1 with 5FL4. The reference molecule SLC0111, an uriedo substituted benzene sulfonamide under clinical trials for carbonic anhydrase inhibition imparted H-bond interactions with the residues Thr200, Thr201, Gln92, Leu91 and Val130 of 5FL4 protein. The SLC0111 displayed H-bonds with uriedo oxygen group linked to Gln92 followed by the oxygen of sulfonamide on p-phenylene ring interaction with Thr200 and Thr201. Val130 and Leu91 interacted with the fluoro-phenylene ring forming favorable pi-bonds. The compound SLC0111 showed binding affinity of −7.9 K cal mol−1 with 5FL4.
H-bond interactions were observed in compound 20 with the residues Thr200, Thr201, His68, Gln92 and Asp131 of 5FL4 protein. Compound 20 with nitrogen on triazole ring interacted with His68 and Gln71 by the hydrogen bonding followed by oxygen on carboxamide linker interaction with Asp131. The naphthalen-1yl group at R1 position on triazole ring interacted with Gln92 and Val130 by pi–pi stacking. The compound 20 displayed binding affinity of −8.1 K cal mol−1 with 5FL4. Compound 24 displayed favorable interactions with Thr200, Thr201, Leu199, Val130, Gln92 and Asp131. It was noticed that Pi–Pi stacking being more predominant in compound 24 with the residues Val130, Gln92, Asp131 and Leu199. The compound 24 displayed binding affinity of −8.3 K cal mol−1 with 5FL4. The ESI Fig. 1† shows the docking interactions of compound 1 (top left), compound 2 (top right), compound 20 (bottom left), and compound 24 (bottom right).
Favorable interactions were predicted in compound 27 with the residues Zn264, Thr200, Thr201, His68, Asn66, Gln92, Val130, Gln71 and Leu91 of 5FL4 protein. Compound 27 displayed H-bonds with the nitrogen of triazole ring and His68 followed by the oxygen of sulfonamide on p-phenylene ring interaction with Thr200 and Thr201. Pro202 interacted with the methyl group of alkyl carboxamide linker forming a favorable H-bond. Phenyl group attached to the sulfonate group displayed Pi–Pi interaction with Val130 and the oxygen attached to the sulfonate group displayed interaction with Val121. The compound 27 displayed binding affinity of −9.2 K cal mol−1 with 5FL4. Fig. 2 shows the docking interactions of SLC0111 (top) and compound 27 (bottom) with 5FL4 from the Discovery studio visualizer. Table 2 enlists favorable interactions with binding energy scores for the docked compounds.
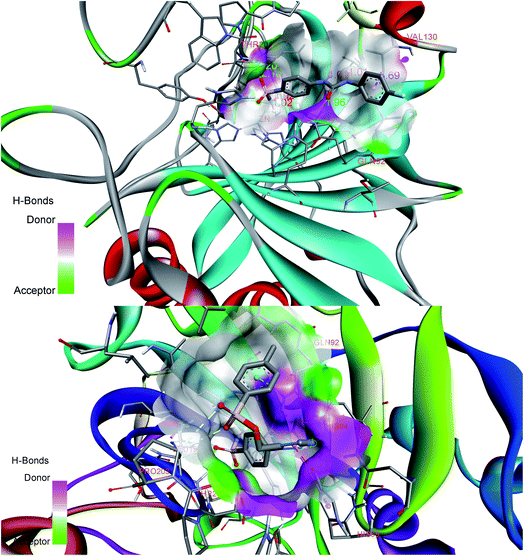 | ||
| Fig. 2 Docking interactions of reference compound SLC0111 (top) and designed compound 27 (bottom) displaying donor–acceptor regions in the active site cavity of hCA IX (5FL4). | ||
| Compound | Binding energy (K cal mol−1) | H-bond interactions (distance in Å) |
|---|---|---|
| 1 | −8.1 | Sulfonamide oxygen interact with Thr200 (2.48) and Thr 201 (2.39), tosyl methyl group interact with Leu91 (4.44), pyridyl nitrogen interact with Asp131 (3.18), Val130 (5.03) |
| 2 | −8.2 | Sulfonamide oxygen interact with Thr200 (2.19) and Thr201 (2.29), phenyl group linked to sulfonamide interact with His94 (4.74), tosyl methyl group interact with Trp9 (5.22) and Pro203 (4.92), triazole nitrogen interact with Gln71 (2.11), carbonyl oxygen of carboxamide linker interact with Asn66 (1.98) |
| 20 | −8.1 | Sulfonamide oxygen interact with Thr200 (2.21) and Thr201 (2.29), phenyl group linked to sulfonamide interact with Leu199 (5.49), triazole nitrogen interact with Gln71 (2.47) and His68 (2.01), naphthyl group interact with Gln92 (3.14) and Val130 (5.02) |
| 24 | −8.3 | Sulfonamide oxygen interact with Thr200 (2.18) and Thr201 (2.28), phenyl group linked to sulfonamide interact with Leu199 (4.84), tosyl phenyl group interact with Val130 (4.34) and Gln92 (3.16), nitrogen of carboxamide linker interact with Asp131 (2.33) |
| 27 | −9.2 | Sulfonamide oxygen interact with Thr200 (2.25), triazole ring linked to His68 (2.35), methyl group of triazole tail interact with Pro202 (3.69), oxygen group of sulfonate linker interact with Val121 (3.11) and Pro203 (3.78), tosyl phenyl group interact with Val130 (4.82), tosyl methyl group interact with Leu91 (3.95) |
| SLC0111 | −7.9 | Sulfonamide oxygen interact with Thr200 (2.18) and Thr201 (2.20), oxygen of uriedo group interact with Gln92 (1.96), phenyl group of fluorophenyl tail interact with Leu91 (5.02) and Val130 (4.24) |
2.3. Prediction of ADMET by computational analysis
Pharmacokinetic properties of compounds were determined using the pkCSM server.11 The ADMET parameters were calculated and checked for agreement with their standard ranges. The ADMET properties of docked compounds were presented in ESI Table 3.† A compound with high Caco-2 permeability will be easily absorbed when the Papp coefficient value was >8 × 10⁻⁶ (i.e. the predicted value >0.90). None of the selected compounds were predicted to have high Caco-2 permeability. Intestinal absorption (human) capacity of the compound will be poor if the absorption is less than 30%. All the compounds were predicted to have a good intestinal absorption pattern. The log![[thin space (1/6-em)]](https://www.rsc.org/images/entities/char_2009.gif) Kp > −2.5 is considered to be relatively low skin permeability value of the compound. The results suggest that the compounds were found in limits for skin permeability value. P-Glycoprotein which is a member of ATP-binding cassette can excrete drugs or other exogenous chemicals from cells. All the compounds were found to be substrates of P-glycoprotein and thus may be actively removed from cells.
Kp > −2.5 is considered to be relatively low skin permeability value of the compound. The results suggest that the compounds were found in limits for skin permeability value. P-Glycoprotein which is a member of ATP-binding cassette can excrete drugs or other exogenous chemicals from cells. All the compounds were found to be substrates of P-glycoprotein and thus may be actively removed from cells.
The distribution of drugs in tissues in vivo can be characterized by distribution volume, VDss. If VDss is lower than 0.71 L kg−1 (or) log![[thin space (1/6-em)]](https://www.rsc.org/images/entities/char_2009.gif) VDss < −0.15 then the distribution volume is considered to be low. Also, if VDss is greater than 2.81 L kg−1 (or) log
VDss < −0.15 then the distribution volume is considered to be low. Also, if VDss is greater than 2.81 L kg−1 (or) log![[thin space (1/6-em)]](https://www.rsc.org/images/entities/char_2009.gif) VDss > 0.45 then the distribution volume is considered to be high. The compound 24 have shown good distribution volume compared to others. With respect to blood–brain barrier membrane permeability, the compound with log
VDss > 0.45 then the distribution volume is considered to be high. The compound 24 have shown good distribution volume compared to others. With respect to blood–brain barrier membrane permeability, the compound with log![[thin space (1/6-em)]](https://www.rsc.org/images/entities/char_2009.gif) BB > 0.3 can cross the blood–brain barrier easily and log
BB > 0.3 can cross the blood–brain barrier easily and log![[thin space (1/6-em)]](https://www.rsc.org/images/entities/char_2009.gif) BB < −1 will make the compound difficult to cross the blood–brain barrier. All the selected compounds were predicted to have difficulty in crossing the blood–brain barrier. If log
BB < −1 will make the compound difficult to cross the blood–brain barrier. All the selected compounds were predicted to have difficulty in crossing the blood–brain barrier. If log![[thin space (1/6-em)]](https://www.rsc.org/images/entities/char_2009.gif) PS is less than −3 then the compounds were predicted to be unable to penetrate the CNS. The results show that compounds 1, 20 and SLC0111 cannot penetrate the CNS. Cytochrome P450s can determine whether the compound can get metabolized or not. The major metabolizing enzymes CYP3A4, CYP2D6, CYP2C9 and CYP2C19 were studied for the compound substrate/inhibition capacity. The results showed that compound 27 is CYP1A2 inhibitor whereas compounds 1, 2, 20, 24 were CYP3A4 substrates. The molecular weight and hydrophilicity of compounds determine drug elimination capacity. The prediction results show that the total clearance of compound 2 is the highest followed by compounds 24, 20, 1, SLC0111 and 27.
PS is less than −3 then the compounds were predicted to be unable to penetrate the CNS. The results show that compounds 1, 20 and SLC0111 cannot penetrate the CNS. Cytochrome P450s can determine whether the compound can get metabolized or not. The major metabolizing enzymes CYP3A4, CYP2D6, CYP2C9 and CYP2C19 were studied for the compound substrate/inhibition capacity. The results showed that compound 27 is CYP1A2 inhibitor whereas compounds 1, 2, 20, 24 were CYP3A4 substrates. The molecular weight and hydrophilicity of compounds determine drug elimination capacity. The prediction results show that the total clearance of compound 2 is the highest followed by compounds 24, 20, 1, SLC0111 and 27.
The results suggest that none of the selected compounds were toxic in AMES toxicity test, whereas hepatotoxicity studies need to be explored. The compounds did not inhibit the hERG I channel and thus may not have cardiotoxicity or skin sensitization. The predicted results for the ADMET characteristics were quite favorable and further detail studies will certainly be helpful in predicting the fate of the compounds.
2.4. Molecular dynamics simulations studies
The molecular docking analyses have shown details about the complex binding modes (protein-inhibitor), but smallest discrepancy can be assessed by simulating molecular dynamics.12 Utilizing the best interactions and energy docked conformation obtained from Autodock results the compound 27 was explored for the possible atomic details within the solvent system. The SLC0111, ureido-substituted benzene sulfonamide in phase I clinical trials as carbonic anhydrase inhibitor was chosen as the reference compound. The best active conformation based on H-bond interactions, RMSD and energy value was considered for the MDS study. A 100 ns simulation has been performed for establishing the stability of the protein-inhibitor complex and further we investigated the simulation.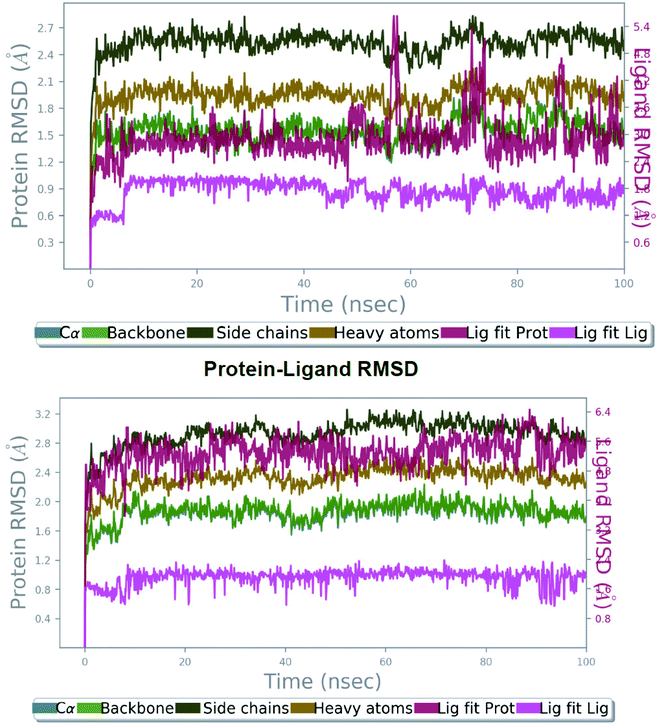 | ||
| Fig. 3 The root mean square deviation (RMSD) of protein 5FL4 relative to the starting complexes during 100 ns MD trajectory for SLC0111 (top) and compound 27 (bottom). | ||
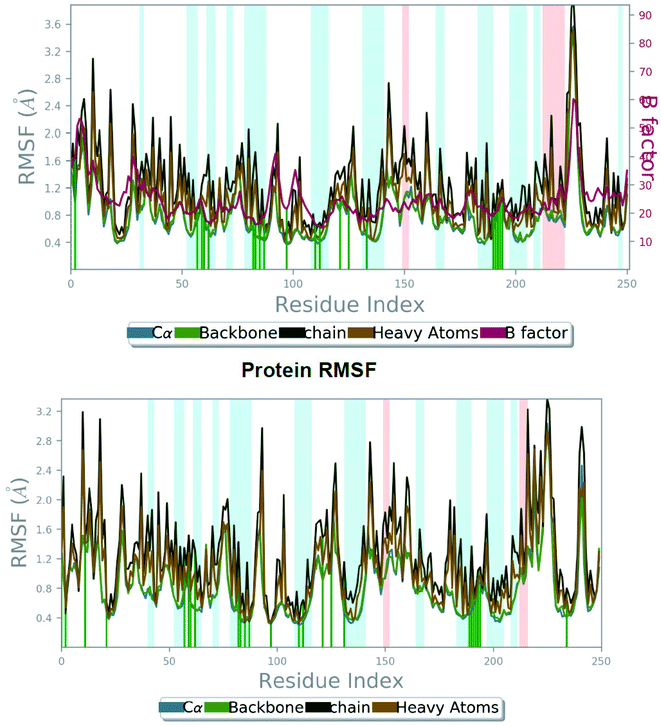 | ||
| Fig. 4 The root mean square fluctuation (RMSF) of 5FL4 protein during 100 ns MD, representing local changes along the protein chain for SLC0111 compound (top) and compound 27 (bottom). | ||
Investigation of MD simulation of the reference molecule presented water-bridge and hydrogen bonding and hydrophobic interactions within the stable regions Tyr195–Pro202, Ile118–Ala126 and Leu63–His68. For SLC0111 the residues Gln92, Glu71 and Pro202 interacted by water bridge and hydrogen bonding (Fig. 5 top). Apart from zinc interaction and the hydrogen bond with Thr200 throughout MD simulation, residues Glu106 and His119 have shown hydrogen bonding with ionic interactions. The residues Pro202, Gln71 and Gln92 showed hydrogen bonding with water bridges. His94 showed hydrophobic as well as ionic interaction followed by the His68 with both hydrophobic and water-bridge interaction. The above mentioned residues played a significant role at the active binding site and have been vital for the stabilization of reference molecule, SLC0111 inside the cavity.
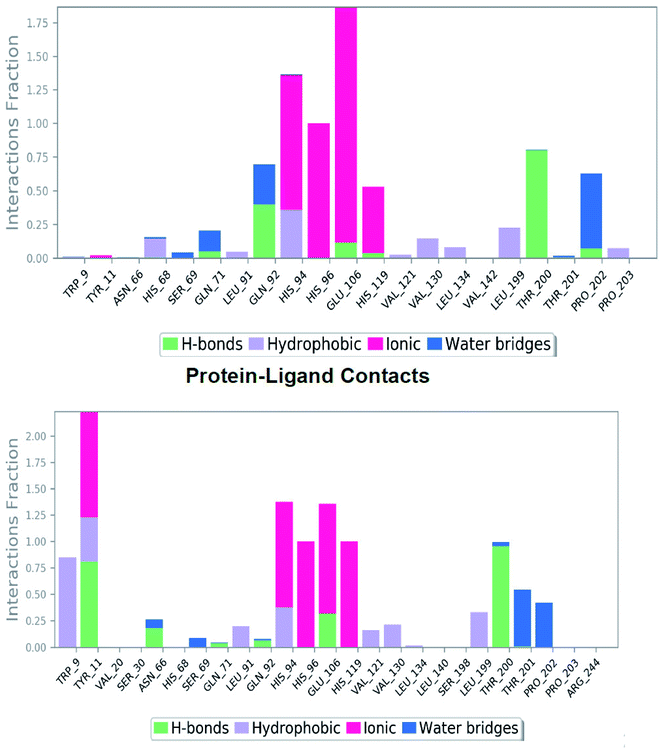 | ||
| Fig. 5 The plot represents the hydrogen bonding interactions of reference molecule SLC0111 (top) and compound 27 (bottom) with respect to residues of 5FL4 during 100 ns MD simulation. | ||
The simulation determined the presence of a number of hydrogen bonds with good frequencies throughout the simulation. In addition, Thr200 (–S![[double bond, length as m-dash]](https://www.rsc.org/images/entities/char_e001.gif) O–H–O–Thr) was shown to provide stable conformation of the SLC0111 at the active site in 78% of the simulated period. Hydrogen bond–water bridge networks were shown as,
O–H–O–Thr) was shown to provide stable conformation of the SLC0111 at the active site in 78% of the simulated period. Hydrogen bond–water bridge networks were shown as,
(1) The nitrogen attached to fluorophenyl ring through preserved water molecule with residue Pro202 in 30% of the MD simulation.
(2) The nitrogen attached to benzene sulfonamide ring through preserved water molecule with residue Pro202 in 25% of the MD simulation.
Two hydrogen bond interactions have been predicted in the phenyl ring attached to sulfonamide group with residues His94 and His68 in 36% and 13% of the MD simulation respectively. The hydrophobic contacts found in the SLC0111_5FL4 complex were with residues Pro203, Val130, Leu134, Leu199, Val121, Val142, Leu91 and Trp9 (Fig. 6 top). The hydrogen bonding has been evaluated throughout the simulation duration indicating the reference molecule has an inhibiting capacity due to the presence of additional water bridges.
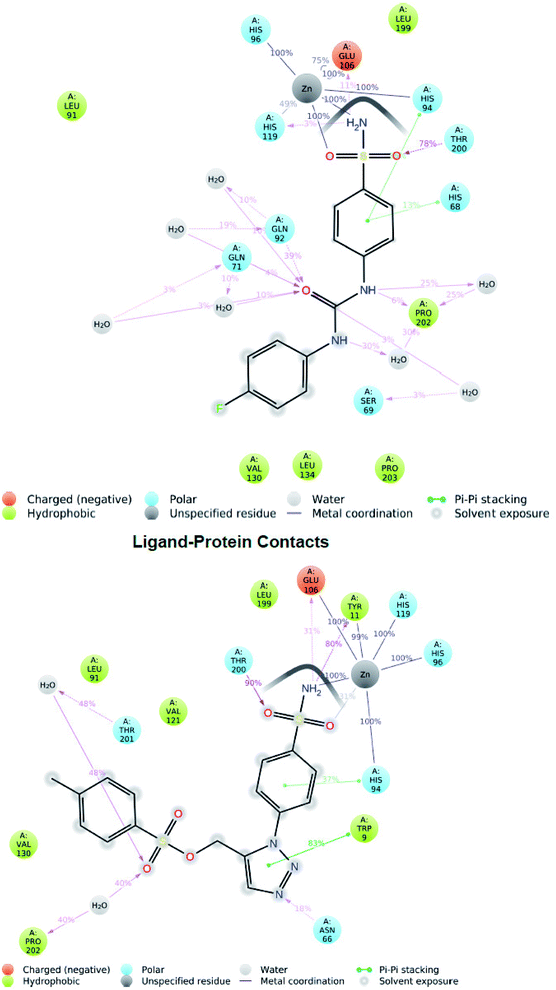 | ||
| Fig. 6 Two-dimensional diagram of reference molecule SLC0111_5FL4 interaction (top) during 100 ns MD simulation and hit molecule compound 27_5FL4 interaction (bottom). | ||
The hardness of protein structure was estimated using the ROG (radius of gyration). The SLC0111_5FL4 complex has been examined in order to determine the influence of the reference molecule on the overall protein tightness (5FL4) and was found to be mildly stretched by maintaining a range of 17.6–17.15 Å throughout the simulation (ESI Fig. 2† top). The reference molecule SLC0111 showed steady gyration radius with an average value of 4.707 Å after 100 ns MD simulation. A low solvent-accessible surface area (SASA) of 71.679–217.902 Å2, a high PSA (polar surface area) of 193.211–210.86 Å2 and low MolSA (molecular surface area) of 280.159–268.451 Å2, were also found in the reference molecule, which helped to ensure its stability throughout a 100 ns MD simulation (ESI Fig. 3† top).
From Fig. 4 (bottom), we can observe evidently that the protein backbone RMSF value of the catalytic domain of compound 27_5FL4 complex showed in the range of 0.343 to 2.935 Å signifying moderate fluctuations of the protein compared to RMSF range of the reference compound complex. In RMSF graph major peaks were indicated with important backbone residue positions such as Tyr11–Gly13 (RMSF, 1.073 Å), Arg64–His68 (RMSF, 0.883 Å), His96–Gly101 (RMSF, 1.548 Å), Glu106–Gly111 (RMSF, 0.619 Å), Ile118–Ala126 (RMSF, 1.075 Å), Val130–Glu132 (RMSF, 1.121 Å), Ala133–Gly135 (RMSF, 1.704 Å), Tyr195–Thr200 (RMSF, 0.669 Å), Thr201–Pro203 (RMSF, 0.904 Å) and Arg244–Gly251 (RMSF, 2.042 Å) of ligand 27/5FL4 complex. It was found that His68 (believed to be involved in proton shuttle pathway) have shown nearby fluctuation values in the compound 27_5FL4 complex (0.883 Å) and the SLC0111_5FL4 complex (0.879 Å). It was also noticed that Thr200, Gln92, Pro202 residues has less fluctuations in the compound 27_5FL4 complex.
Investigation of the compound 27 MD simulation presented hydrogen bonds, water bridges and hydrophobic interactions within the stable regions Tyr11–Gly13, Arg64–His68, Ile118–Ala126, Tyr195–Thr200 and Thr201–Pro203. The residues Gln92, Gln71, Asn66 and Thr200 interact with the compound 27 utilizing water-bridge and hydrogen bond (Fig. 5 bottom). Beside zinc interactions, the residues Glu106, Thr200, Gln71, Tyr11 and Gln92 showed a significant action at the binding site as well as been considered vital for the stability of the compound 27 inside the cavity. The compound 27 displayed the presence of hydrogen bonds with good frequencies throughout the simulation. Tyr11 (SO2NH2–H–O–Tyr) was noticed to be responsible for creating an active conformation of compound 27 at the binding site in 80 percent of the simulated period by forming side chain interaction with the binding site. The hydrogen bond networks has been revealed with Pro202 oxygen attached to the fluoro phenyl sulfone group through preserved water molecule in 40% of the MD simulation and Thr201 oxygen attached to the fluoro phenyl sulfone group through preserved water molecule in 48% of the MD simulation. Pi–Pi stacking was seen with ligand triazole ring attached to the Trp9 nitrogen in 83% of the MD simulation and phenyl ring attached to the triazole interact with His94 in 37% of MD simulation. The hydrophobic contacts of the compound 27_5FL4 complex include Val130, Leu199, Val121, Leu91, Trp11, Pro202 and Trp9 (Fig. 6 bottom).
The complex of compound 27_5FL4 was investigated to study the radius of gyration effect,13 of ligand–protein complex and was found to be in the range of 17.48–17.15 Å during the simulation (ESI Fig. 2† bottom). “Extendedness” of a ligand calculated by gyration radius (rGyr) of compound 27 showed average value of 4.591 Å after 100 ns MD simulation. Upon comparison with reference compound SLC0111, the compound 27 displayed better results with a low SASA of 62.304–170.903 Å2, high PSA (polar surface area) of 243.54–275.287 Å2, and MolSA (molecular surface area) of 334.938–357.816 Å2, contributing to maintain the stability throughout the simulation (ESI Fig. 3† bottom).
2.5. Post-docking analysis for predicting conformational change
The post-docked complex having H-bond interactions with Thr200, Thr201, Asn66, His68 and Gln92 was subjected to the molecular dynamic simulation study and after 20 ns of simulation; the trajectory frame has been studied for the analysis of a new type of bonding. One can observe the flip in the triazole ring as well as changes in the conformation of the benzene ring. This position of the ligand enables to form additional hydrogen bond with the Trp9 and oxygen of the sulfonate group. The detailed picture of the interactions identified in post-dock conformation (top image) and after 20 ns simulation (bottom image) has been shown in the Fig. 7. The His68, Asn66 were allocated in the loop region of the hCA IX protein (5FL4) and due to this, the interactions with the triazole ring were favorable leading to greater flexibility of the tail region. Gln71 was seen forming a hydrogen bond with nitrogen of triazole ring after 20 ns simulation whereas in post-docking pose, Gln71 was found to have van der Waals contact with triazole ring. Further study of the complex up to 100 ns simulation, H-bond interactions seems to be better and stability of the complex was noticed with favoring bond distances.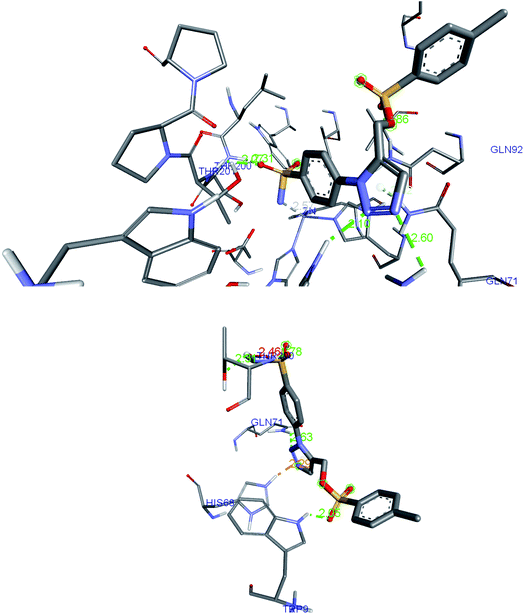 | ||
| Fig. 7 The H-bond interactions of compound 27 identified in post-dock conformation (top image) and after 20 ns MD simulation (bottom image) in complex with 5FL4. | ||
2.6. Estimation of binding free energy
Gibbs free energy from the molecular mechanics-generalized born surface area (MM-GBSA) analysis shows significant relationship between the experimental and predicted binding affinity. For polar solvation term, the OPLS forcefield based molecular mechanics energies with variable dielectric generalized born 2.0 (VSGB) solvation model was utilized which incorporates residue dependent effects.14 In Prime MM-GBSA method, the nonpolar solvation terms, i.e., solvent-accessible surface area (SASA) were incorporated along with the van der Waals interactions to estimate the binding free energy (ΔGbind) of the final docked complex.15 The docked conformations were optimized and minimized using the OPLS-2005 force field. The binding free energy of 5FL4 protein and ligand complex was carried out in Prime MM-GBSA (molecular mechanics generalized born surface area). The binding free energies of receptor–ligand complexes were calculated using the Prime module of Schrodinger suite with the OPLS-2005 force field. The binding free energy was calculated using free energy difference between complex and sum of individual free energies of protein and ligand.| ΔG(binding) = ΔG(complex) − ΔG(protein) − ΔG(ligand) |
From Desmond calculations, the RMSD increment of the ligand 27 indicates a new binding mode which was explored further to identify any influence on binding energy using the MM-PBSA (Poisson Boltzmann surface analysis) and the MM-GBSA calculations. The binding free energies for the complex 5fl4_compound 27 in both MM-GBSA and MM-PBSA were tabulated in Table 3. The complex interactions were mostly favored by van der Waals (−37.5948 K cal mol−1) in both methods in contrast to less contribution from electrostatic (−7.8915 K cal mol−1). In protein-inhibitor complex formation, the polar solvation energy was revealed to be favorable (−16.2354 K cal mol−1 in MM-GBSA and −18.6516 K cal mol−1 of MM-PBSA). The net binding energy for the complex predicted by MM-GBSA was −69.1804 K cal mol−1 which revealed more complex stability compared to the one accomplished by MM-PBSA (−68.238 K cal mol−1). Increased binding energy in MM-GBSA shows that the new type of conformation pose in binding can be more energetically favorable. The net energy differences in MM-PBSA and MM-GBSA techniques were found to be robust.
| Energy component | Average | Std. dev. | Std. err. of mean |
|---|---|---|---|
| Generalized born | |||
| van der Waals | −37.5948 | 2.558 | 0.256 |
| EEL | −7.8915 | 2.6585 | 0.266 |
| EGB | −16.2354 | 1.6354 | 0.164 |
| ESURF | −7.4587 | 0.2542 | 0.254 |
| ΔGgas | −45.4863 | 2.7856 | 0.279 |
| ΔGsolv | −23.6941 | 1.4523 | 0.145 |
| ΔGtotal | −69.1804 | 1.5642 | 0.156 |
![[thin space (1/6-em)]](https://www.rsc.org/images/entities/char_2009.gif) |
|||
| Poisson Boltzmann | |||
| van der Waals | −37.5948 | 2.558 | 0.256 |
| EEL | −7.8915 | 2.6585 | 0.266 |
| EPB | −18.6516 | 1.8564 | 0.186 |
| ENPOLAR | −4.1001 | 0.2654 | 0.265 |
| EDISPER | 0.0000 | 0.0000 | 0.000 |
| ΔGgas | −45.4863 | 2.8651 | 0.287 |
| ΔGsolv | −22.7517 | 1.6522 | 0.165 |
| ΔGtotal | −68.238 | 2.4215 | 0.242 |
3. Experiment and methods
3.1. Established QSAR model
The steps of the QSAR modeling study encompass the following steps: data compilation, integration, data curation, model generation and model validation. The extensive study of obtained molecular descriptors provided structural and bioactivity relation using associated algorithm. In our case, MoRSE descriptors, 3D molecular representations of structure based on electron diffraction descriptors weighted by volume, atomic charges and Sanderson's electronegativity played important role in determining bioactivity. Weighting molecular descriptors make the molecule sensitive to the presence of specific fragments present on them. We observed that the scattering parameter which was fluctuating at higher terms usually above 26 threshold value disturbs the model efficiency particularly polarizability and ionizability weighing terms. However, the published QSAR model mentioned below doesn't show much fluctuation in values on repetitive experiments. The residual values obtained using the attained QSAR model display that there was not much bioactivity deviation from the experimental inhibition value.7 The selected QSAR model providing structural information helped in developing potent compounds with better CA IX inhibitory activity.Model details
| pKi = 2.0573 + 3.3553 (MoRSEV22) + 16.4033 (MoRSEC17) + 0.2339 (MoRSEV1) + 2.0175 (MoRSEC4) + 0.1158 (MoRSEE22) |
3.2. Designing compounds: conformer generation and molecular alignment
From our previous study, the interaction along hydrophobic and hydrophilic region of the CA IX active site provided valuable information for designing inhibitors. The twenty nine designed compounds listed in Table 1 with diverse heterocyclic rings, functional groups and triazole chain linkers were geometry optimized and subjected to the Avogadro tool to generate low energy conformers. The best representatives of low energy conformers obtained for each ligand were taken over for the docking study.3.3. Molecular docking
The above conformations were subjected to molecular docking studies to study the residue interactions, H-bonds and binding energy scores.18 The original configuration of hCA IX, pdb 3D structure: 5FL4 was derived from the protein database (www.rcsb.org). Using the Modeller V 9.23 program19 missing residues were fixed following the addition of hydrogen atoms and removal of existing ligands. The co-crystallized ligand has been redocked to 5FL4 active site for the identification of docking parameters. Protein was prepared by adding polar hydrogens following Kollman's united atomic charges. The histidine protonation residue states were examined using PDBFixer tool20 where ND1 was assigned to zinc-bound histidines and NE2 to the residual histidines. Ligand file was prepared by adding polar hydrogens and applying Gasteiger charges. The Autogrid option makes it possible to choose an active site and to set the grid size to 60 × 60 × 60 points having 0.375 Å spacing and calculate the energetic map with a distance-dependent dielectric constant function. Autodock bound parameters file was subjected to ensure correct radius, well-depth, and charges associated with the metalloprotein. The grid box comprises the enzyme's active binding site and provides enough space to rotate and translate the ligand. For ligand conformation poses, orientations inside the active site hCA IX were employed in the Lamarckian genetic algorithm. The following were the optimized parameters; maximum energy assessments were raised to 25![[thin space (1/6-em)]](https://www.rsc.org/images/entities/char_2009.gif) 000
000![[thin space (1/6-em)]](https://www.rsc.org/images/entities/char_2009.gif) 000 per run in the population, and the gene mutation rate was 0.02. For the performance of the docking, all other parameters were set to the default and the metal parameters were added. The search algorithm analysis generates ligand pose at the CA IX binding site, taking into concern the roto-translational walk and internal degrees of freedom of the ligand. Best poses were identified by means of the binding affinity and pose retrieval was done using the Discovery Studio non-bonding interaction visualizer. The RMSD values between the reference and the predicted structures were used to confirm whether the docking simulation has predicted a close-match docked pose or not.
000 per run in the population, and the gene mutation rate was 0.02. For the performance of the docking, all other parameters were set to the default and the metal parameters were added. The search algorithm analysis generates ligand pose at the CA IX binding site, taking into concern the roto-translational walk and internal degrees of freedom of the ligand. Best poses were identified by means of the binding affinity and pose retrieval was done using the Discovery Studio non-bonding interaction visualizer. The RMSD values between the reference and the predicted structures were used to confirm whether the docking simulation has predicted a close-match docked pose or not.
3.4. Molecular dynamics simulations
The molecular dynamics simulations have been performed by utilizing “Desmond V 5.9 package” (Schrodinger 2019-3) to investigate the changes with solvent system in the protein–ligand complex conformation.21 The OPLS forcefield was used for the MDS of docked complex (ligand_5FL4).22,23 In an orthorhombic cubic box, the position of complex has been centered as well as TIP3P water molecules were filled along with buffers at a 10 Å distance between box edge & protein atom for dynamics simulations. The boundary condition box volume has also been computed as per complex type along with counter ions including Na+ & Cl− which have been added to neutralize the system randomly. The SLC0111, an ureido-substituted benzene sulfonamide in clinical trials was selected as the reference compound for comparison of simulation results of compound 27. The SLC0111_5FL4 complex contains more than 31![[thin space (1/6-em)]](https://www.rsc.org/images/entities/char_2009.gif) 508 atoms with 9209 waters and predicted lead complex compound 27_5FL4 contains 28
508 atoms with 9209 waters and predicted lead complex compound 27_5FL4 contains 28![[thin space (1/6-em)]](https://www.rsc.org/images/entities/char_2009.gif) 252 atoms with 8124 waters beside ∼458
252 atoms with 8124 waters beside ∼458![[thin space (1/6-em)]](https://www.rsc.org/images/entities/char_2009.gif) 000 Å3 box volume for MD simulations.
000 Å3 box volume for MD simulations.
Using Desmond protocol, the minimization of the solvated built system was performed utilizing OPLS-2005 forcefield parameters followed by relaxation. Utilizing the Berendsen NVT ensemble, the system was simulated keeping the temperature at 10 K for restraining heavy atoms on the solute. The MDS was performed with the temperature of 300 K, pressure 1 atm and thermostat relaxation time of 200 ps under isothermal isobaric ensemble (NPT).24 During MD simulations, the Nose–Hoover thermostat25 and the Martyne–Tobias––Klein barostat26 approaches have been accompanied for maintaining the pressure and temperature scale at 300 K and 1 atm respectively. The progress of the simulation was recorded step by step every 50 ps. The NPT ensemble was initiated following the simulation process which runs for 100 ns production. For investigating the trajectories, the frames have been gathered and examined using the simulation interaction diagram which helped in determining fluctuations.
4. Conclusion
Theoretically predicted active compounds were designed using QSAR model exhibited a meaningful relationship with carbonic anhydrase IX inhibition. The structural findings suggest that N-pyridyl-3-yl group on methyl carboxamide chain have shown better predicted bioactivity at R2 position of triazole ring but ortho, para position of pyridyl group were not favorable. Further, QSAR model correlating compounds with hCA IX inhibitory activity was performed to identify the role of various heterocyclic rings on the core structure having methyl carboxamide linker. Docking results analyzed nonbonding interactions in the active site of enzyme favoring hydrogen bonding with Thr200, Val130, Gln92, Gln71 and His68. Designed compounds 1, 2, 20, 24 and 27 with good binding energy values showed better predictions with both QSAR model and molecular docking. The theoretical ADMET predictions of selected compounds need further experimental studies; however compound 27 with good interactions has been studied by molecular dynamics simulations.MD simulation of the top scoring compound 27 in complex with 5FL4 presented well built H-bond interaction with Thr200, Gln92 and Gln71 residues in the active site region. Analysis of hydrogen bonding, RMSF, RMSD, and RoG of active compound 27 showed up steady nature of the complex with predicted pKi value of 10.104 (∼0.07 nM) exhibiting human carbonic anhydrase IX inhibitory potential. The predicted bioactivity of compound 27 on comparison with the inhibitory potential of SLC0111 (25 nM) was potent and need further experimental results to consider compound 27 as the lead. MM-PBSA, MM-GBSA binding free energy analysis of compound 27 showed low energy at the hCA IX active site interface. Hence, the best hit compound 27 (∼0.07 nM) with good predicted activity could be a promising theoretical lead candidate for the hCA IX (5FL4) inhibition targeting cancer.
Author contributions
GP: conceptualization, data curation, investigation, methodology, validation, writing-original draft. MK: resources, software, supervision, writing-review & editing.Conflicts of interest
There are no conflicts to declare.Acknowledgements
We thank the Research Council of SRMIST for constant support and encouragement.References
- R. Gieling and K. Williams, Bioorg. Med. Chem., 2013, 21(6), 1470–1476, DOI:10.1016/j.bmc.2012.09.062.
- E. Svastova, N. Zilka, M. Zatovicova, A. Gibadulinova, F. Ciampor and J. Pastorek, Exp. Cell Res., 2003, 290, 332–345 CrossRef CAS PubMed.
- N. Robertson, C. Potter and A. L. Harris, Cancer Res., 2004, 64, 6160–6165 CrossRef CAS PubMed.
- A. Nocentini and C. T. Supuran, Expert Opin. Ther. Pat., 2018, 28, 729–740, DOI:10.1080/13543776.2018.1508453.
- C. T. Supuran, Expert Opin. Drug Metab. Toxicol., 2016, 3, 1–9 Search PubMed.
- C. T. Supuran, Biochem. J., 2016, 473, 2023–2032, DOI:10.1042/BCJ20160115.
- P. Gopinath and M. K. Kathiravan, J. Chemom., 2019, 33(12), 1–16, DOI:10.1002/cem.3189.
- R. Kumar, V. Sharma, S. Bua, C. T. Supuran and P. K. Sharma, J. Enzyme Inhib. Med. Chem., 2017, 32(1), 1187–1194 CrossRef CAS PubMed.
- R. Kumar, L. Vats, S. Bua, C. T. Supuran and P. K. Sharma, Eur. J. Med. Chem., 2018, 155, 545–551 CrossRef CAS PubMed.
- L. Vats, V. Sharma, A. Angeli, R. Kumar, C. T. Supuran and P. K. Sharma, Eur. J. Med. Chem., 2018, 150, 678–686 CrossRef CAS PubMed.
- D. E. V. Pires, T. L. Blundell and D. B. Ascher, J. Med. Chem., 2015, 58(9), 4066–4072, DOI:10.1021/acs.jmedchem.5b00104.
- F. Bracht and R. B. de Alencastro, J. Biomol. Struct. Dyn., 2016, 34(2), 259–271 CrossRef CAS PubMed.
- M. Y. Lobanov, N. S. Bogatyreva and O. V. Galzitskaya, Mol. Biol., 2008, 42(4), 623–628, DOI:10.1134/S0026893308040195.
- S. V. Pattar, S. A. Adhoni, C. M. Kamanavalli and S. S. Kumbar, Beni-Suef University Journal of Basic and Applied Sciences, 2020, 9, 36, DOI:10.1186/s43088-020-00059-7.
- Y. Dizdaroglu, C. Albay, T. Arslan, A. Ece, E. A. Turkoglu, A. Efe, M. Senturk, C. T. Supuran and D. Ekinci, J. Enzyme Inhib. Med. Chem., 2019, 35(1), 289–297, DOI:10.1080/14756366.2019.1695791.
- E. Wang, H. Sun, J. Wang, Z. Wang, H. Liu, J. Z. H. Zhang and T. Hou, Chem. Rev., 2019, 119(16), 9478–9508, DOI:10.1021/acs.chemrev.9b00055.
- W. Liu, C. Yao, Q. Shang, Y. Liu, C. Liu and F. Meng, J. Theor. Comput. Chem., 2020, 19(07), 2050027, DOI:10.1142/s0219633620500273.
- G. M. Morris, R. Huey, W. Lindstrom, M. F. Sanner, R. K. Belew, D. S. Goodsell and A. J. Olson, J. Comput. Chem., 2009, 30, 2785–2791, DOI:10.1002/jcc.21256.
- B. Webb and A. Sali, Curr. Protoc. Bioinf., 2016, 54, 5, DOI:10.1002/cpbi.3.
- M. Malinska, M. Dauter, M. Kowiel, M. Jaskolski and Z. Dauter, Acta Crystallogr., Sect. D: Biol. Crystallogr., 2015, 71(Pt7), 1444–1454 CrossRef CAS PubMed.
- Desmond Molecular Dynamics System, Version 5.9, D. E. Shaw Research, Schrödinger, New York, NY, 2014 Search PubMed.
- D. Shivakumar, J. Williams, Y. Wu, W. Damm, J. Shelley and W. Sherman, J. Chem. Theory Comput., 2010, 6(5), 1509–1519, DOI:10.1021/ct900587b.
- G. A. Kaminski, R. A. Friesner, J. Tirado-Rives and W. L. Jorgensen, J. Phys. Chem. B, 2001, 105, 6474–6487, DOI:10.1021/jp003919d.
- W. Shinoda and M. Mikami, J. Comput. Chem., 2003, 24(8), 920–930, DOI:10.1002/jcc.10249.
- G. J. Martyna, M. L. Klein and M. Tuckerman, J. Chem. Phys., 1992, 97, 2635–2643, DOI:10.1063/1.463940.
- G. J. Martyna, D. J. Tobias and M. L. Klein, J. Chem. Phys., 1994, 101, 4177–4189, DOI:10.1063/1.467468.
Footnote |
| † Electronic supplementary information (ESI) available. See DOI: 10.1039/d1ra07377j |
| This journal is © The Royal Society of Chemistry 2021 |

