 Open Access Article
A porous organic polymer nanosphere-based fluorescent biosensing platform for simultaneous detection of multiplexed DNA via electrostatic attraction and π–π stacking interactions†
Yujie Sun‡
,
Zhenzhong Lu‡ ,
Wenlin Ma,
Rui Wang,
Chengwu Zhang and
Jinhua Liu
 *
*
Key Laboratory of Flexible Electronics (KLOFE), Institute of Advanced Materials (IAM), Jiangsu National Synergetic Innovation Center for Advanced Materials (SICAM), Nanjing Tech University (NanjingTech), 30 South Puzhu Road, Nanjing 211816, China. E-mail: iamjhliu@njtech.edu.cn; Fax: +86 025 83587982; Tel: +86 025 83587982
First published on 3rd December 2021
Abstract
One key challenge in oligonucleotide sequence sensing is to achieve multiplexed DNA detection in one sensor. Herein, a simple and efficient fluorescent biosensing platform is constructed to simultaneously detect multiplexed DNA depending on porous organic polymer (POP) nanospheres. The developed sensor is based on the concept that the POP nanospheres can efficiently quench the fluorescence emission of dye-labeled single-stranded DNA (ssDNA). Fluorescence quenching is achieved by the non-covalent assembly of multiple probes on the surface of POP nanospheres through electrostatic attraction and π–π stacking interactions, in which the electrostatic attraction plays a more critical role than π–π stacking. The formed dsDNA could be released off the surface of POP via hybridizing with the target DNA. Consequently, the target DNA can be quickly detected by fluorescence recovery. The biosensor could sensitively and specifically identify three target DNAs in the range of 0.1 to 36 nM, and the lowest detection limits are 50 pM, 100 pM, and 50 pM, respectively. It is noteworthy that the proposed platform is successfully applied to detect DNA in human serum. We perceive that the proposed sensing system represents a simple and sensitive strategy towards simultaneous and multiplexed assays for DNA monitoring and early clinical diagnosis.
1. Introduction
Deoxyribonucleic acid (DNA), one of the four basic macromolecules in the bio-system, functions to carry the genetic information necessary for synthesizing RNA and protein and is an essential biological macromolecule for the development and regular operation of organisms.1,2 Therefore, development of efficient methods for simple, rapid and highly sensitive detection of DNA is vital for early clinical diagnostics and screening genetic disorders.3–5 So far, many methods have been reported for DNA detection, including high-performance liquid chromatography (HPLC),6 electrochemical analysis,7 capillary electrophoresis,8 fluorescence and colorimetric methods.9,10 Among them, fluorescence-based detection is most widely utilized in both basic research and clinic. However, so far reported methods could only detect one or two target DNA sequences due to the limitation of spectral overlap of different fluorophores, which is not sufficient for disease diagnostics since the specificity, low detection rates and unavoidable false-positives would interfere with the results. Only a few studies achieve detection of three DNA simultaneously.11–15 The currently used methods to detect multiple DNAs, such as PCR technology and electrochemical methods, are complicated and time-consuming.16,17 Thus, development of simple and feasible multiple-DNA simultaneous detection method is imperative but unmet especial in terms of diagnosis.Porous organic polymer (POP), constructed by purely organic building blocks via the robust covalent bond, is endowed with high surface area, porosity, chemical stability and modifiable functional sites.18–22 POP is widely utilized in various fields such as gas storage,23,24 heterogeneous catalysis,25 molecular separation,26 and sensors.27 However, applications of POP in biomedical field remain is rare.28 Ma et al. synthesized a multifunctional luminescent porous organic polymer for detection of Fe3+ through significant luminescence quenching.29 Bi et al. designed fluorescent POP based on diketopyrrolopyrrole to detect fluoride transmission. Nevertheless, the uncertain emission regions and low quantum yields of obtained fluorescent POP partly limit their bioanalytical application.30 In addition to the inherent luminescence of POP, the non-covalent assembly of POP and fluorescent biomolecules not only has scalability, but also provides processability and new functions. Based on this design, some carbon nanomaterials, including graphenes,31 carbon nanotubes,32 and carbon nanoparticles,33 have been reported as an effective biosensing platform. Therefore, we try to assembly POP with dye-labelled fluorescent DNA as an analysis platform for multiple-DNA detection.
In the present study, a novel biosensing platform is proposed by coupling fluorescent biomolecules with POP. As the continuation of our researches on assembly fluorescent DNA probes with carbon nanoparticles,34 the feasibility of using POP nanosphere as a biosensing platform for multiple-DNA is verified by assembly POP with fluorescent DNA probe. The proposed sensor depends on the competing interaction of electrostatic attraction and π–π stacking between POP and DNA. The interaction abilities of ss-DNA and ds-DNA with POP lead to different adsorb behavior on the POP surfaces. Significantly, the fluorescence of dye-DNA is quenched by the POP nanosphere, whereas when the dye-DNA binds to its target the fluorescence is recovered (Scheme 1a). The platform is successfully used to detect multi-DNA in one system. Furthermore, the developed platform is also applied to detect multi-DNA in serum with satisfied recovery. As developed strategy improves the accuracy and specificity of nucleic acid detection and reduces its false alarm rate, which will have a profound impact on early diagnosis and detection of genetic diseases.
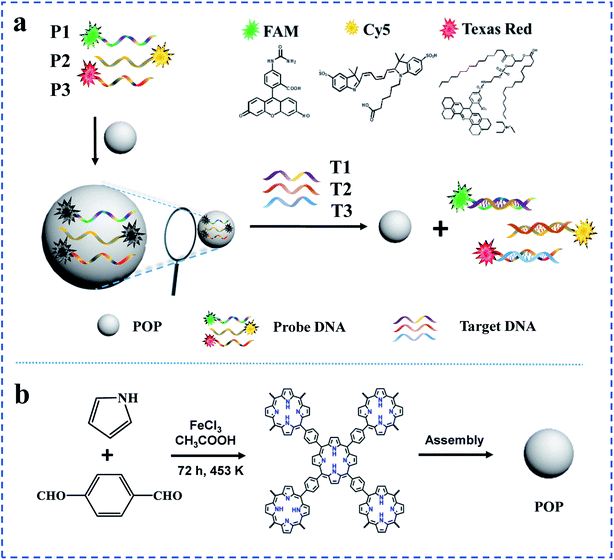 | ||
| Scheme 1 (a)Schematic illustration of the detection strategy for DNA based on POP; (b) formation of molecular building blocks of POP. | ||
2. Experimental section
2.1. Reagents and apparatus
All DNA oligonucleotides were synthesized and purified by Shanghai Chemical Reagent Co. (Shanghai, China) and their sequences were listed in Table S1.† The used metal salts (NaCl, MgCl2, FeCl3) and graphene oxide nanosheets (GO) were purchased from Aladdin reagent Co., Ltd (Shanghai, China). Pyrrole and terephthaldehyde were purchased from Sigma-Aldrich. All experiments were carried out in Tris–HCl buffer (10 mM, pH 7.4) at room temperature. All reagents were of analytical reagent grade and used without further purification. The Milli-Q ultrapure water (resistance > 18 MΩ cm) was used in all experiments. All fluorescence measurements were recorded on Hitachi model F-7000 fluorescence spectrophotometer (Kyoto, Japan). Quanta 200 Environmental scanning electron microscope (FEI Company, USA) and JEM-2100 transmission electron microscope (Japan Electronics Co., Ltd) were utilized to study the morphology of POP. Fourier transform infraRed (FTIR) spectra of Fe–POP are recorded using a VECTOR 22 spectrophotometer (Bruker, Germany). Powder X-ray diffraction data (PXRD) were collected over the 2θ range 4–50° on a Bruker Advance D8 diffractometer using Cu-Kα1 radiation (λ = 1.54056 Å, 40 kV/40 mA). Thermogravimetry (TGA) and differential thermal analyses (DTA) of the samples were carried out in a TGA instruments thermal analyzer TA-SDT Q-600.2.2. Preparation of POP
The POP was prepared according to published protocol with minor modifications.35 Mixture of freshly distilled pyrrole (1.0 mmol), terephthaldehyde (1.0 mmol), FeCl3 (2.0 mmol) and 20 mL glacial acetic acid was constant stirring under an inert argon atmosphere till the whole solution was homogenized. And the mixture was transferred to a Teflon lined autoclave and heated at 180 °C for 72 h. A dark purple sample was collected by vacuum filtration, and washed with distilled water–methanol, acetone, THF, dichloromethane. The solid sample was then washed by Soxhlet extractions for 24 h with methanol, tetrahydrofuran (THF), and dichloromethane, respectively, and vacuum dried at 80 °C for 48 hours (yield 44% based on terephthaldehyde).2.3. Assay procedures
3. Results and discussion
3.1. Principle of POP-based sensing platform
The principle of a POP-based sensing platform for sensitive and multiple DNA detection was illustrated in Scheme 1a. The dye-DNA was absorbed on the surface of POP, so that the fluorescent of the dye was quenched. However, when binding with target DNA, the probe could identify and combine to form duplex-strand DNA (dsDNA), which made the nucleobases effectively shield within the phosphate backbone by constructing a stable double-helix geometry. Given that the interaction between the dsDNA and POP was relatively weak, the dye-DNA broke off the surface of the POP nanosphere. Then the quenched fluorescent signal of dye-DNA by POP restored. The system could successfully distinguish ssDNA and dsDNA according to their interaction with POP. As a result, the fluorescence intensity of probes was expected to provide a sensitive and selective quantitative detection of the target DNA. In the same system, the fluorescent probe P1, P2 and P3 were labeled at their 5′-ends with three different fluorophores FAM, Cy3 and Texas Red, respectively. The fluorescence of different dye-DNA probes (P1, P2 and P3) could be quenched simultaneously by POP, but in the presence of target strands (T1, T2 and T3), the fluorescence of probes (P1, P2, and P3) could be recovered. Therefore, the proposed sensor could detect two and three target DNA simultaneously.3.2. Synthesis and characterization of POP
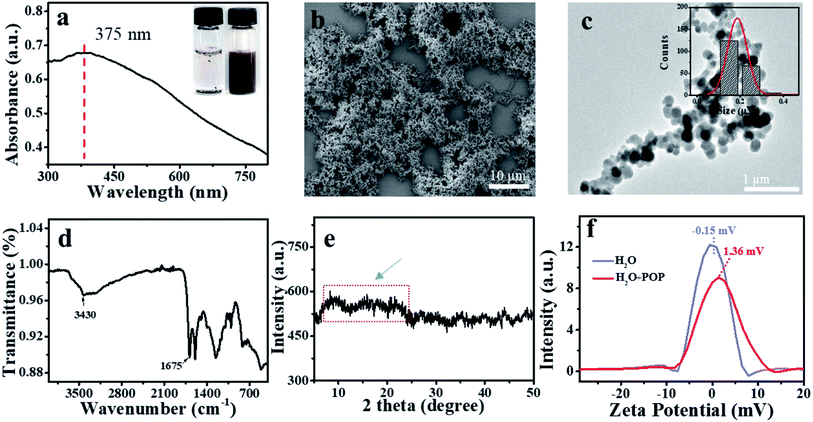
The POP nanosphere was synthesized by simple one-pot aromatic electrophilic substitution on pyrrole with terephthalaldehyde for extended cross-linking from the macrocyclic porphyrin repeating units (Scheme 1b).35 The obtained POP was dark purple powder and could be dispersed in water by ultrasound (Fig. S1a† and 1a). UV-Vis absorption spectrum of the POP showed a broad absorption peak at 375 nm, which corresponded to the characteristic peak of nanoparticles. And the POP nanosphere was imaged by TEM and SEM (Fig. 1b and c). Both TEM and SEM showed that the POP nanospheres were regular spheres, and their particle size was about 200 nm. FT-IR spectrum showed that the stretching vibrations of C![[double bond, length as m-dash]](https://www.rsc.org/images/entities/char_e001.gif) O from aldehyde groups (∼1715 cm−1) were absent, suggesting the near completion of the formation of the polymeric network by polymerization of pyrrole and aldehyde groups. The broad peak at 3430 cm−1 was assigned to the stretching vibration of N–H in porphyrin moieties (Fig. 1d). PXRD results of the POP with broad peaks indicated that the structure of POP was amorphous (Fig. 1e).36 The excellent thermo-stability with a decomposition temperature of 400 °C was demonstrated by TGA (Fig. S1b†).
O from aldehyde groups (∼1715 cm−1) were absent, suggesting the near completion of the formation of the polymeric network by polymerization of pyrrole and aldehyde groups. The broad peak at 3430 cm−1 was assigned to the stretching vibration of N–H in porphyrin moieties (Fig. 1d). PXRD results of the POP with broad peaks indicated that the structure of POP was amorphous (Fig. 1e).36 The excellent thermo-stability with a decomposition temperature of 400 °C was demonstrated by TGA (Fig. S1b†).
3.3. Interaction mechanism study based on electrostatic attraction and π–π stacking
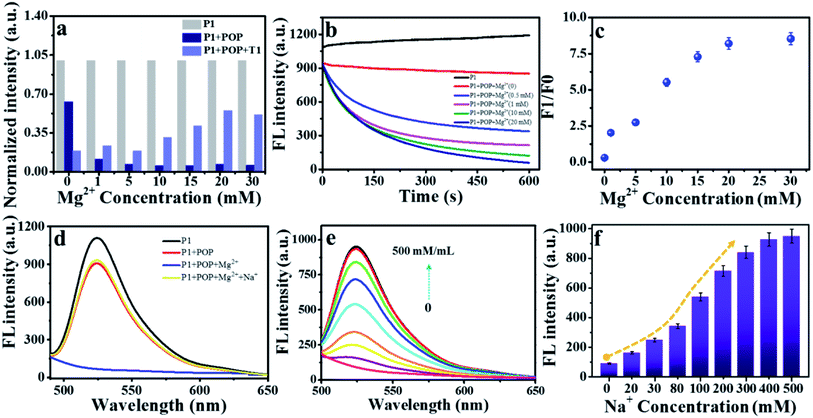
It was reported that ssDNA could be adsorbed on the surface of carbon nanomaterials through π–π stacking and electrostatic repulsion interaction.31,37,38 We speculated that POP had similar adsorption capacity due to its imines and aromatic conjugation system (Scheme 2). ssDNA containing with hydrophobic aromatic structures could be adsorbed on the hydrophobic areas of the POP surface through π–π stacking. Moreover, DNA had a negatively charged phosphate backbone, and POP was positively charged (1.36 mV) by the potential zeta test (Fig. 1f), and electrostatic attraction interaction would promote the adsorption of DNA on the POP surface. Thus, a good quenching effect was obtained due to the electrostatic attraction and π–π stacking interaction. To confirm the interaction mechanism between POP and ssDNA, a 23-base oligonucleotide (P1) labelled with fluorescein (FAM) was selected to study how ionic strength affects the interaction between POP and P1. A significant decrease (quenching efficiency, QE = 36.89%) of fluorescence was observed, indicating that ssDNA interacted with POP and caused the energy and electron transfer between dye and POP.32 The fluorescence intensity of P1 reduced to about 36.89% and 88.38% by POP without and with Mg2+, respectively (Fig. 2a). With increasing Mg2+ concentration, the fluorescence intensity of P1 decreased gradually with a maximum QEs of 93.2% when the Mg2+ concentration reached 20 mM, which was further confirmed by the real-time fluorescence curves (Fig. 2b). Those results indicated that Mg2+ effectively induced the enhancement of QE. To further understand the Mg2+-induced the QE of POP (positive charge) and P1 (negative charge), we first incubated POP with and without Mg2+, and then centrifugal separation to obtain the POP and POP/Mg2+, respectively. The POP/Mg2+ showed a greater QE (88.37%) than (30.2%) that of POP (Fig. S2a†). Additionally, the test of zeta potential indicated that POP/Mg2+ had a more positive charge than that of POP (Fig. S2b†). We speculated that the formation of POP/Mg2+ was owe to the nitrogen in porphyrin structure of POP coordinated with Mg2+. Furthermore, Cd2+, Fe2+ and Fe3+ could also be adsorbed by POP to significantly enhance the quenching of P1 (Fig. S2c†), which was because POP coordinated metal ion exhibited a stronger positive charge and enhanced the electrostatic attraction interaction with P1. Thus, the QE caused by the electrostatic attract was more significant than that caused by π–π stacking interaction. The P1/POP system achieved about 9-fold enhancement with 20 mM Mg2+ (Fig. 2c), but further increasing of Mg2+ concentration, no significant changes were found. This was mainly because Mg2+ promoted the formation of dsDNA. Additionally, the presence of Na+ significantly caused fluorescence recovery of the P1/POP/Mg2+ system (Fig. 2d). As the increase of Na+ concentration, the fluorescence intensity of the P1/POP/Mg2+ system increased gradually with a maximum QRs of 84.12% when the Na+ concentration reached 400 mM (Fig. 2e and f), indicating that the ion concentration could interfere with the electrostatic effect of POP and P1 caused by Mg2+. These results demonstrated that the interaction between P1 and POP resulted from competition interaction by coupling electrostatic attraction with π–π stacking of which electrostatic attraction played a more important role than that of π–π stacking.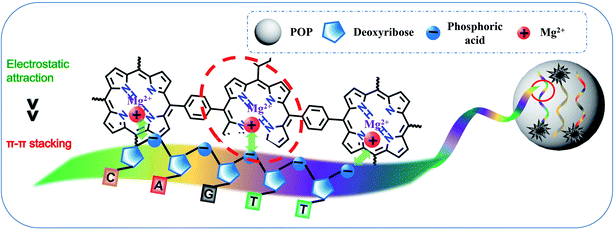 | ||
| Scheme 2 Scheme for coupling π–π stacking and electrostatic attraction interactions between POP and ssDNA. | ||
3.4. POP-based sensing platform for multiplexed DNA detection
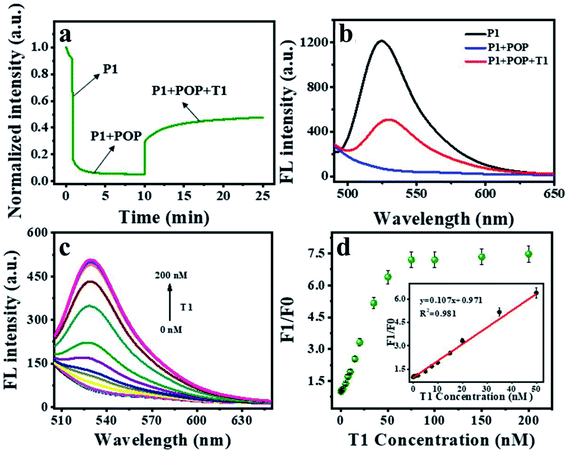
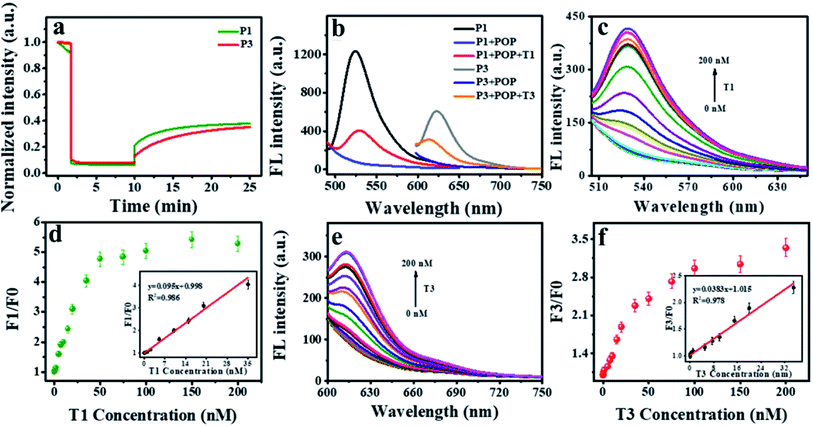
To investigate the fluorescence quenching and affinity capacity of ssDNA and dsDNA toward POP, three dyes (FAM, Cy3 and Texas Red)-labeled ssDNA as probes (P1, P2, P3) were adopted. Firstly, POP-based system was used to detect a single DNA. As shown in Fig. 3a, 15 min was the appropriate response time for hybridization. The different affinity of POP for ssDNA over dsDNA could be applied for T1 detection (Fig. 3b). Next, the proper concentration of POP was explored. When the concentration was 30 μg mL−1, the fluorescence quenching efficiency was the best (Fig. S3†). Given that biological environment was nearly neutral, all the experiments were conducted at pH 7.4 (10 mM Tris–HCl buffer solution). The assay showed a good linearity (F1/F0 = 0.107x + 0.971, R2 = 0.981) between fluorescence intensity and T1 concentrations in the range of 0 to 50 nM with a limit of detection LOD of 50 pM for T1 (Fig. 3c and d), where F1 and F0 represent the fluorescence intensity at 526 nm with and without T1, respectively. The results indicated that the proposed platform showed high sensitivity for detection of single DNA.After confirming the feasibility of detecting one target DNA, we further used the constructed sensor to detect two target DNAs simultaneously. Detection of two DNAs was achieved within 15 minutes with similar kinetics that of single DNA (Fig. 4a). Fluorescence spectra were observed for detecting two targets of T1 and T3 (Fig. 4b). The concentration of POP was selected as 50 μg mL−1 (Fig. S4†). Consequently, a multiplexed DNA biosensing platform based on the POP nanosphere was constructed for the simultaneous detection of T1 and T3 by using P1 and P3, respectively. The introduction of the T1 and T3 would lead to a significantly increase in fluorescence, which exhibited good linear relationships in the range of 0.05 to 35 nM for T1, 0.65 to 35 nM for T3. The linear equations were y1 = 0.095x1 + 0.998 (R2 = 0.986), y3 = 0.0383x3 + 1.015 (R2 = 0.978), respectively (Fig. 4c–f). The results demonstrated that it showed high sensitivity for sensing two target DNAs simultaneously.
To achieve simultaneous detection of multi-targets in one system, we used the POP-based platform to detect three DNA in one sensor. In the presence of the POP nanosphere, the quenching kinetics of P (P1, P2, P3) were fast with the QE of up to 90% within 5 min. In contrast, after P (P1, P2, P3) hybridized with the corresponding target complementary DNA (T1, T2, T3) to form dsDNA, the fluorescence of the system remarkably recovered within 15 min (Fig. S5†). Compared to the graphene oxide nanosheets (GO), the POP nanosphere exhibited much better fluorescence recovery ability (Fig. S6†). When the specific targets DNA (T1, T2, T3) were added to the P (P1, P2, P3) hybridized mixture and forming dsDNA, resulting in fluorescence recovery at 526 nm, 566 nm and 615 nm, respectively (Fig. S7a†). The fluorescence quenching of three strands was measured maximum in the presence of 70 μg mL−1 of POP (Fig. S7b†). The corresponding fluorescence spectra were showed in Fig. S8.† These results suggested that the POP could serve as a biosensing platform for multi-target DNA detection.
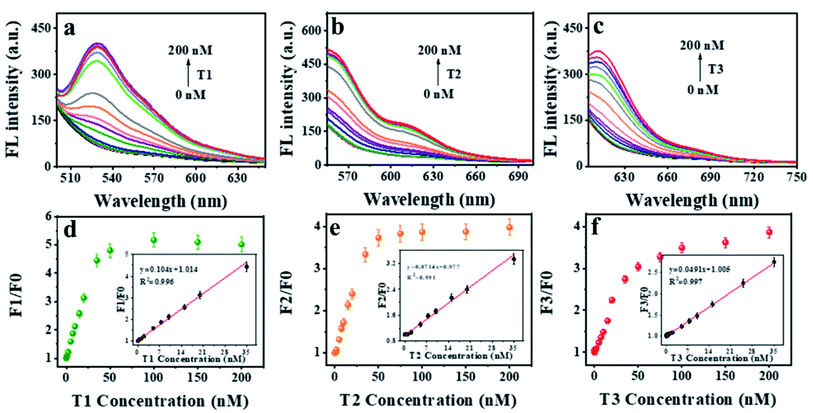
Moreover, upon adding T1, T2 and T3 into the reaction, the corresponding fluorescence intensity of P1, P2 and P3 increased at the specific excitation wavelength. In other words, the fluorescence intensity of P1 at 526 nm augmented with the increase of T1 (Fig. 5a), so as to P2 at 566 nm with the increase of T2 (Fig. 5b), P3 at 615 nm with the increase of T3 (Fig. 5c). The plots of fluorescence intensity versus targets concentration exhibited good linearity ranging from 0.2 to 35 nM for T1, 0.2 to 35 nM for T2, 0.05 to 35.0 nM for T3. The corresponding linear equations were y1 = 0.104x1 + 1.014 (R2 = 0.996), y2 = 0.0714x2 + 0.977 (R2 = 0.991), y3 = 0.0491x3 + 1.005 (R2 = 0.997), respectively (linear plots were inset in Fig. 5d–f). Where y and x corresponded to the F1/F0 and target concentration. The LOD were 50 pM, 100 pM and 50 pM for T1, T2 and T3, respectively. Compared with other reported methods for multi-DNA analysis, our method displayed faster response and higher sensitivity (Table S2†).39–48 These results suggested that POP-based platform could be used to quantify multiple DNA-targets in one system.
Next, the specificity of the proposed platform for target DNA detection was studied. POP/P incubated with two analogues, single-base mismatched DNA and random mismatched DNA, at the same reaction conditions. Only target DNA induced noticeable increase in F1/F0 value (Fig. S9†). To explore multiplexed DNA detection, the quenching efficiency and recovery of the different detected systems were listed in Table S3.† Those results suggested that POP-based platform exhibited good selectivity and sensitive for multiplexed DNA detection.
3.5. Determination of target DNA in serum samples
To investigate the applicability of the proposed platform in complex environment, the multiplexed DNA were simultaneously detected in diluted healthy human serum. Different concentrations of target DNA (3.0, 6.0 and 12.0 nM) were spiked into the Tris–HCl buffer solution containing serum. The platform exhibited a satisfied recoveries ranging from 95% and 110% for detection of multiplexed DNA (Table 1), which demonstrated that the biosensor not only had good stability in complex environment, but also was suitable for selective, successively trace amount of simultaneously detecting multiplexed targets DNA in human serum. Therefore, the POP-based biosensor exhibited quick response, good stability and excellent repeatability in biomedical application.| Target DNA | Samples no. | Target DNA spiked (nM) | Target DNA recovery (nM) | Recovery (%) |
|---|---|---|---|---|
| Meana ± SDb | ||||
| a Mean of three determinations.b SD: standard deviation. | ||||
| T1 | 1 | 3 | 3.14 ± 0.15 | 104.7 |
| 2 | 6 | 6.22 ± 0.23 | 103.6 | |
| 3 | 12 | 11.41 ± 0.57 | 95.1 | |
| T2 | 4 | 3 | 2.93 ± 0.09 | 97.7 |
| 5 | 6 | 5.71 ± 0.29 | 95.2 | |
| 6 | 12 | 12.45 ± 0.53 | 103.8 | |
| T3 | 7 | 3 | 3.16 ± 0.15 | 105.3 |
| 8 | 6 | 6.27 ± 0.32 | 104.5 | |
| 9 | 12 | 11.75 ± 0.52 | 97.9 | |
4. Conclusions
In conclusion, the POP nanosphere was synthesized by simple one-pot aromatic electrophilic substitution on pyrrole with terephthalaldehyde for extended cross-linking from the macrocyclic porphyrin repeating units. The obtained POP nanosphere showed high-efficiency fluorescence quenching ability and different affinities for ssDNA and dsDNA. With that, we designed one multicolor fluorescence platform for simultaneous detection of multiplexed DNA depending on the POP nanosphere. The proposed sensor was based on the competition interaction between electrostatic repulsion and π–π stacking, in which the electrostatic repulsion played a more critical role than π–π stacking. Moreover, we demonstrated that POP displayed quenching ability toward three kinds of fluorophores (FAM, Cys and Texas Red) labelled ssDNA (P1, P2 and P3). In the presence of target DNA (T1, T2 and T3), the POP-based platform exhibited fluorescence recovery with good linearity ranging from 0.2 to 35 nM for T1, 0.2 to 35 nM for T2, 0.05 to 35.0 nM for T3. The LOD for T1, T2 and T3 were 50 pM, 100 pM and 50 pM, respectively. Noteworthy, the sensor was successfully applied to detect three target DNA (T1, T2, and T3) in serum with good recoveries from 95% and 110%. This POP-based multi-color fluorescent platform exhibited outstanding advantages, including simple operator, high sensitivity and selectivity, and low cost. The as developed DNA detecting platform held great potential in gene expression profiling, high throughput screening, and clinical diagnostics.Conflicts of interest
There are no conflicts to declare.Acknowledgements
The authors acknowledge the financial support from the National Natural Science Foundation of China (Grant no. 22174065).References
- J. Kim, A. S. Campbell, B. E. de Avila and J. Wang, Nat. Biotechnol., 2019, 37, 389–406 CrossRef CAS PubMed.
- Y. Krishnan and F. C. Simmel, Angew. Chem., Int. Ed., 2011, 50, 3124 CrossRef CAS PubMed.
- Y. Chen, K. Murayama, H. Kashida, Y. Kamiya and H. Asanuma, Chem. Commun., 2020, 56, 5358–5361 RSC.
- A. Hofer, Z. J. Liu and S. Balasubramanian, J. Am. Chem. Soc., 2019, 141, 6420–6429 CrossRef CAS PubMed.
- M. Y. Han, X. H. Gao, J. Z. Su and S. M. Nie, Nat. Biotechnol., 2001, 19, 631–635 CrossRef CAS PubMed.
- M. Isokawa, T. Funatsu and M. Tsunoda, Analyst, 2013, 138, 3802–3808 RSC.
- S. Han, W. Liu, M. Zheng and R. Wang, Anal. Chem., 2020, 92, 4780–4787 CrossRef CAS PubMed.
- P. Bhattacharjee, S. Chatterjee, A. Achari, A. Saha, D. Nandi, C. Acharya, K. Chatterjee, S. Ghosh, S. Swarnakar and P. Jaisankar, Analyst, 2020, 145, 1184–1189 RSC.
- H. J. Huang, X. R. Ji, Y. Q. Jiang, C. Y. Zhang, X. Y. Kang, J. Q. Zhu, L. Sun and L. Yi, Org. Biomol. Chem., 2020, 18, 4004–4008 RSC.
- C. L. Yuan, X. Qin, Y. J. Xu, X. P. Li, Y. Y. Chen, R. Shi and Y. L. Wang, J. Photochem. Photobiol., A, 2020, 396, 112529 CrossRef CAS.
- T. A. Taton, G. Lu and C. A. Mirkin, J. Am. Chem. Soc., 2001, 123, 5164 CrossRef CAS PubMed.
- Y. W. Cao, R. Jin and C. A. Mirkin, Science, 2002, 297, 1536 CrossRef CAS PubMed.
- M. Han, X. Gao, J. Su and S. Nie, Nat. Biotechnol., 2001, 19, 631 CrossRef CAS PubMed.
- B. Reiss, L. He, I. Walton, R. Cromer, C. Keating and M. Natan, Science, 2001, 294, 137 CrossRef PubMed.
- J. A. Ferguson, F. J. Steemers and D. R. Walt, Anal. Chem., 2000, 72, 5618 CrossRef CAS PubMed.
- I. M. Mackay, K. E. Arden and A. Nitsche, Nucleic Acids Res., 2002, 30, 1292 CrossRef CAS PubMed.
- A. Gopi, S. M. Madhavan, S. K. Sharma and S. A. Sahn, Chest, 2007, 131, 880 CrossRef CAS PubMed.
- M. Darder, S. Salehinia, J. B. Parra, J. M. Herrero-Martinez, F. Svec, V. Cerdà, G. Palomino and F. Maya, ACS Appl. Mater. Interfaces, 2017, 9, 1728–1736 CrossRef CAS PubMed.
- V. Stavila, A. A. Talin and M. D. Allendorf, Chem. Soc. Rev., 2014, 43, 5994–6010 RSC.
- S. Jiao, L. Deng, X. Zhang, Y. Zhang, K. Liu, S. Li, L. Wang and D. Ma, ACS Appl. Mater. Interfaces, 2021, 13, 39404–39413 CrossRef CAS PubMed.
- Y. Zhang, M. Zhang, Z. Han, S. Huang, D. Yuan and W. Su, ACS Catal., 2021, 11, 1008–1013 CrossRef CAS.
- P. Puthiaraj, Y. R. Lee, S. Zhang and W. S. Ahn, J. Mater. Chem. A, 2016, 4, 16288–16311 RSC.
- Y. Zhu, H. Long and W. Zhang, Chem. Mater., 2013, 25, 1630–1635 CrossRef CAS.
- P. Puthiaraj, S. S. Kim and W. S. Ahn, Chem. Eng. J., 2016, 283, 184–192 CrossRef CAS.
- L. Liu, W.-D. Qu, K.-X. Dong, Y. Qi, W.-T. Gong, G.-L. Ning and J.-N. Cui, Chem. Commun., 2021, 57, 3339–3342 RSC.
- Q. Chen, M. Luo, P. Hammershøj, D. Zhou, Y. Han, B. W. Laursen, C. G. Yan and B. H. Han, J. Am. Chem. Soc., 2012, 134, 6084–6087 CrossRef CAS PubMed.
- Z. Li, H. Li, H. Xia, X. Ding, X. Luo, X. Liu and Y. Mu, Chem.–Eur. J., 2015, 21, 17355–17362 CrossRef CAS PubMed.
- M. Mahmoudpour, S. Ding, Z. Y. Lyu, G. Ebrahimi, D. Du, J. E. Dolatabadi, M. Torbati and Y. Lin, Nano Today, 2021, 39, 101177 CrossRef CAS.
- D. X. Ma, B. Y. Li, Z. H. Cui, K. Liu, C. L. Chen, G. H. Li, J. Hua, B. H. Ma, Z. Shi and S. H. Feng, ACS Appl. Mater. Interfaces, 2016, 8, 24097–24103 CrossRef CAS PubMed.
- S. Bi, Y. K. Li, S. Zhang, J. Hu, L. M. Wang and H. Liu, J. Mater. Chem. C, 2018, 6, 3961–3967 RSC.
- X. Z. Zhang, K. Jiao, S. F. Liu and Y. W. Hu, Anal. Chem., 2009, 81, 6006–6012 CrossRef CAS PubMed.
- N. Suzuki, Y. C. Wang, P. Elvati, Z. B. Qu, K. Kim, S. Jiang, E. Baumeister, J. Lee, B. Yeom, J. H. Bahng, J. Lee, A. Violi and N. A. Kotov, ACS Nano, 2016, 10, 1744–1755 CrossRef CAS PubMed.
- J. Liu, J. Li, Y. Jiang, Y. Yang, W. Tan and R. Yang, Chem. Commun., 2011, 47, 11321–11323 RSC.
- J. H. Liu, C. P. Zou, C. Chen, H. X. Fang, Q. Wu, H. D. Yu, J. X. Zhu, L. Li, S. Yang and W. Huang, Talanta, 2020, 219, 121285 CrossRef CAS PubMed.
- A. Modak, M. Nandi, J. Mondal and A. Bhaumik, Chem. Commun., 2012, 48, 248–250 RSC.
- S. Y. Ding, M. Dong, Y. W. Wang, Y. T. Chen, H. Z. Wang, C. Y. Su and W. Wang, J. Am. Chem. Soc., 2016, 138, 3031–3037 CrossRef CAS PubMed.
- S. Ding, Z. Y. Lyu, X. Niu, D. Y. Zhou, D. Liu, M. Falahati, D. Du and Y. Lin, Biosens. Bioelectron., 2020, 149, 111830 CrossRef CAS PubMed.
- S. Ding, Z. Li, Y. Cheng, C. Du, J. Gao, Y. Zhang, N. Zhang, Z. Li, N. Chang and X. Hu, Nanotechnology, 2018, 29, 375604 CrossRef PubMed.
- R. H. Yang, J. Y. Jin, Y. Chen, N. Shao, H.-Z. Kang, Z. Xiao, Z. W. Tang, Y. R. Wu, Z. Zhu and W. H. Tan, J. Am. Chem. Soc., 2008, 130, 8351–8358 CrossRef CAS PubMed.
- B. Dubertret, M. Calame and A. J. Libchabe, Nat. Biotechnol., 2001, 19, 365 CrossRef CAS PubMed.
- S. J. He, B. Song, D. Li, C. F. Zhu, W. P. Qi, Y. Q. Wen, L. H. Wang, S. P. Song, H. P. Fang and C. H. Fan, Adv. Funct. Mater., 2010, 20, 453 CrossRef CAS.
- C. H. Lu, H. H. Yang, C. L. Zhu, X. Chen and G. N. Chen, Angew. Chem., Int. Ed., 2009, 48, 4785 CrossRef CAS PubMed.
- T. K. Mandal, Y. Hou, Z. Gao, H. Ning, Y. Yang and M. Gao, Adv. Sci., 2016, 3, 1600217 CrossRef PubMed.
- X. Liu, F. Wang, R. Aizen, O. Yehezkeli and I. Willner, J. Am. Chem. Soc., 2013, 135, 11832–11839 CrossRef CAS PubMed.
- Z. S. Qian, X. Y. Shan, L. J. Chai, J. J. Ma, J. R. Chen and H. Feng, Nanoscale, 2014, 6, 5671–5674 RSC.
- Q. Wang, W. Wang, J. Lei, N. Xu, F. Gao and H. Ju, Anal. Chem., 2013, 85, 12182–12188 CrossRef CAS PubMed.
- H. T. Zhang, J. W. Zhang, G. Huang, Z. Y. Du and H. L. Jiang, Chem. Commun., 2014, 50, 12069–12072 RSC.
- X. Zhu, H. Zheng, X. Wei, Z. Lin, L. Guo, B. Qiu and G. Chen, Chem. Commun., 2013, 49, 1276–1278 RSC.
Footnotes |
| † Electronic supplementary information (ESI) available. See DOI: 10.1039/d1ra07435k |
| ‡ These authors contributed equally to this paper. |
| This journal is © The Royal Society of Chemistry 2021 |

