 Open Access Article
Construction and photocatalytic performance of fluorinated ZnO–TiO2 heterostructure composites
Li-Yuan Zhang *ab,
Jin-Ju Yanga and
Yao-Hui Youab
aCollege of Chemistry and Chemical Engineering, Neijiang Normal University, 1124 Dongtong Road, Neijiang 641112, Sichuan Province, China. E-mail: zhangliyuansir@126.com; Tel: +86 832 2341577
bKey Laboratory of Fruit Waste Treatment and Resource Recycling of the Sichuan Provincial College, Neijiang 641112, China
First published on 1st December 2021
Abstract
Titanium dioxide, as a promising photocatalytic material, has attracted extensive attention in the field of photocatalytic degradation of organic pollutants in sewage. However, the photocatalytic performance needs to be further improved. In this work, fluorinated ZnO–TiO2 composites (F-ZTO) were prepared by a simple coprecipitation method. The photocatalytic performance of the samples was studied in detail with methyl orange as the target degradation product. The results indicated that under the same conditions, the degradation rates of 6% F-ZTO, F-TiO2 and TiO2 for methyl orange reached 93.75%, 76.56% and 62.89% respectively. This showed that the method used in this work could effectively improve the photocatalytic degradation performance of titanium dioxide. 6% F-ZTO showed an excellent photocatalytic activity, which was attributed to the small grain size, the large specific surface area and the effective inhibition of photoelectron–hole recombination due to fluorination and zinc oxide coupling. In three consecutive cycles, the photocatalytic activity was almost maintained, indicating that 6% F-ZTO had a good recycling performance.
1. Introduction
With the continuous development of society, people pay more and more attention to the ecological environment, in which the pollution of water resources is one of the issues of great concern, which makes the prevention and control of water resource pollution an inevitable trend of sustainable development. At present, there are many ways to treat organic pollutants in water, mainly including electrocatalysis technology,1 ultrasonic degradation,2 photocatalytic degradation,3–7 etc. Photocatalytic degradation is a technology with practical use, which can be used to treat soluble organic pollutants in sewage. Organic pollutants are degraded into inorganic substances such as H2O and CO2 via photocatalytic reactions.8–12 Nowadays, many kinds of photocatalysts have been found, mainly including semiconductor metal oxides and semiconductor metal sulfides, such as TiO2, ZnO, CdS, ZnS, etc.13–19 Among them, TiO2 has attracted extensive attention because of its low cost, non-toxicity and good photocatalytic activity.20–24 However, TiO2 is not conducive to practical application due to the high recombination rate of photogenerated electron and hole pairs, the wide band gap (anatase phase TiO2 ∼ 3.2 eV, rutile phase TiO2 ∼ 3.0 eV), and the low utilization rate of solar light. In order to address the above-mentioned problems, scientific researchers have carried out many explorations, including doping with metal and non-metallic ions, codoping, coupling with semiconductors and exposure of specific crystal planes.25–36 The above ways effectively improve the photocatalytic activity of TiO2.Since Minero et al.37 found that F− modification can effectively improve the photocatalytic degradation activity of TiO2 for phenol in 2000, fluorine modification of TiO2 has become a hotspot. Yu et al.38 considered that F-doping improves the crystallinity of anatase, inhibits the formation of brookite phase, prevents anatase from transforming into rutile, enhances the light absorption, and significantly reduces the band gap energy, so as to improve the photocatalytic performance. Zhong et al.39 synthesized fluorinated TiO2 hollow microspheres by solvothermal method. It was found that fluorination promoted the growth of anatase titanium dioxide crystals and the formation of ![[triple bond, length as m-dash]](https://www.rsc.org/images/entities/char_e002.gif) Ti–F on the surface of TiO2 as the capture site of photogenerated electrons, which effectively reduce the recombination rate of photogenerated electrons and holes and enhance the photocatalytic activity. In addition,
Ti–F on the surface of TiO2 as the capture site of photogenerated electrons, which effectively reduce the recombination rate of photogenerated electrons and holes and enhance the photocatalytic activity. In addition, ![[triple bond, length as m-dash]](https://www.rsc.org/images/entities/char_e002.gif) Ti–F helps the formation of highly active hydroxyl radicals and improve the photocatalytic performance. Besides, semiconductors coupling is also a good way to improve the photocatalytic activity of titanium dioxide. In essence, it is the modification of one semiconductor to the other.
Ti–F helps the formation of highly active hydroxyl radicals and improve the photocatalytic performance. Besides, semiconductors coupling is also a good way to improve the photocatalytic activity of titanium dioxide. In essence, it is the modification of one semiconductor to the other.
As a common semiconductor photocatalysis material, ZnO has a similar band gap width and staggered energy band position with TiO2. By coupling with ZnO, the crystal transformation and particle growth of TiO2 can be inhibited, and the ability of absorbing ultraviolet light is enhanced. The ZnO–TiO2 composite is a semiconductor material with a large specific surface area and good stability, which helps to realize effective separation of electron and hole, and improve the photocatalytic activity.40
In this work, fluorinated ZnO–TiO2 composites (F-ZTO) were prepared by a simple one-step coprecipitation method with easily available raw materials, and the photocatalytic performance was investigated.
2. Experimental
2.1 Preparation of F-ZTO
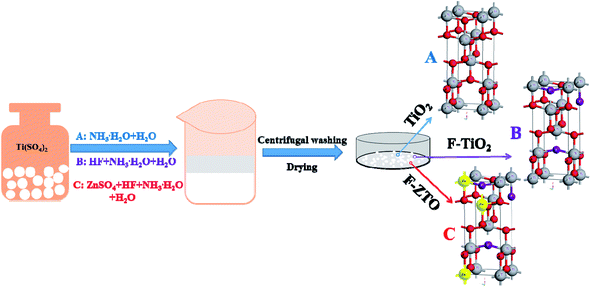
2.4 g titanium sulfate and a certain amount of zinc sulfate were dissolved in a 50 mL plastic beaker with distilled water by controlling the Zn/Ti in molar ratios of 5%, 6% and 7%. 3.6 mL of hydrofluoric acid (Ti![[thin space (1/6-em)]](https://www.rsc.org/images/entities/char_2009.gif) :
:![[thin space (1/6-em)]](https://www.rsc.org/images/entities/char_2009.gif) F = 1
F = 1![[thin space (1/6-em)]](https://www.rsc.org/images/entities/char_2009.gif) :
:![[thin space (1/6-em)]](https://www.rsc.org/images/entities/char_2009.gif) 20) was added dropwise under magnetic stirring. After stirring for 20 min, ammonia was added dropwise to adjust pH of the system to 8–9, followed by continue stirring for 30 min. Subsequently, the sample was aged for 20 min, centrifugal washed with distilled water for several times and dried in an oven at 80 °C. After that, the samples were grounded into powders, placed in a crucible and calcined in a muffle furnace at 550 °C for 2 h with a heating rate of 2 °C min−1, followed by cooling to the room temperature in the furnace to obtain F-ZTO. Simple (pure) TiO2 was obtained without hydrofluoric acid and zinc sulfate, and F-TiO2 was gained without addition of zinc sulfate. The experimental process diagram is shown in Fig. 1.
20) was added dropwise under magnetic stirring. After stirring for 20 min, ammonia was added dropwise to adjust pH of the system to 8–9, followed by continue stirring for 30 min. Subsequently, the sample was aged for 20 min, centrifugal washed with distilled water for several times and dried in an oven at 80 °C. After that, the samples were grounded into powders, placed in a crucible and calcined in a muffle furnace at 550 °C for 2 h with a heating rate of 2 °C min−1, followed by cooling to the room temperature in the furnace to obtain F-ZTO. Simple (pure) TiO2 was obtained without hydrofluoric acid and zinc sulfate, and F-TiO2 was gained without addition of zinc sulfate. The experimental process diagram is shown in Fig. 1.
2.2 Evaluation of photocatalytic performance
25 mL methyl orange solution with a concentration of 20 mg L−1 was put into a quartz tube with a rubber head, and 0.02 g of the prepared photocatalyst was added. Consequently, the tube was treated in the dark for 30 min in an eight-position photochemical reactor. In the photochemical reactor, the metal halide lamp was placed in a quartz cold well in the middle, and the power of the lamp can be adjusted according to need. Then, the system was centrifuged for 7 min to get the upper transparent solution. The absorbance was tested and designated as the initial value (A0). After that, the metal halide lamp was turned on (wavelength range: 280–780 nm), and the power was regulated to 500 W to carry out photocatalytic degradation. The absorbance (At) of the solution was measured at regular intervals, and the degradation rate (X) was calculated according to the formula (1). The photocatalytic property of the specimen was reflected by the degradation rate.
 | (1) |
2.3 Characterization
The surface morphology of the samples was characterized by Field emission scanning electron microscopy (FESEM, SIGMA 300, Carl Zeiss GmbH, German); the crystal phase composition of the samples was investigated with X-ray diffraction (DX-2700, Dandong Haoyuan Instrument Co., Ltd., China) using Cu Kα radiation at a scanning rate of 0.05° s−1 and a working voltage/current of 40 kV/30 mA. Ultraviolet absorption band of the samples were analyzed by an ultraviolet-visible spectrophotometer (UV-Vis-Abs, UV-4802, Unocal (Shanghai) Instrument Co., Ltd., China). The recombination of photogenerated electrons and holes were detected with molecular fluorescence spectrophotometer (F-4600, Hitachi, Japan). The pore size and specific surface area were measured on a surface area analyzer (BET, Autosorb iQ2, Quantachrome, USA). The valence state of the constituent elements were studied by X-ray photoelectron spectroscopy (XPS, Escalab 250 Xi, ThermoFisher Scientific, USA). The photocatalytic performance of the specimen was evaluated using a photochemical reactor with an eight-position magnetic stirring reactor (BL-GHX-V, Shanghai Bilon Instrument Co., Ltd., China). The absorbance of methyl orange solution was determined by an ultraviolet-visible spectrophotometer (Model 752, Shanghai Xinmao Instrument Co., Ltd., China). The zeta potential of the sample was measured by a potential analyzer (ZetaLitesizer 500, Antonpa (Shanghai) Trading Co., Ltd., Austria). The oxygen vacancies were investigated by electron paramagnetic resonance spectrometer (EPR, A300, Bruker, Germany).3. Results and discussion
3.1 FESEM analysis
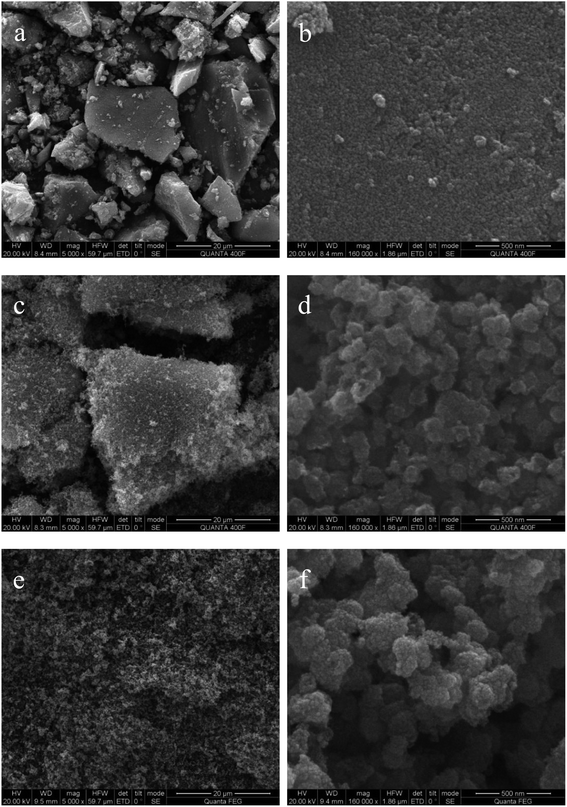
Fig. 2 gives the field emission scanning electron microscope images of simple TiO2, F-TiO2 and F-ZTO samples. An amorphous block structure can be observed in simple TiO2. From the high magnification, it can be clearly seen that the bulk structure of pure TiO2 is formed by the close packing and bonding of nanoparticles. This agglomeration phenomenon is attributed to the large specific surface area and high specific surface energy of nano materials. Compared with simple TiO2, the morphology and structure of fluorinated titanium dioxide are more uniform, with a loose and porous surface, however, on the whole, there is a tendency to form a large block structure. This shows that F− in this work reduces the surface energy of titanium dioxide.41 View from the low multiples, F-ZTO has a better dispersion than the former two samples, and there is no tendency to form blocks. From the high magnification, it is obvious that the particle clusters formed by F-ZTO are larger than those formed by F-TiO2. This may be due to the mutual deposition of small particles formed by titanium hydroxide and zinc hydroxide in the preparation process, which results in the large particle clusters. In general, F− has little effect on the morphology and structure of particles, and mainly reduces the surface energy of titanium dioxide to make the particles more dispersed. The introduction of Zn increases F-TiO2 particle group, however, the overall dispersion is better and there are more voids between the particles. It is conducive to the contact between the dye and photocatalyst, and then improve the photocatalytic performance of samples.3.2 XRD analysis
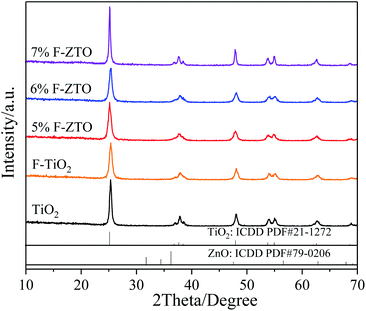
Fig. 3 shows the XRD patterns of pure TiO2, F-TiO2 and F-ZTO samples. It is known that the characteristic diffraction peak of anatase titanium dioxide (101) and rutile titanium dioxide (110) are at 2θ of 25.3°, and 2θ of 27.5°, respectively. It can be seen from the five curves that only the diffraction peaks of anatase titanium dioxide appear in the samples, no peaks of rutile and brookite titanium dioxide are detected, and there are no signs of zinc oxide and fluorine related compounds. The reason may be that the content of ZnO in F-ZTO is too small. Part of Zn and F enter into the TiO2 lattice, which results in the lattice defects. Besides, after fluorination, the crystallinity of F-TiO2 decreases significantly. With the increase of ZnO content, the peak intensity of anatase in F-ZTO composites decreases first and then increases, and the intensity of F-ZTO with a molar ratio of 6% is the lowest. This may be due to that the ion radius of Zn2+ (0.074 nm) is larger than that of Ti4+ (0.0605 nm). When some Zn2+ replaces Ti4+ in the lattice position, lattice defects are formed near the substitution position because of the different valence state and ion radius, and thus the intensity of diffraction peak is reduced.42 From XRD patterns in Fig. 3, as compared with F-TiO2, the diffraction peak of (101) crystal plane of F-ZTO is shifted to the lower 2θ value, which illustrates that some Zn2+ may enter the TiO2 lattice. With an excessive Zn2+, it is believed that most of Zn2+ cannot enter the lattice of TiO2 to form a solid solution, and Zn2+ diffuses and migrates to the surface of TiO2 during calcination. It is believed that the form of ZnO should account for the majority, that is, ZnO and TiO2 in F-ZTO mainly exist in ZnO–TiO2 heterostructure. In the process of coprecipitation preparation of F-ZTO, it is believed that Zn(OH)2 is mainly adsorbed and adhered on the surface of Ti(OH)4. When calcined at a high temperature, Zn(OH)2 and Ti(OH)4 both lose water, which can accelerate the diffusion and migration of Zn2+ to the surface of TiO2, and finally couple with each other to form ZnO–TiO2 heterostructure. Thus, the peak related to ZnO can be obtained by later XPS fitting. During the diffusion and migration of Zn2+ to the surface of TiO2, some Zn2+ can enter the lattice of TiO2 to form a solid solution. In this work, it is believed that only a small part of Zn2+ enters the lattice of TiO2 to form a solid solution, which causes the crystal defects due to the difference in radius and charge. Consequently, the diffusion and migration of Zn2+ promotes the crystallization of TiO2, resulting in the increase of TiO2 cell and diffusion peak intensity. According to the basic theory of X-ray diffraction, the intensity and sharpness of the diffraction peak are related not only to the crystallinity, but also to the grain size. The grain size of the sample can be calculated by Scherrer formula (2), and the results are shown in Table 1.
 | (2) |
| Samples | Crystallite size D(101)/nm |
|---|---|
| TiO2 | 16.74 |
| F-TiO2 | 13.94 |
| 5% F-ZTO | 14.17 |
| 6% F-ZTO | 13.49 |
| 7% F-ZTO | 24.32 |
According to the Scherrer formula and data in Table 1, it is known that with the increase of ZnO content, the grain size of F-ZTO composite shows a V-shaped variation tendency. It may be because Zn2+ replaces Ti4+ ions in TiO2 lattice and Ti–O–Zn bond is formed via the interaction, which has an impact on grain growth.43 This indicates that an appropriate amount of ZnO modification inhibits the crystallinity and grain growth of fluorinated titanium dioxide, which improves the photocatalytic performance of titanium dioxide.
3.3 UV-Vis Abs analysis
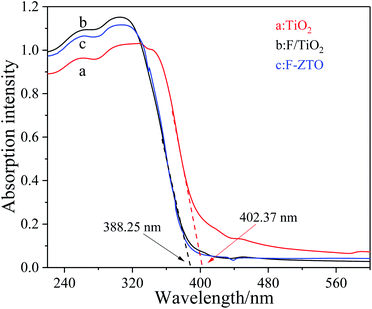
Fig. 4 shows the ultraviolet visible absorption spectra (UV-Vis Abs) of different samples. It can be seen that the absorption intensity of fluorinated titanium dioxide significantly increases in the ultraviolet region 230–360 nm, while decreases in the visible region greater than 400 nm. The absorption intensity of ZnO modified F-TiO2 shows some decrease in the ultraviolet region 230–320 nm, however, the absorption increases in the visible region greater than 480 nm. Generally, the light absorption capacity of photocatalyst is closely related to the photocatalytic activity. With other conditions maintained, the stronger the light absorption capacity of the catalyst, the higher the photocatalytic activity. The threshold wavelength of absorption spectrum of TiO2 particles (λg) is 402.37 nm, while that of F-ZTO and F-TiO2 particles are both 388.25 nm. As compared with simple TiO2, the absorption band edges of F-ZTO and F-TiO2 have an obvious blue shift. According to formula (3), the band gap energies of F-ZTO and F-TiO2 particles are both about 3.19 eV, and that of simple TiO2 particles is 3.08 eV.
 | (3) |
The blue shift of TiO2 absorption band edge caused by fluorination can be explained as follows: the incorporation of F− changes the energy band structure of TiO2 and the oxygen vacancy in TiO2, which increases the band gap energy, and shifts the light absorption edge towards blue. The visible light absorption capacity of TiO2 decreases after fluorination. The later EPR analysis shows that after fluorination of titanium dioxide, fluorine ions enter the titanium dioxide lattice to fill the oxygen vacancies, the generated electricity price compensation changes part of Ti3+ into Ti4+, and the reduction of Ti3+ inhibits the visible light absorption capacity of TiO2.
The addition of Zn weakens the light absorption in the ultraviolet region of F-TiO2. One possible reason is that Kuznetsov et al.44 believe that the introduction of metal ions produces structural oxygen vacancies in TiO2. In addition, the introduction of Zn forms ZnO, and the light absorption of ZnO in the ultraviolet region is weaker than that of F-TiO2, which weakens the light absorption of F-ZTO in the ultraviolet region. This result is in sympathy with the work by Jaramillo-Fierro et al.45
3.4 BET analysis
Fig. 5 is the N2 adsorption desorption isothermal curve and the corresponding pore size distribution of pure TiO2, F-TiO2 and F-ZTO samples. It can be seen from Fig. 5 that the adsorption isotherms all belong to type IV and have hysteresis loops even if the N2 adsorption–desorption isotherms of the three kinds of titanium dioxide show some differences, indicating that the samples are typical mesoporous materials. The hysteresis loop of pure TiO2, F-TiO2 and F-ZTO samples occurs at the relative pressure of 0.70, 0.60, and 0.35, respectively. The cure shape of simple TiO2 is similar to H1 type, indicating that it is a narrow mesoporous material formed by the aggregation of particles with uniform size. The latter two are similar to H3 type, which illustrates that the pore structure of the samples is irregular, and slab joints, cracks, and wedge structures, etc. may existed. In the three samples, only simple TiO2 shows adsorption saturation in the high relative pressure region.46,47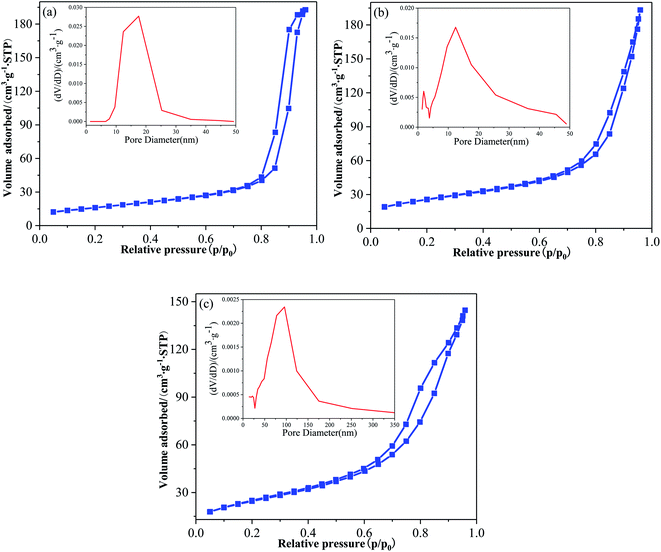 | ||
| Fig. 5 Adsorption isotherms and pore size distributions of different TiO2. (a) TiO2, (b) F-TiO2, (c) F-ZTO. | ||
It can be seen that the pore size distribution in Fig. 5a is uniform, with only a wide and high peak. The pore size is mainly distributed in 10–25 nm, with most pore sizes at 17.56 nm. In Fig. 5b, a narrow and sharp peak as well as a wide and strong peak are observed, and the wide peak is dominant. The pore size is mainly distributed in the range of 1–4 nm and 5–25 nm, with most pore sizes at 12.44 nm. In Fig. 5c, a wide and strong peak is detected. The pore size is mainly distributed in the range of 30–180 nm, with most pore sizes at 95.82 nm. From the ordinate, as compared with the first two samples (F-TiO2 and TiO2), the content of pores in F-ZTO sample with a size 0–50 nm is reduced, however, from the horizontal ordinate, it can be found that the pore size distribution range of F-ZTO sample is 0–350 nm, which is wider than that of F-TiO2 and TiO2 samples. As compared with simple TiO2, the pore distribution of F-TiO2 is wider, which may be due to the reduction of surface energy of titanium dioxide caused by F−. Thus, titanium dioxide particles are more dispersed, and the dispersion leads to a larger spacing between particles. The original compact structure forms a microporous structure, which is consistent with the previous SEM analysis that the surface of pure TiO2 is relatively dense, while there are many gaps on the surface of F-TiO2. In comparison with F-TiO2, F-ZTO has a wider pore distribution and less micropore and mesoporous, which should be attributed to the mutual deposition of small particles formed by titanium hydroxide and zinc hydroxide into a larger particle clusters. The deposition of small particles blocks some micropores and mesopores, and the disordered accumulation of large particles is easy to form macroporous. Table 2 presents the BET data of different specimens. As shown, the specific surface area of titanium dioxide increases after fluorination and ZnO coupling.
| Samples | Surface area (m2 g−1) | Pore volume (cm3 g−1) | Pore diameter (nm) |
|---|---|---|---|
| TiO2 | 57.60 | 0.313 | 17.56 |
| F-TiO2 | 96.40 | 0.30 | 12.44 |
| F-ZTO | 105.95 | 0.30 | 95.82 |
3.5 PL analysis
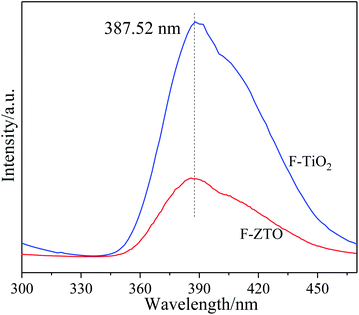
After being excited by light, semiconductor materials produce electron and hole pairs. Some electrons and holes participate in the oxidation process to form active substances, while the other ones are recombined to emit photons, resulting in photoluminescence. Therefore, in general, the higher the photoluminescence intensity, the higher the hole and electron recombination rate, that is, the shorter the lifetime of photogenerated carriers. Thus, the ability of materials to capture and transfer photogenerated carriers can be judged from the photoluminescence intensity. Fig. 6 shows the fluorescence spectra of F-TiO2 and F-ZTO particles with an excitation wavelength of 250 nm. As given in Fig. 6, the linearity of the two curves is almost the same, however, the fluorescence intensity of the F-ZTO composite is significantly lower than that of F-TiO2 at 387 nm, which demonstrates that ZnO can effectively inhibit the recombination of electron–hole pairs and improve the separation efficiency of electron–hole pairs. This is because when the electrons on the surface of semiconductor materials are irradiated by light with a energy greater than the band gap, they will be excited to produce electron–hole pairs. Due to the difference in energy level positions between ZnO and TiO2, the excited photogenerated electrons of ZnO migrate to TiO2, while the excited holes of TiO2 migrate to ZnO valence band. The reverse movement of TiO2 photogenerated electrons and holes effectively inhibits the recombination of photogenerated electron and hole.403.6 XPS analysis
The effects of different TiO2 catalysts on the composition and valence of surface elements were studied by XPS characterization, and the results are shown in Fig. 7, in which (a) is the full XPS spectrum of the sample, and (b), (c), (d) and (e) are the spectra of F, Ti, O and Zn, respectively. It can be seen from Fig. 7 that the three samples are mostly composed of two elements, Ti and O, and C element is introduced into the sample during the testing process. Both F-TiO2 and F-ZTO contain a small amount of F, besides, F-ZTO contains a certain amount of Zn, indicating that F-TiO2 is successfully prepared, and ZnO is coupled with F-TiO2.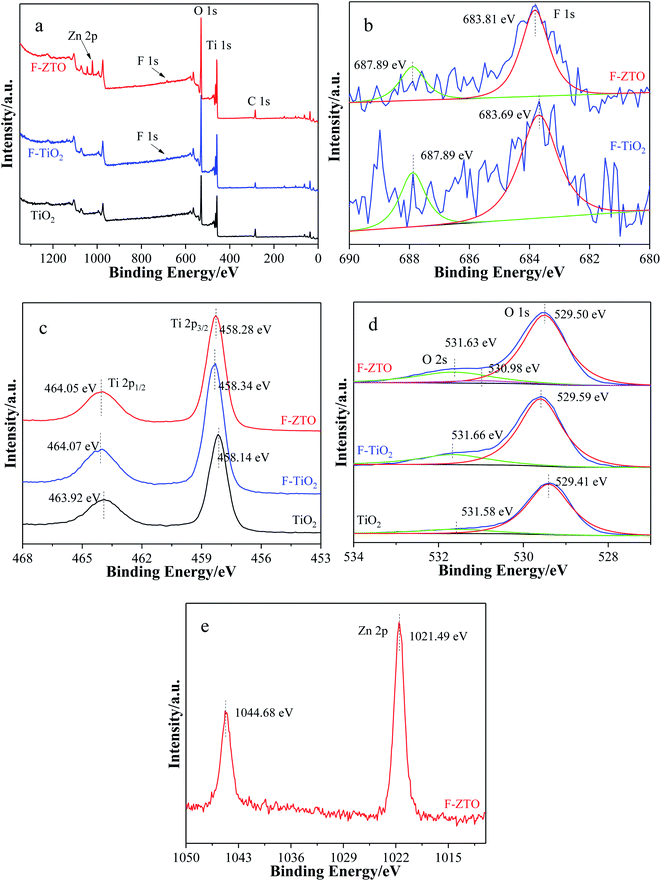 | ||
| Fig. 7 XPS spectra of different TiO2. (a) Survey, (b) F 4f peaks (c) Ti 2p peaks, (d) O 1s and O 2s peaks, and (e) Zn 2p peaks. | ||
In Fig. 7b, signs of F− can be clearly detected in F-TiO2 and F-ZTO. There are two characteristic peaks in F-TiO2 and F-ZTO, one at 687.89 eV in both F-TiO2 and F-ZTO, and the other peaks are at 683.69 eV and 683.81 eV respectively. The former is caused by some fluorine ions entering the TiO2 lattice and replacing the lattice oxygen, while the latter is attributed to fluorine ions replacing the hydroxyl groups on the TiO2 surface.48 At about 683 eV, the different binding energy between F-TiO2 and F-ZTO is due to the interaction between ZnO and F.
The XPS spectrum of Ti element is shown in Fig. 7c, in which the binding energies of spin orbitals Ti 2p3/2 and Ti 2p1/2 in pure TiO2 are 458.14 eV and 463.92 eV, respectively, indicating that titanium exists in the form of Ti4+.49 In comparision with pure TiO2, the binding energies of Ti orbitals in F-TiO2 samples increase by 0.20 eV and 0.15 eV, while the binding energies of spin orbitals Ti 2p3/2 and Ti 2p1/2 of F-ZTO decrease by 0.06 eV and 0.02 eV respectively as compared with F-TiO2, indicating that fluorination and ZnO coupling have an impact on the chemical bond environment around Ti4+, and the fluorination modification is the most obvious. This is because the fluorine ions adsorbed on the surface of titanium dioxide have a high electronegativity, which can strongly attract electrons around Ti atoms. In addition, some F atoms replace the oxygen atoms in the lattice to form Ti–F bonds. The combined action reduces the electron cloud density of Ti atoms, thus enhancing the binding energy of Ti 2p3/2 and Ti 2p1/2.50 The coupling of ZnO leads to the improvement of electron cloud density around Ti atom and the decrease of binding energy of Ti 2p3/2 and Ti 2p1/2. On the whole, fluorination has a significantly effect on the binding energy of Ti, making the peak of Ti move towards the high energy direction. The reason is that in the complete structure of titanium dioxide, one oxygen atom can form three O–Ti bonds with three titanium atoms, while when F occupies part of the oxygen position. When F atom is on the sample surface, one fluorine atom can only form one F–Ti bond with one titanium atom. When the F atom enters the titanium dioxide lattice, one fluorine atom forms two F–Ti bonds with two titanium atoms.51 When Zn replaces Ti, in an octahedron of titanium dioxide, six Ti–O bonds formed by titanium and oxygen atoms become four Zn–O bonds formed by zinc and oxygen atoms. In terms of the number of bonds, F atom has a significantly influence on the chemical environment around Ti atom. In addition, fluorine atoms form F–Ti bonds with titanium atoms, while Zn–O–Ti bonds are formed among oxygen atoms, zinc atoms and titanium atoms. From the view of bond distance, F atom has a more immediate effect on the chemical environment around Ti atom.
Fig. 7d shows the XPS spectrum of O element. The binding energy of F-ZTO and F-TiO2 in O 1s orbit is 0.09 eV and 0.18 eV higher than that of simple TiO2. The reason is that F enters the titanium dioxide lattice to form O–Ti–F bond, which affects the electron cloud density of the surrounding O atoms. After the introduction of Zn, some Ti–O–Zn bonds are brought, resulting in the variation of TiO2 lattice constant and the binding energy of O atoms. The peak at about 531.60 eV is attributed to hydroxyl oxygen. It can be seen that the peak of simple TiO2 is significantly lower than the other two samples, which is mainly due to the promotion of hydroxyl generation on the surface of titanium dioxide by fluorination. The peak at 530.98 eV of F-ZTO sample belongs to Zn–O bond.
Fig. 7e is the XPS diagram of Zn 2p. The binding energies of the characteristic peaks at 1021.49 eV and 1044.68 eV, are corresponded to Zn 2p3/2 and Zn 2p1/2 respectively, indicating that Zn is existed in the form of +2 valence.52 Compared with the binding energy of simple ZnO (1021.42 eV and 1044.42 eV),53 the binding energy of F-ZTO composite shifts by 0.07 eV and 0.26 eV respectively. Moreover, the quantitative analysis of XPS indicates that the element composition of TiO2 is Ti, O and C, and the contents of each element are 25.48 at%, 50.89 at%, and 23.63 at%, respectively. The element composition of F-TiO2 is Ti, O, C and F, with a content of 26.17 at%, 58.06 at%, 13.47 at%, 2.3 at%, respectively. The element composition of F-ZTO is Ti, O, C, F and Zn, and the ratios are 23.72 at%, 54.84 at%, 16.87 at%, 1.94 at%, and 2.63 at%, respectively. It can be seen that the molar ratio of O/T in pure TiO2 sample is basically 2![[thin space (1/6-em)]](https://www.rsc.org/images/entities/char_2009.gif) :
:![[thin space (1/6-em)]](https://www.rsc.org/images/entities/char_2009.gif) 1, while that in F-TiO2 and F-ZTO samples is greater than the standard stoichiometric ratio of TiO2 2
1, while that in F-TiO2 and F-ZTO samples is greater than the standard stoichiometric ratio of TiO2 2![[thin space (1/6-em)]](https://www.rsc.org/images/entities/char_2009.gif) :
:![[thin space (1/6-em)]](https://www.rsc.org/images/entities/char_2009.gif) 1, which is caused by the surface hydroxyl (–OH) on the surface of titanium dioxide promoted by F−. –OH exists on the surface of titanium dioxide via chemisorption, that is, the O content raises. Although the entering of F− in the lattice of titanium dioxide reduces the O ratio, however, the former dominates. The increase of O content is a result of comprehensive effects of multi-factors. In the F-ZTO sample, the Zn/Ti ratio added is in ratio of 6%, however, the tested result is 11.09 at%. This may be due to the different precipitation equilibrium constant (KSP) of zinc and titanium in the coprecipitation process, which results in the difference between the theoretical and the actual levels in the F-ZTO samples.
1, which is caused by the surface hydroxyl (–OH) on the surface of titanium dioxide promoted by F−. –OH exists on the surface of titanium dioxide via chemisorption, that is, the O content raises. Although the entering of F− in the lattice of titanium dioxide reduces the O ratio, however, the former dominates. The increase of O content is a result of comprehensive effects of multi-factors. In the F-ZTO sample, the Zn/Ti ratio added is in ratio of 6%, however, the tested result is 11.09 at%. This may be due to the different precipitation equilibrium constant (KSP) of zinc and titanium in the coprecipitation process, which results in the difference between the theoretical and the actual levels in the F-ZTO samples.
3.7 Isoelectric point analysis
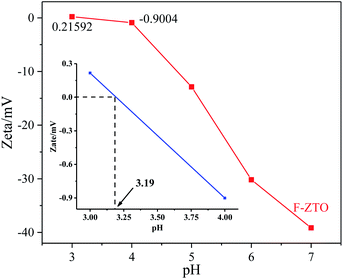
In order to determine the isoelectric point of F-ZTO, the zeta potential of F-ZTO at different pH values have been tested, and the result is given in Fig. 8. When testing the zeta potential of the solution, the particle is positively charged due to the H+ adsorption by hydroxyl groups on the particle surface in the solution with a low pH value, and negatively charged because of the loss of proton H+ from the particle surface. The potential on the particle surface can be adjusted to zero by the pH, which is called isoelectric point of the sample. When preparing the solution for measuring zeta potential by adjusting the pH, the reactions on the surface of titanium dioxide are shown by formula (4) and (5).54| –Ti–OH + H+ ⇌ –Ti–OH2+ | (4) |
| –Ti–OH + OH− ⇌ –Ti–O− + H2O | (5) |
It can be seen from the formulas that the number of surface hydroxyl groups is closely related to the charge on the powder surface and the isoelectric point.55 It can be seen from Fig. 8 that the isoelectric points of F-ZTO is about 3.19. As reported by Qiu et al.55 the isoelectric point of TiO2 is about 4.5–5.5, thus, it can be seen that the fluorination and zinc oxide coupling could significantly affect the isoelectric point of TiO2 and then influence the performance of the sample. As we known, the pH has a great influence on the photocatalytic performance of the photocatalyst. When the pH is lower than the isoelectric point, the catalyst surface is positively charged, and Na+ and negatively charged chromogenic groups are ionized by methyl orange. The chromogenic groups are captured by electrostatic action, that is, the removal rate is high. When the pH is higher than the isoelectric point of the sample, the catalyst surface is negatively charged, and the chromophore is negatively charged, which results in a lower degradation rate due to electrostatic repulsion.56 That is why TiO2 shows a better photocatalytic performance under acidic conditions.
3.8 EPR analysis
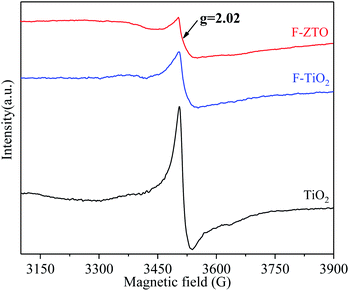
The oxygen vacancies in various TiO2 samples were investigated by electron paramagnetic resonance (EPR) characterization. Fig. 9 shows the EPR spectra of three samples. It can be clearly observed from Fig. 9 that obvious absorption signals at g = 2.02 can be detected in the three samples. The absorption signals are generally considered to be the electron paramagnetic resonance enhancement position corresponding to Ti3+, that is, there are a large number of oxygen vacancies in simple TiO2.57,58 After fluorination, the oxygen vacancies in TiO2 are significantly reduced. The reason may be that F enters the titanium dioxide lattice and fills the oxygen vacancies. As mentioned in the preceding analysis, F-ZTO primarily exists in the form of ZnO–TiO2 heterostructure, and ZnO is mainly distributed on the surface of TiO2. It is known that defects can be inside and on the surface of titanium dioxide crystal. When partial Zn2+ just forms ZnO at the oxygen vacancy on the surface of titanium dioxide, the oxygen vacancies are filled by oxygen atoms. As a result, the number of oxygen vacancies decreases compared with fluorinated TiO2. In addition, PL analysis shows that the recombination rate of electron and hole pairs of F-ZTO is lower than that of F-TiO2. This again shows that the F-ZTO sample is primarily a heterostructure formed by ZnO and TiO2. The XRD analysis also mentioned that only a small part of Zn is doped into the titanium dioxide lattice, accompanied by a certain amount of oxygen vacancies due to the difference in charge, which should result in the increase of oxygen vacancy peak in the EPR spectrum of F-ZTO. However, the ZnO–TiO2 heterostructure action plays a dominant role. The comprehensive actions of ZnO–TiO2 heterostructure and doping result in the reduction of the number of oxygen vacancies.3.9 Photocatalytic performance
The degradation rate of methyl orange by different TiO2 photocatalysts is shown in Fig. 10. It can be seen that the degradation sequence of methyl orange under the action of different catalysts was 6% > 5% > 7% > 0% > TiO2 > blank. After dark treatment for 30 min, the absorbance of methyl orange solution by different groups were almost maintained, which illustrates that the adsorption effect is not obvious. The absorbance of methyl orange solution without photocatalyst had basically not changed, indicating that the decolorization of methyl orange was mainly realized via photocatalysis.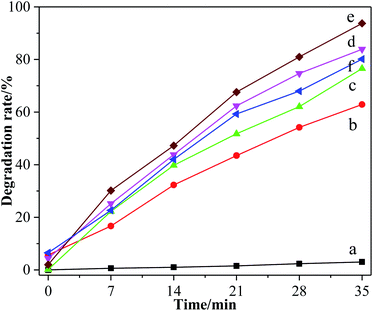 | ||
| Fig. 10 Decolorization of methyl orange by different TiO2. (a) Blank group, (b) pure TiO2, (c) F-TiO2, (d) 5% F-ZTO, (e) 6% F-ZTO and (f) 7% F-ZTO. | ||
Under the same conditions, the decolorization rate of methyl orange by simple TiO2, F-TiO2 and 6% F-ZTO was 62.89%, 76.56%, and 93.75%, respectively. The degradation rate of methyl orange by 6% F-ZTO was significantly higher than of the former two, illustrating that when an appropriate amount of ZnO was coupled with F-TiO2 for modification, the photocatalytic efficiency can be significantly improved.
In this work, the photocatalytic performance of F-TiO2 is better than that of simple TiO2. The reasons can be summarized as follows: first, demonstrated by BET analysis, the specific surface area of F-TiO2 is greater than that of pure TiO2; second, F-modified TiO2 promotes the formation of hydroxyl radical which is helpful for photocatalysis; in addition, the absorption intensity of TiO2 particles in the ultraviolet region is significantly elevated after F− modification; moreover, the surface acidity of titanium dioxide is improved by treating with F−;59 the above four aspects greatly improve the photocatalytic performance of TiO2. The degradation of methyl orange was significantly promoted by the introduction of ZnO to couple with F-TiO2 to form F-ZTO composites.
The first reason is that the specific surface area of F-ZTO prepared by coprecipitation is larger and the pore size distribution is wider than that of F-TiO2. In addition, the grain size of F-ZTO sample is smaller. Moreover, from the fluorescence analysis, the photoluminescence intensity of F-ZTO is much weaker than that of F-TiO2, illustrating that the photogenerated electron and hole pairs generated by F-ZTO samples are not easy to recombine when excited by light, which raises the photocatalytic degradation efficiency.
3.10 Photodegradation repeatability
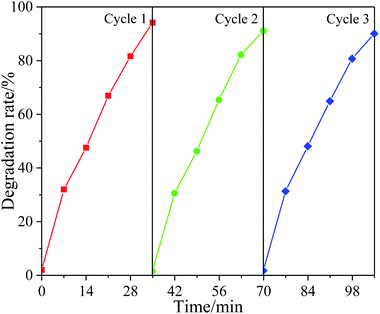
In practical application, cyclic stability is an important factor to evaluate the performance of catalysts. In order to study the cyclic utilization performance of the synthesized photocatalytic materials. The 6% F-ZTO catalyst after photocatalytic reaction was recovered from the solution, and then the recovered photocatalyst was used to degrade methyl orange under the same conditions. As shown in Fig. 11, the degradation rate of methyl orange by 6% F-ZTO for the first time was 94.17%. Then, the continuous experiments of methyl orange degradation were carried out, and the rates were 91.01% and 89.95% respectively. In the three consecutive experiments, the photocatalytic activity did not show obvious decrease, indicating that 6% F-ZTO had a good recycling performance.3.11 Photocatalytic degradation mechanism
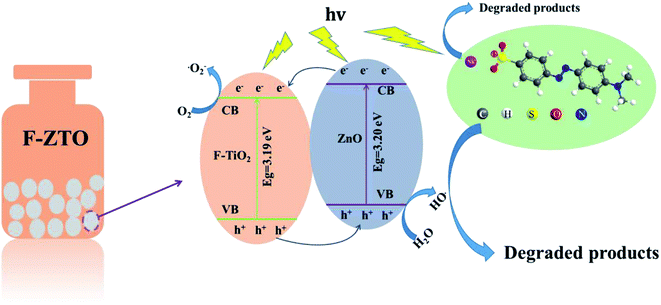
According to the semiconductor energy band theory, the degradation mechanism of self-made F-ZTO composites on methyl orange is speculated, given in Fig. 12. It can be seen that the band gap widths of F-TiO2 and ZnO are 3.19 eV and 3.20 eV, respectively. Due to different energy level positions of the two semiconductor materials, their coupling forms a staggered heterojunction structure. When F-ZTO is irradiated by light with energy greater than the band gap, the holes generated by F-TiO2 excitation will migrate to ZnO valence band, and the photogenerated electrons formed by ZnO stimulation will transform to F-TiO2.The reverse movement of photogenerated electrons and holes effectively inhibits their recombination.40 Electron acceptors such as oxygen (O2), etc. adsorbed on the photocatalyst surface capture the photogenerated electrons and photogenerated holes trap electron donors such as water (H2O), etc. to increase the number of superoxide radicals (˙O2−) and ˙OH radicals, respectively. Methyl orange is oxidized into small inorganic molecules such as H2O and CO2, etc. with the action of strong oxidants ˙O2− and ˙OH. The reaction mechanism of photocatalytic degradation process is shown as follows:60
| ZnO/F-TiO2 + hν(λ < 388 nm) → ZnO/F-TiO2(e−) + ZnO/F-TiO2(h+) | (6) |
| ZnO/F-TiO2(h+) + H2O → ZnO/F-TiO2(˙OH) + H+ | (7) |
| ZnO/F-TiO2(e−) + O2 → ZnO/F-TiO2(˙O2−) | (8) |
| ZnO/F-TiO2(˙OH) + Cdye → ZnO/F-TiO2 + products | (9) |
| ZnO/F-TiO2(˙O2−) + Cdye → ZnO/F-TiO2 + products | (10) |
4. Conclusions
Fluorinated ZnO–TiO2 composites was prepared by simple coprecipitation method, and the product has a good degradation effect on methyl orange. Fluorination promotes the formation of hydroxyl radical, reduces the grain size, increases the specific surface area and enhances the UV absorption, which eventually contributes to the improvement of photocatalytic performance. The introduction of ZnO into F-TiO2 reduces the grain size, enhances the specific surface area, promotes the separation of photogenerated electrons and holes, and significantly raises the photocatalytic activity of F-ZTO. This work provides a new idea for the preparation of photocatalytic materials.Conflicts of interest
The authors declare that they have no conflict of interest.Acknowledgements
This work was funded by the Applied Fundamental Research of Sichuan Province (No. 2019YJ0383), and the Special Agricultural Resources in Tuojiang River Basin Sharing and Service Platform of Sichuan Province.References
- C. Li, T. Shen and Y. Wang, et al., Efficient technique for simultaneous lead recovery and PbO2/Ti electrode preparation for electrocatalytic degradation of basic red, J. Nanosci. Nanotechnol., 2020, 20(9), 5874–5884 CrossRef CAS PubMed.
- K. Nsah, L. Marly and K. Takaomi, Ultrasonic degradation of diaminobenzidine in aqueous medium, Ultrason. Sonochem., 2019, 52, 69–76 CrossRef PubMed.
- Y. J. Guo, W. Cheng and P. S. Liu, Porous ceramic foam loading titanium dioxide for photocatalytic degradation of the methyl orange solution, Multidiscip. Model. Mater. Struct., 2019, 15(6), 1366–1378 CrossRef CAS.
- Y. J. Lee, J. K. Kang and S. J. Park, et al., Photocatalytic degradation of neonicotinoid insecticides using sulfate-doped Ag3PO4 with enhanced visible light activity, Chem. Eng. J., 2020, 402, 126183 CrossRef CAS.
- S. Lang, K. Zhao and S. Liu, Photocatalytic degradation of MO and phenol over novel β-CoOOH/g-C3N4 composite under visible light irradiation, Mater. Lett., 2018, 228, 121–124 CrossRef.
- Y. Zhao, B. Yin and G. Zhang, et al., Facile fabrication of plate-like Bi3O4Cl for visible-light-driven photocatalytic degradation of tetracycline hydrochloride, Micro Nano Lett., 2018, 13(1), 9–11 CrossRef CAS.
- T. T. Zhang, L. F. Chen and T. Jiang, et al., Chemical precipitation synthesis of Bi0.7Fe0.3OCl nanosheets via Fe (III)-doped BiOCl for highly visible light photocatalytic performance, Mater. Today Commun., 2021, 26, 102145 CrossRef CAS.
- P. Rathore, R. Ameta and S. Sharma, Photocatalytic degradation of azure a using N-doped zinc oxide, J.Text. Sci. Technol., 2015, 1(3), 118–126 CrossRef.
- Z. Bahreini, V. Heydari and A. N. Hekmat, et al., A comparative study of photocatalytic degradation and mineralisation of an azo dye using supported and suspended nano-TiO2 under UV and sunlight irradiations, Pigm. Resin Technol., 2016, 45(2), 119–125 CrossRef CAS.
- H. Wang, L. Yang and H. Yu, et al., A highly efficient and stable visible-light plasmonic photocatalyst Ag-AgCl/CeO2, World J. Nano Sci. Eng., 2011, 1(4), 129–136 CrossRef CAS.
- A. Hussain, J. H. Hou and M. Tahir, et al., Fine-tuning internal electric field of BiOBr for suppressed charge recombination, J. Environ. Chem. Eng., 2021, 9(1), 104766 CrossRef CAS.
- M. Yang, T. Huang and N. Tang, et al., Structure and catalytic performance of Zn-doped TiO2 film, Pigm. Resin Technol., 2019, 48(6), 508–514 CrossRef CAS.
- S. G. Kumar and L. G. Devi, Review on modified TiO2 photocatalysis under UV/visible light: selected results and related mechanisms on interfacial charge carrier transfer dynamics, J. Phys. Chem. A, 2011, 115(46), 13211–13241 CrossRef CAS PubMed.
- Y. Zhang, J. Xu and P. Xu, et al., Decoration of ZnO nanowires with Pt nanoparticles and their improved gas sensing and photocatalytic performance, Nanotechnology, 2010, 21(28), 285501 CrossRef PubMed.
- X. Wang, Z. Li and J. Shi, et al., One-dimensional titanium dioxide nanomaterials: nanowires, nanorods, and nanobelts, Chem. Rev., 2014, 114(19), 9346–9384 CrossRef CAS PubMed.
- L. Wu, J. C. Yu and X. Fu, Characterization and photocatalytic mechanism of nanosized CdS coupled TiO2 nanocrystals under visible light irradiation, J. Mol. Catal. A: Chem., 2006, 244(1–2), 25–32 CrossRef CAS.
- H. K. Khalilova, S. A. Hasanova and F. G. Aliyev, Photocatalytic removal of organic pollutants from industrial wastewater using TiO2 catalyst, J. Environ. Prot., 2018, 9(6), 691–698 CrossRef CAS.
- Q. Li, M. Lu and W. Wang, et al., Fabrication of 2D/2D g-C3N4/Au/Bi2WO6 Z-scheme photocatalyst with enhanced visible-light-driven photocatalytic activity, Appl. Surf. Sci., 2019, 508, 144182 CrossRef.
- P. Nagaraju, S. H. Puttaiah and K. Wantala, et al., Preparation of modified ZnO nanoparticles for photocatalytic degradation of chlorobenzene, Appl. Water Sci., 2020, 10(6), 1–15 Search PubMed.
- T. Luo, X. J. Wan and S. X. Jiang, et al., Preparation and photocatalytic performance of fibrous Tb3+-doped TiO2 using collagen fiber as template, Appl. Phys. A, 2018, 124(4), 304 CrossRef.
- D. Vivekanandan, M. Sakthivel and M. S. Srinivasa, et al., Fabrication and characterization of TiO2 particulate filled agave Americana fiber-reinforced polyester resin composites, Pigm. Resin Technol., 2019, 6(48), 533–539 Search PubMed.
- S. V. Alagarsamy and M. Ravichandran, Investigations on tribological behaviour of AA7075-TiO2 composites under dry sliding conditions, Ind. Lubr. Tribol., 2019, 9(71), 1064–1071 Search PubMed.
- S. Wang, Y. Zhu and X. Sun, et al., Microwave synthesis of N-doped modified graphene/mixed crystal phases TiO2 composites for Na-ion batteries, Colloids Surf., A, 2021, 615, 126276 CrossRef CAS.
- F. Fatemeh, E. Mehdi and Z. Ramin, et al., Application of electrochemical techniques for determining and extracting natural product (EgCg) by the synthesized conductive polymer electrode (Ppy/Pan/rGO) impregnated with nano-particles of TiO2, Sci. Rep., 2019, 9(6), 227–247 Search PubMed.
- Q. Gao, F. Si and S. Zhang, et al., Hydrogenated F-doped TiO2 for photocatalytic hydrogen evolution and pollutant degradation, Int. J. Hydrogen Energy, 2019, 44(16), 8011–8019 CrossRef CAS.
- Q. Chen, A. Ozkan and B. Chattopadhyay, et al., N-doped TiO2 photocatalyst coatings synthesized by a cold atmospheric plasma, Langmuir, 2019, 35(22), 7161–7168 CrossRef CAS PubMed.
- D. Rebleanu, C. Gaidau and G. Voicu, et al., The impact of photocatalytic Ag/TiO2 and Ag/N-TiO2 nanoparticles on human keratinocytes and epithelial lung cells, Toxicology, 2019, 416, 30–43 CrossRef CAS PubMed.
- Z. Yu, J. Lan and Q. Wang, Preparation, characterization and enhanced photocatalytic activities of Fe, F co-doped TiO2 nanotubes, Micro Nano Lett., 2019, 14(1), 66–68 CrossRef CAS.
- Z. Wang, Y. Chen and L. Zhang, et al., Step-scheme CdS/TiO2 nanocomposite hollow microsphere with enhanced photocatalytic CO2 reduction activity, J. Mater. Sci. Technol., 2020, 56, 143–150 CrossRef.
- M. R. Safaei, A. Hajizadeh and M. Afrand, et al., Evaluating the effect of temperature and concentration on the thermal conductivity of ZnO-TiO2/EG hybrid nanofluid using artificial neural network and curve fitting on experimental data, Phys. A, 2019, 519, 209–216 CrossRef CAS.
- L. Sharma, J. Kumar and R. Chhibber, Experimental investigation on high temperature wettability and structural behaviour of SAW fluxes using MgO-TiO2-SiO2 and Al2O3-MgO-SiO2 flux system, Ceram. Int., 2020, 46(5), 5649–5657 CrossRef CAS.
- E. P. Melián, O. G. Díaz and J. M. D. Rodríguez, et al., Effect of deposition of silver on structural characteristics and photoactivity of TiO2-based photocatalysts, Appl. Catal., B, 2012, 127, 112–120 CrossRef.
- F. Lin, Y. Chen and L. Zhang, et al., Single-facet dominant anatase TiO2 (101) and (001) model catalysts to elucidate the active sites for alkanol dehydration, ACS Catal., 2020, 10(7), 4268–4279 CrossRef CAS.
- Z. Wang, S. Liu and X. Cao, et al., Preparation and characterization of TiO2 nanoparticles by two different precipitation methods, Ceram. Int., 2020, 46(10), 15333–15341 CrossRef CAS.
- M. Wang, S. Tan and S. Kan, et al., In situ assembly of TiO2 with high exposure of (001) facets on three-dimensional porous graphene aerogel for lithium-sulfur battery, J. Energy Chem., 2020, 49, 316–322 CrossRef.
- T. Wei, B. Niu and G. Zhao, Highly characteristic adsorption based on single crystal {001}-TiO2 surface molecular recognition promotes enhanced oxidation, ACS Appl. Mater. Interfaces, 2020, 12(35), 39273–39281 CrossRef CAS PubMed.
- C. Minero, G. Mariella and A. Maurino, et al., Photocatalytic transformation of organic compounds in the presence of inorganic anions. 1. hydroxyl-mediated and direct electron-transfer reactions of phenol on a titanium doxide-fluoride system, Langmuir, 2000, 26(16), 350–356 Search PubMed.
- J. C. Yu, J. Yu and W. Ho, et al., Effects of F− doping on the photocatalytic activity and microstructures of nanocrystalline TiO2 powders, ChemInform, 2002, 33(47), 12 Search PubMed.
- Y. H. Zhong, Q. Zhou and J. Q. Liu, et al., Preparation of fluorizated TiO2 hollow microspheres and their photocatalytic activity, Chin. J. Inorg. Chem., 2013, 29(10), 2133–2139 CAS.
- Y. Yu, B. H. Yao and F. Yang, et al., Preparation and photocatalytic properties of TiO2-ZnO composite hollow microspheres, Acta Mater. Compositae Sin., 2019, 36(1), 206–212 Search PubMed.
- H. G. Yang, C. H. Sun and S. Z. Qiao, et al., Anatase TiO2 single crystals with a large percentage of reactive facets, Nature, 2008, 453, 638–641 CrossRef CAS PubMed.
- Z. Han, J. Zhang and X. Yang, et al., Synthesis and photoelectric property of poly (3-octylthiophene)/zinc oxide complexes, Sol. Energy Mater. Sol. Cells, 2010, 94(2), 194–200 CrossRef CAS.
- S. M. Adyani and M. Ghorbani, A comparative study of physicochemical and photocatalytic properties of visible light responsive Fe, Gd and P single and tri-doped TiO2 nanomaterials, J. Rare Earths, 2017, 36(1), 78–91 Search PubMed.
- V. N. Kuznetsov and N. Serpone, Visible light absorption by various titanium dioxide specimens, J. Phys. Chem.B, 2006, 110(50), 25203–25209 CrossRef CAS PubMed.
- X. Jaramillo-Fierro, S. González and H. A. Jaramillo, et al., Synthesis of the ZnTiO3/TiO2 nanocomposite supported in ecuadorian clays for the adsorption and photocatalytic removal of methylene blue dye, Nanomaterials, 2020, 10(9), 1891 CrossRef CAS PubMed.
- V. M. Ramakrishnan, N. Muthukumarasamy and P. Balraju, et al., Transformation of TiO2 nanoparticles to nanotubes by simple solvothermal route and its performance as dye-sensitized solar cell (DSSC) photoanode, Int. J. Hydrogen Energy, 2020, 45(31), 15441–15452 CrossRef.
- T. A. Kurniawan, Z. Mengting and D. Fu, et al., Functionalizing TiO2 with graphene oxide for enhancing photocatalytic degradation of methylene blue (MB) in contaminated wastewater, J. Environ. Manage., 2020, 270, 110871 CrossRef CAS PubMed.
- Y. M. Chen, J. Zhong and F. Chen, et al., Low-temperature preparation and photocatalytic performance of F-doped nanosized TiO2 thin film, Chin. J. Catal., 2010, 31(1), 120–125 CAS.
- Y. Zhang, T. Wang and M. Zhou, et al., Hydrothermal preparation of Ag-TiO2 nanostructures with exposed {001}/{101} facets for enhancing visible light photocatalytic activity, Ceram. Int., 2017, 43(3), 3118–3126 CrossRef CAS.
- P. Xu, Y. J. Li and L. Chen, et al., Preparation and visible-light driven photocatalytic performance of mesoporous titania doped with silver, J. Chin. Ceram. Soc., 2014, 42(9), 1195–1202 CAS.
- H. Sheng, H. N. Zhang and W. J. Song, et al., Activation of water in titanium dioxide photocatalysis by formation of surface hydrogen bonds: an in situ IR spectroscopy study, Angew. Chem., Int. Ed., 2015, 54(20), 5905–5909 CrossRef CAS PubMed.
- Y. Wang, X. Xue and H. Yang, Modification of the antibacterial activity of Zn/TiO2 nano-materials through different anions doped, Vacuum, 2014, 101, 193–199 CrossRef CAS.
- X. Chang, Z. Li and X. Zhai, et al., Efficient synthesis of sunlight-driven ZnO-based heterogeneous photocatalysts, Mater. Des., 2016, 98, 324–332 CrossRef CAS.
- A. Mills and G. Porter, Photosensitized dissociation of water using dispersed suspensions of n-type semiconductors, J. Chem. Soc., Faraday Trans., 1982, 78, 3659–3669 RSC.
- Y. L. Qiu, H. L. Chen and X. Z. Wang, et al., Preparation of nanometer titanium dioxide powders by hydrothermal method and their isoelectric points, J. Chem. Eng. Chin. Univ., 2005, 19(1), 129–133 CAS.
- D. L. Lu, F. Ji and W. Wang, et al., Adsorption and photocatalytic decomposition of roxarsone by TiO2 and its mechanism, Environ. Sci. Pollut. Res., 2014, 21(13), 8025–8035 CrossRef CAS PubMed.
- H. Li, J. Li and Z. H. Ai, et al., Oxygen vacancy-mediated photocatalysis of BiOCl: reactivity, selectivity, and perspectives, Angew. Chem., Int. Ed., 2018, 57(1), 122–138 CrossRef CAS PubMed.
- K. H. Ye, K. S. Li and Y. R. Lu, et al., An overview of advanced methods for the characterization of oxygen vacancies in materials, TrAC, Trends Anal. Chem., 2019, 116, 102–108 CrossRef CAS.
- D. G. Huang, S. J. Liao and Z. Dang, Preparation, characterization and photocatalytic performance of anatase F doped TiO2 sol, Acta Chim. Sin., 2006, 64(17), 1805–1811 CAS.
- D. Tekin, H. Kiziltas and H. Ungan, Kinetic evaluation of ZnO/TiO2 thin film photocatalyst in photocatalytic degradation of Orange G, J. Mol. Liq., 2020, 306, 112905 CrossRef CAS.
| This journal is © The Royal Society of Chemistry 2021 |

