 Open Access Article
Unexpected reactivity related to support effects during xylose hydrogenation over ruthenium catalysts†
Léa Vilcocq *,
Ana Paez,
Victoria D. S. Freitas
 ,
Laurent Veyre,
Pascal Fongarland
 and
Régis Philippe
Catalysis, Polymerisation, Processes, Materials (CP2M), UMR 5128 – CNRS, Université Claude-Bernard Lyon 1, CPE-Lyon, Villeurbanne, F-69616, France. E-mail: lea.vilcocq@cnrs.fr
First published on 10th December 2021
Abstract
Xylose is a major component of hemicelluloses. In this paper, its hydrogenation to xylitol in aqueous medium was investigated with two Ru/TiO2 catalysts prepared with two commercial TiO2 supports. A strong impact of the support on catalytic performance was evidenced. Ru/TiO2-R led to fast and selective conversion of xylose (100% conversion in 2 h at 120 °C with 99% selectivity) whereas Ru/TiO2-A gave a slower and much less selective transformation (58% conversion in 4 h at 120 °C with 17% selectivity) with the formation of several by-products. Detailed characterization of the catalysts with ICP, XRD, FTIR, TEM, H2 chemisorption, N2 porosimetry, TPR and acid–base titration was performed to elucidate the role of each support. TiO2-R has a small specific surface area with large ruthenium nanoparticles in weak interaction with the TiO2 support and no acidity, whereas TiO2-A is a mesoporous material with a large specific surface area that is mildly acidic, and bears small ruthenium particles in strong interaction with the TiO2 support. The former was very active and selective for xylose hydrogenation to xylitol whereas the latter was less active and poorly selective. Moreover, careful analysis of the reaction products also revealed that anatase TiO2 can catalyze undesired side-reactions such as xylose isomerisation to various pentoses, and therefore the corresponding unexpected polyols (arabitol, ribitol) were produced during xylose conversion by hydrogenation. In a first kinetic approach, a simplified kinetic model was built to compare quantitatively intrinsic reaction rates of both catalysts. The kinetic constant for hydrogenation was 20 times higher for Ru/TiO2-R at 120 °C.
Introduction
Biomass is a unique source of renewable carbon on our planet. In the current context of fossil resources depletion, increase in the world demand for fuels and chemicals, and global climate change due to CO2 emissions from fossil sources, the development of biobased chemicals appears critical for a sustainable future. Today, biobased chemistry represents 177 M€ per year and 7.9 Mt per year in Europe, i.e. 35% of the chemical industry market and 10% of all carbon-based materials, without including biofuels nor food manufacture. As 85% of chemical compounds could be technically biosourced, the European Union's target is 25 wt% of biosourced carbon-based materials in 2030.1Lignocellulose, as the main constituent of fibrous plants (e.g. herbs, straws, trees), is a major source of biomass. It is constituted by three components: cellulose, a crystalline glucose homopolysaccharide, lignin, a phenolic macropolymer, and hemicellulose, an amorphous heteropolysaccharide. The latter represents 20 to 40 wt% of lignocellulose.2
Hemicellulose is a polymer of different sugars bearing six carbon atoms (hexoses, e.g. glucose, mannose, galactose) or five carbon atoms (pentoses, e.g. xylose, arabinose), arranged in linear and branched structures, in which acetyl groups can also be found.5 The composition of hemicelluloses varies with the type of biomass. For example, xylans are predominant in hardwood hemicelluloses.6
Xylose is the main ex-hemicellulose sugar from xylan. It is a starting material for various processes,3,4 and as such was identified as one of the Top 10 and then Top 12 platform biomolecules.7,8 It is notably used to produce furfural, furan dicarboxylic acid (FDCA), γ-valerolactone (GVL), glycols, etc. However, the main industrial xylose-based process is the production of xylitol. This polyol is used in food industry and pharmaceutical industry as an additive and as a low calorie sweetener. Its market is evaluated ca. 300 kton per year.9 It is industrially produced by selective catalytic hydrogenation. Other polyols can be produced from pentoses, such as arabitol, from arabinose, lyxose or ribulose, and ribitol (also known as adonitol) from ribose or ribulose. Both arabitol and ribitol are used as pharmaceutical ingredients.10
Historically, Raney nickel was used as heterogeneous catalyst for the hydrogenation of glucose and xylose.11–13 Nickel is advantageous because of its low price, but can leach easily in aqueous phase and leads to toxicity issues. Thus, some authors tried to reduce Ni leaching from nickel catalysts.14–17 Ni catalyst supported on nitrogen-doped carbon was used for 40 h presenting high catalytic activity. Although, high temperatures (ca. 150 °C) were necessary to obtain high xylitol yields.16 Bimetallic catalysts were also used in literature.17–19 The use of Sn associated to Pt was beneficial to the conversion and selectivity of the catalyst to xylitol synthesis. Thus, the increase of Sn amount in catalyst favoured by-products synthesis.18 Aiming to reduce the catalyst deactivation, Ni was used associated with Re. Both monometallic and bimetallic catalysts presented Ni leaching in reaction media, but the presence of Re decreased this deactivation, helping to increase catalyst stability.17 However, few catalysts presented high catalytic activity associated to high selectivity towards sugar alcohols.
Ru/C is today the main catalyst for xylose hydrogenation at laboratory scale.13 Indeed, ruthenium is an oxophilic metal particularly active for aqueous phase hydrogenation of carbonyl groups.20 It presents a catalytic activity superior to other metals in the xylose hydrogenation reaction, in the following the order: Ru > Ni ≈ Co > Pt > Rh ≈ Pd.11,21 Its price is also interesting for industrial applications, as ruthenium is much less expensive than palladium or platinum.22
The choice of supports is critical for such an aqueous phase reaction, as water can induce several deactivation phenomena such as leaching, phase changes through hydration, collapsing of porous structures, etc. Few candidates have been identified as stable supports in water: carbon materials, titanium dioxide (TiO2), zirconium dioxide (ZrO2).23 Among them, TiO2 has the property to assist H2 activation via a spillover phenomenon24 and is thus a promising support for ruthenium in aqueous phase hydrogenation reactions. TiO2 can exist in several crystalline phases but the most common for catalysis applications are anatase and rutile.
Ru/TiO2 was already studied for xylose and glucose hydrogenation reactions14,25,26 but the impact of support properties, such as crystalline phase, was reported in only one article so far. Hernandez-Mejia et al. compared the activities of Ru/TiO2 catalysts with different TiO2 supports from 100% anatase to 100% rutile and observed a higher yield of xylitol when rutile was present.27 In their experimental conditions, TiO2 rutile led to smaller ruthenium nanoparticles during catalyst synthesis. Therefore, they attributed the higher activity in xylose hydrogenation to the higher number of surface ruthenium atoms, i.e. the catalytic sites, on the catalyst surface. However, they did not explain the decrease of selectivity observed with TiO2 anatase as a support nor identify reaction by-products. The decrease of activity for TiO2 anatase was interpreted only as a consequence of low ruthenium dispersion on the support.
The impact of TiO2 support on ruthenium particle size was also described for other catalytic applications, but contradictory results were obtained. For example, Zhang et al. observed smaller ruthenium nanoparticles on TiO2 anatase than on TiO2 rutile,24 whereas other authors observed smaller ruthenium nanoparticles and a more homogeneous repartition of nanoparticles on TiO2 rutile.27–30
In this paper, the impact of TiO2 support on the reactivity of ruthenium catalysts in xylose hydrogenation was investigated with a focus on the differences in reactivity observed when different supports are used. Two catalysts with two different commercial TiO2, anatase and rutile, were prepared, characterized and tested for xylose hydrogenation. Xylose conversion and the production of xylitol and other by-products were studied to understand the role of each support on the behaviour of Ru/TiO2 catalysts.
Experimental
Materials
Ruthenium(III) chloride (RuCl3·xH2O) and xylose were purchased from Sigma-Aldrich and xylitol was purchased from Acros Organics with purity higher than 98%. Two TiO2 supports were used: TiO2 anatase with high specific surface area from Alfa Aesar (CAS 1317-70-0, reference 44429) and TiO2 rutile from Sigma Aldrich (CAS 1317-80-2, reference 224227). All the materials were used without further purification.Catalyst preparation
The catalysts were prepared by incipient wetness impregnation. TiO2 was crushed in powder, sieved below 90 μm, and dried 2 h at 120 °C. The precursor solution was prepared using a volume of ethanol necessary to wet the support and the appropriate amount of RuCl3·xH2O. The solution was added drop by drop to the dry support until the formation of a homogenous paste. Finally, this paste was dried overnight at 120 °C and crushed afterward. The powder was calcined at 250 °C under N2 flow and reduced at 350 °C under H2 flow in a tubular oven. The corresponding catalysts were named Ru/TiO2-A and Ru/TiO2-R.Catalyst characterization
X-ray diffraction (XRD) was performed at Centre de Diffraction Henri Longchambon (CDHL) on a diffractometer Bruker D8 Advance with 2θ until 90°.Infrared (IR) was performed at IRCELYON in absorbance mode using a Vector 22 apparatus on a Nicolet IS5 equipped with an ID7-ATR accessory with diamond crystal from Thermo Scientific with a spectral range of 4000 cm−1 to 525 cm−1.
N2 physisorption was performed on a Micrometrics ASAP 2010 apparatus at −196 °C; samples were pre-treated at 350 °C under vacuum for 4 hours before physisorption.
The acid site concentration in water of each catalyst was measured using a potentiometric titration following the method described by Yu et al.31 Briefly, 250 mg of catalyst was dried at 120 °C and then was stirred at room temperature in 50 mL of a 0.1 M NaCl solution under sparging N2. The suspension was titrated by a NaOH 0.1 M solution using a Mettler Toledo G20S titrator equipped with a DGI 115 SC electrode. Three equivalence points were determined for TiO2-A and only one for TiO2-R. At each equivalence point, a pKa and an acid sites concentration were determined using the Gran plot method.31–33
ICP analysis was performed by two external laboratories (IRCELYON and SOCOR) after mineralization of catalysts in a closed vessel.
Hydrogen chemisorption studies were carried out in a BELJAPAN BELSORP-max system. In each analysis, ca. 0.4 g of Ru/TiO2 catalyst was used. The sample was first reduced under H2 flow at 350 °C for 3 h (ramp of 3 °C min−1). After reduction, the sample was evacuated at 350 °C for 3 h. The chemisorption measurements were performed at 75 °C. The number of available Ru atoms (RuA) was calculated from total adsorption of H2 with a stoichiometry H![[thin space (1/6-em)]](https://www.rsc.org/images/entities/char_2009.gif) :
:![[thin space (1/6-em)]](https://www.rsc.org/images/entities/char_2009.gif) Ru equal to 2
Ru equal to 2![[thin space (1/6-em)]](https://www.rsc.org/images/entities/char_2009.gif) :
:![[thin space (1/6-em)]](https://www.rsc.org/images/entities/char_2009.gif) 1.34
1.34
 | (1) |
STEM-HAADF (Scanning Transmission Electronic Microscopy – High Angle Annular Dark Field) images were taken by a JEOL 2100F microscope, with a 200 kV acceleration tension. These characterizations were performed at “Centre Technologique des Microstructures” (CTμ, Villeurbanne, France). Samples were dispersed in ethanol using ultrasound prior the deposition of a few drops on holey carbon films on copper grids. Histograms and mean particle diameters were determined with 200 counts with ImageJ software.
Temperature programmed reduction (TPR) was performed in an apparatus equipped with a TCD detector. The sample of Ru/TiO2 catalyst was pre-oxidized 30 min at 200 °C under 5%O2/He flow, swiped with pure He at room temperature for 30 min and reduced under 5%H2/Ar from room temperature to 800 °C.
Catalytic hydrogenation
The catalytic hydrogenation of xylose was performed in a 120 mL Top Industrie autoclave stirred tank reactor heated by an electrical jacket and equipped with a gas-inducing Rushton turbine and four baffles. The reactor is thermo-regulated and when necessary cooling is ensured by a Ranque–Hilsch vortex device. The reactor is operated in batch mode for liquid (and solid) phase and semi-batch mode for the gas phase. In order to work at constant pressure, H2 contained in a pressurised gas tank was continuously added in the reactor via a pressure regulator. 80 mL of 50 g L−1 xylose solution (0.33 M) and 1.2 g of catalyst (molar ratio Ru/xylose of 0.45 mol%) were introduced in the reactor, which was closed and purged with N2 before heating to the reaction temperature. Time zero was determined as the moment when the reaction mixture reached the programmed temperature and the reactor was pressurized with 40 bar H2. Samples were taken regularly through a sampling valve and filtered with 0.2 μm syringe filters. The absence of external mass transfer limitations at 1600 rpm stirring rate was verified experimentally by varying the stirring rate (ESI – Fig. S1†) and the absence of internal mass transfer limitations was evaluated through estimations of the Weisz-Prater criterion (see ESI† for more details).Analytical methods
HPLC analysis was performed on a Shimadzu apparatus equipped with a RID detector and a Phenomenex Rezex RPM column at 80 °C with pure filtered water as a mobile phase, 0.6 mL min−1. Additionally, a Phenomenex Rezex ROA column and a Phenomenex Rezex RCM column at 50 °C with acidified water (0.005 N H2SO4) were used to confirm the identification of sugars and polyols by comparison with retention times of commercial standards. External calibration with four levels was used for quantification of sugars and polyols. Typical chromatograms are presented in ESI – Fig. S2.† The catalytic tests were duplicated and relative errors values were calculated from the HPLC analysis results and represented below as error bars.The following calculations were used in this work, based on concentrations in mol L−1:
 | (2) |
 | (3) |
 | (4) |
 | (5) |
With initial concentration and concentration at time t (mol L−1), NiC is the number of carbon atoms, MC is the molar mass of carbon (12 g mol−1). Product can be Xylitol or other by-products (Lyxose, Xylulose, Ribulose, Ribitol or Arabitol). Compound can be Xylose, Xylitol or other by-products (Lyxose, Xylulose, Ribulose, Ribitol or Arabitol).
Calculations of kinetic constants, energy of activation (Ea) and Turn-Over Frequency (TOF) are detailed in ESI.†
Results and discussion
Catalysts preparation and characterization
Ru/TiO2 catalysts were prepared by incipient wetness impregnation followed by calcination under N2 and reduction under H2 and characterised by several techniques (Table 1). Ru loading was verified after preparation by ICP analysis. For Ru/TiO2-A, a value of 0.9 wt.%Ru was found and for Ru/TiO2-R, a value of 0.6 wt.%Ru was found.| Catalyst | Ru/TiO2-A | Ru/TiO2-R | |
|---|---|---|---|
| a Calculated using the BJH method. | |||
| XRD | Crystalline phase | 100% anatase | 94% rutile – 6% anatase |
| ICP-OES | Ru loading (wt%) | 0.86 ± 0.03 | 0.61 ± 0.07 |
| Physisorption | BET specific surface area (m2 g−1) | 122 ± 12 | 2 ± 0.2 |
| Pore volume (mL g−1) | 0.45 ± 0.05 | 0.01 ± 0.001 | |
| Mean pore sizea (nm) | 11 ± 1 | n.d | |
| FTIR | IR bands | 1625 cm−1 (H2O-ads), 3300 cm−1 (ν(O–H)), 400–500 cm−1 (ν(Ti–O–Ti)) | Weak 3300 cm−1 (ν(O–H)), 400–500 cm−1 (ν(Ti–O–Ti)) |
| TEM | Ru nanoparticles | Small nanoparticles, homogeneously dispersed, 2.4 nm mean diameter | Heterogeneous dispersion, from 1 nm to 100 nm, presence of aggregates, 12.5 mean diameter |
| H2 chemisorption | Ru accessibility (number of available Ru atoms, RuA) | 8.61 μmol g−1 | 8.99 μmol g−1 |
XRD analysis shows that in Ru/TiO2-A, the support is a pure anatase phase with 11 nm mean crystallite size whereas in Ru/TiO2-R, the support is made of bigger mean crystallite size (228 nm) and contains some anatase impurities (6%) (ESI – Fig. S5†). The diffraction peak intensities are much higher for TiO2-R than for TiO2-A, revealing higher degree of crystallinity, in accordance with the crystal sizes measured. Ruthenium is not visible on both diffractograms, probably because of its low loading on each support.
N2 physisorption isotherm of Ru/TiO2-A (ESI – Fig. S6†) corresponds to a type IV isotherm with H3 hysteresis loop typical of mesoporous materials with disordered pore network.35 For Ru/TiO2-R, the isotherm shape corresponds to minor condensation of N2 in mesopores and major condensation in inter-particles void (mix of Type IV and Type II isotherms), thus indicating a mostly non porous material. The specific BET surface area of TiO2-A is high (more than 100 m2 g−1) compared to TiO2-R (less than 2 m2 g−1). The mean pore diameter of TiO2-A is 11 nm (Table 1), largely superior to the hydrodynamic radius of sugars, estimated to be lower than 4 Å for xylose.36,37
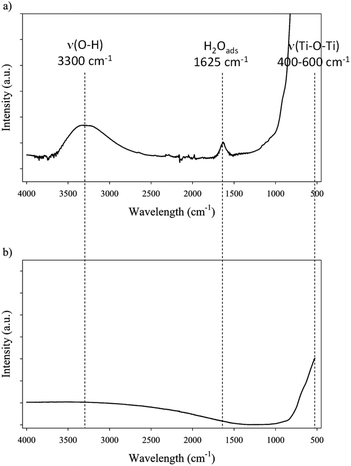
Hence, both supports exhibit very different bulk properties. FTIR was used to characterize surface groups of both catalysts (Fig. 1). Three main bands can be observed on FTIR spectra of catalysts: broad stretching band corresponding to surface O–H bonds around 3300 cm−1, a small band at 1625 cm−1 corresponding to adsorbed water, and an intense band between 400 and 500 cm−1 corresponding to Ti–O–Ti stretching bond.38,39 Spectra corresponding to TiO2 and corresponding to Ru/TiO2 are identical. However, the comparison of TiO2-A and TiO2-R spectra shows some differences: the band corresponding to adsorbed water at 1625 cm−1 is only visible on TiO2-A, indicating that this support is more favourable to water adsorption, i.e. is more polar; the band corresponding to O–H group is also more intense on TiO2-A. The band corresponding to Ti–O–Ti is present on both spectra. The presence of –OH groups on anatase and rutile was described in the early 1970's by Primet et al.40 It was demonstrated that these groups could have a weak basic or a medium acidic behaviour. Moreover, electronic vacancies on the surface of TiO2, and particularly on TiO2 anatase, creates strong Lewis acid sites, which can also form Brønsted acid sites in the presence of adsorbed water.38,41
Potentiometric titration of TiO2-A and TiO2-R supports was performed to evaluate their acidity (Table 2). This method has the advantage to measure acid sites in the presence of liquid water, therefore in environmental conditions close to the reaction. TiO2-A exhibited 3 different types of acid sites with different strengths. The most numerous ones are the weaker ones, with a concentration of 249 μmol g−1 and pKa 9.3. Stronger acid sites with a concentration of 152 μmol g−1 and pKa 8.6 and then concentration of 152 μmol g−1 and pKa 6.2 were also detected. On the contrary, TiO2-R only bears acid sites with pKa 8.6 in a concentration of 27 μmol g−1.
These results are in agreement with the analysis of acid sites in gas phase described in literature:41 anatase bears medium Brønsted acid sites and strong Lewis acid sites and rutile is much less acidic than anatase. In total, Ru/TiO2-A holds 466 μmol g−1 and TiO2-R 27 μmol g−1 acid sites. Both supports have very different specific surface area, as stated before. The density of acid sites on this surface is 3.8 μmol m−2 for TiO2-A and 13 μmol m−2 for TiO2-R, evidencing that the acidity of TiO2-A support is mainly a consequence of its large specific surface area.
| Support | TiO2-A | TiO2-R |
|---|---|---|
| Weak acid sites | ||
| Concentration (μmoleq. H+ g−1) | 249.67 | — |
| pKa | 9.3 | — |
![[thin space (1/6-em)]](https://www.rsc.org/images/entities/char_2009.gif) |
||
| Medium acid sites | ||
| Concentration (μmoleq. H+ g−1) | 152.59 | 27.18 |
| pKa | 8.6 | 8.6 |
![[thin space (1/6-em)]](https://www.rsc.org/images/entities/char_2009.gif) |
||
| Strong acid sites | ||
| Concentration (μmoleq. H+ g−1) | 63.35 | — |
| pKa | 6.2 | — |
![[thin space (1/6-em)]](https://www.rsc.org/images/entities/char_2009.gif) |
||
| Total acid sites | ||
| Concentration (μmoleq. H+ g−1) | 465.61 | 27.18 |
Given these differences in supports properties, one could expect different dispersions of ruthenium and different metal–support electronic interactions on each TiO2 support.42–44 Concerning metal dispersion, STEM analysis revealed major differences between both catalysts (Fig. 2, Table 1). Ru/TiO2-A exhibits small nanoparticles, visible as white nanospheres on the gray support, with a homogeneous dispersion in size and on the support. On the contrary, Ru/TiO2-R exhibits a larger range of particle sizes, from small nanoparticles to large aggregates. The dispersion on TiO2-R support is very heterogeneous with large zones of support where ruthenium is absent and small zones with a high density of ruthenium, as shown by EDX mapping on Fig. S7 (ESI†). Histogram of nanoparticles is centred on 2–2.5 nm for Ru/TiO2-A, with 2.4 nm mean diameter, and on 7–9 nm for Ru/TiO2-R, with 12.5 nm mean diameter.
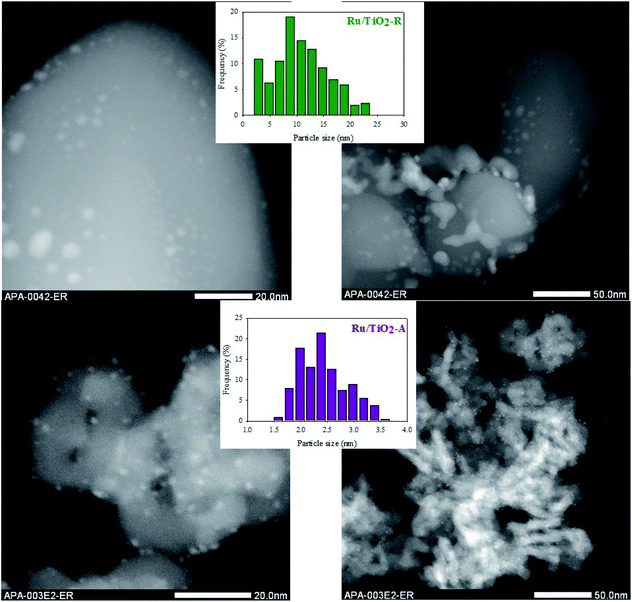 | ||
| Fig. 2 TEM pictures of Ru/TiO2-R (up) and Ru/TiO2-A (down), with the corresponding histograms of Ru nanoparticles size. | ||
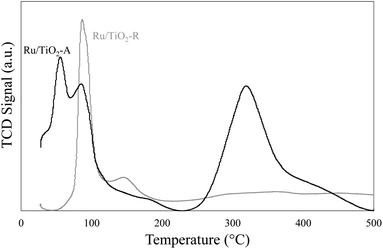
TPR analysis was performed on pre-oxidised samples of both Ru/TiO2 catalysts (Fig. 3). Different reduction profiles were observed. For Ru/TiO2-R, a first peak was observed at 89 °C, corresponding to RuO2 that have no interaction with the support30 and a second smaller and broader peak around 150 °C corresponds to RuOx in strong interaction with TiO2.30 Therefore, for Ru/TiO2-R catalyst, RuO2 would correspond to large Ru particles and represent 68% of reductible species and RuOx corresponding to small particles in strong interaction with support corresponds to 32% of reductible species. For Ru/TiO2-A, two reduction peaks are visible at low temperature (57 °C and 88 °C) and a large, broader peak centred around 320 °C. The latter represents 56% of reducible species on the sample. Peaks at low temperature should be similar to RuO2 species observed on Ru/TiO2-R whereas the peak at high temperature is an indication of RuOx nanoparticles as the dominant Ru species. The difference in temperature reduction for RuOx species between both catalysts (+170 °C for Ru/TiO2-A) shows that metal–support interactions are much stronger on Ru/TiO2-A than on Ru/TiO2-R.
In summary, TiO2-A and TiO2-R supports differs by their physical–chemical properties. TiO2-A is a mesoporous material with relatively high specific surface area, the main crystalline phase is anatase, with a low crystallinity. This support contains acidic sites, which could correspond to Lewis acid sites Ti4+ on TiO2 surface. On the other hand, TiO2-R is a poorly porous material with low specific surface area; the main crystalline phase is rutile, with a high crystallinity and quite neutral surface properties. Ruthenium impregnation on both supports gave different catalysts. Ru/TiO2-A holds small, homogeneously dispersed Ru nanoparticles, most of them in strong interaction with TiO2 support, but the amount of surface ruthenium atoms able to activate H2 is low. Ru/TiO2-R bears also small nanoparticles in strong interaction with TiO2 support (although this interaction is weaker than for Ru/TiO2-A) and larger aggregates with weak metal–support interaction and with a heterogeneous dispersion; the amount of surface ruthenium atoms able to activate H2 corresponds to the dispersion of ruthenium observed by microscopy. Finally, the amount of available ruthenium atoms (RuA) is similar for both catalysts: 8.99 μmol g−1 and 8.61 μmol g−1 for Ru/TiO2-R and Ru/TiO2-A, respectively. Normalized with the specific surface area of each support, the surface density of ruthenium atoms is 4.2 × 10¹⁷ Ru m−2 for Ru/TiO2-A and 18 × 1019 Ru m−2 for Ru/TiO2-R, based on ruthenium content, which explains that ruthenium was much more easily dispersed in small nanoparticles on TiO2-A than on TiO2-R, resulting in smaller nanoparticles in the former case. On the contrary, the density of active ruthenium atoms (RuA, as measured by chemisorption) is 7.3 × 10⁸ Ru m−2 for RuA/TiO2-A and 4.3 × 10⁶ Ru m−2 for RuA/TiO2-R. It can be concluded that on the large surface area of TiO2-A, the availability of ruthenium is limited, because of strong metal–support interactions.
Xylose hydrogenation over Ru/TiO2 catalysts
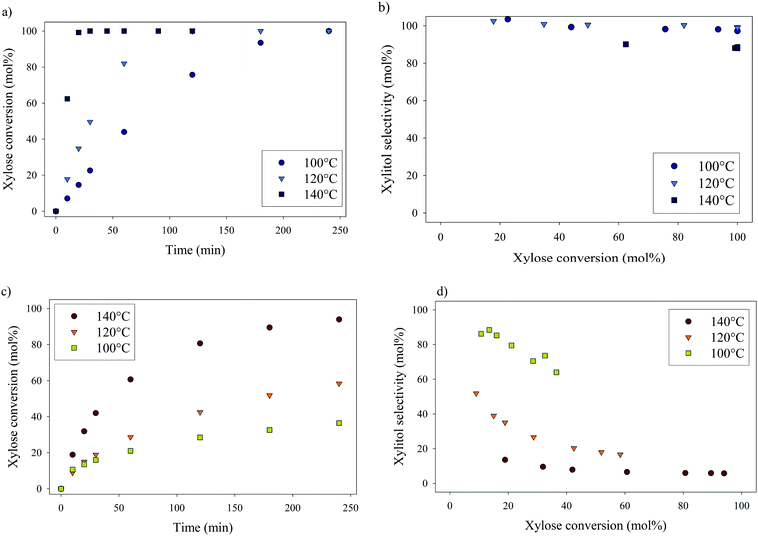
Xylose hydrogenation over Ru/TiO2-R at 120 °C produced xylitol with 100% selectivity (Fig. 4a). The conversion was complete after 2 h. No xylitol degradation was observed after the end of the reaction.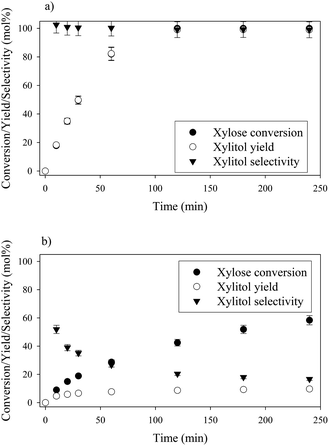 | ||
| Fig. 4 Xylose hydrogenation over Ru/TiO2-R (a) and Ru/TiO2-A (b). Reaction conditions: 120°C, 40 bar H2, 0.33 M xylose, molar ratio Ru/xylose 0.45%. | ||
On the contrary, xylose hydrogenation over Ru/TiO2-A led to 61% conversion after 4 h, indicating a reaction rate much lower than for Ru/TiO2-R (Fig. 4b). Xylitol was produced with low selectivity around 52% at 10% conversion and decreasing to 17% at 60% of conversion. This continuous decay in selectivity with increasing conversion seems to indicate that the catalyst favours side-reactions producing unexpected by-products.
Moreover, in a comparable blank experiment, the supports were tested without ruthenium. TiO2-R exhibited a negligible activity in xylose conversion whereas TiO2-A led to an important conversion of xylose (Fig. 5) and to the formation of various by-products, some of them corresponding to the products obtained with Ru/TiO2-A. This point will be discussed in detail below.
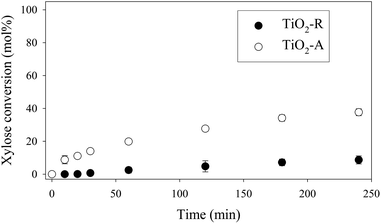 | ||
| Fig. 5 Xylose hydrogenation over TiO2-R and TiO2-A. Reaction conditions: 120°C, 40 bar H2, 0.33 M xylose. | ||
By comparison, blank experiments without any solid catalyst nor support gave only a negligible level of conversion at 120 °C after 4 h (less than 10%).
Effect of temperature on xylose hydrogenation
The effect of temperature on catalytic performances was investigated for both catalysts between 100 °C and 140 °C (Fig. 6). For Ru/TiO2-R, an increase in temperature led to an increase in xylose conversion rate and xylitol selectivity remained unchanged and superior to 90 mol%, whatever the temperature. For Ru/TiO2-A, an increase in temperature led to an increase in xylose conversion but also to a sharp decrease in xylitol selectivity. This indicates the predominance of side-reactions at high temperatures with Ru/TiO2-A catalyst.Formation of by-products during xylose hydrogenation over Ru/TiO2-A
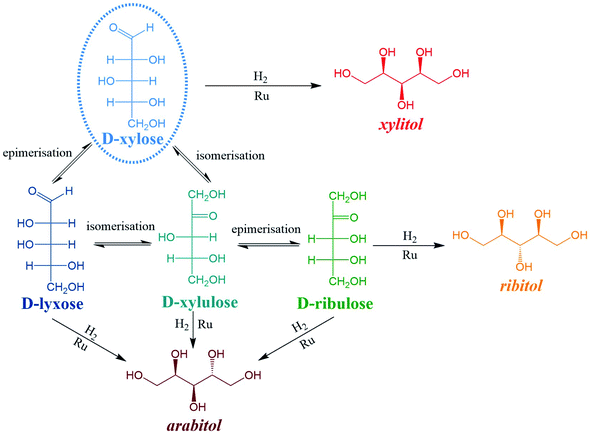
Numerous by-products were observed on HPLC chromatograms when Ru/TiO2-A was used as a catalyst (see ESI, Fig. S2†). Xylulose, lyxose, ribulose, arabitol and ribitol were identified during xylose hydrogenation on Ru/TiO2-A and TiO2-A alone. Ribose and arabinose were not detected. The evolution of xylose conversion products with Ru/TiO2-A catalyst is represented on Fig. 7a. Xylulose and lyxose are isomer and epimer of xylose, respectively. Ribulose can be formed by epimerisation of the C3 carbon on xylulose.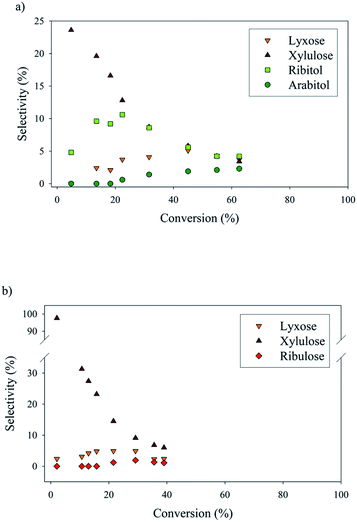 | ||
| Fig. 7 By-products molar selectivities during xylose hydrogenation over Ru/TiO2-A (a) and TiO2-A alone (b). Reaction conditions: 120°C, 40 bar H2, 0.33 M xylose, molar ratio Ru/xylose 0.45%. | ||
When TiO2-A alone was used as a catalyst, xylulose was formed selectively at the very beginning of the reaction, and then converted into other products (Fig. 7b). Lyxose was formed as a secondary product, most probably by isomerisation from xylulose, even if a small contribution of direct epimerisation from xylose cannot be discarded. Ribulose was observed in minor amount after 1 h of reaction, most probably from xylulose. All pentoses also seem to degrade into other products over the course of reaction. When Ru/TiO2-A was used as catalyst, xylulose is also present with a high selectivity at the beginning of the reaction, and lyxose as a secondary product when conversion increases. However, the presence of ruthenium leads to the hydrogenation of pentoses to form arabitol, from lyxose and xylulose, and ribitol, most probably from xylulose via a ribulose intermediate (Fig. 8). Ribulose itself was not observed in this case. At high conversion, all selectivities decrease, indicating the formation of degradation products.
The interconversion of aldoses can occur through different mechanisms. In the presence of a base or a Lewis acid catalyst, isomerization of aldoses into ketoses and reversely can occur through a Lobry de Bruyn–Alberda van Ekenstein mechanism (LdB-AvE) through an enediol intermediate and an intramolecular hydrogen shift.45–48 This reaction is well known for producing fructose from glucose over Sn-BEA zeolite catalysts.49 The isomerisation of xylose into xylulose and to a lesser extent, lyxose (formed by the reverse isomerization of xylulose) as well of arabinose into ribose was also reported on Sn-BEA zeolites or Nb2O5 catalysts.49–51 The direct epimerisation of xylose into lyxose (or arabinose into ribose) can also occur through a Bilik reaction with a carbon shift and a rotation of C2–C3 bond.47 It was described in the presence of a Lewis acid catalyst and a complexation agent (e.g. borate, calcium),52–54 or using molybdenum-based catalysts.55 Ti-doped zeolite was also active for isomerisation and epimerisation of glucose, the activity was attributed to Ti4+ Lewis acid sites.52,56 The temperature used for isomerisation of sugars ranges between 60 to 120 °C, which is compatible with the experimental conditions applied in our catalytic experiments.
The acidity of TiO2-A and TiO2-R was investigated above. The presence of acid sites on TiO2-A was observed and attributed to –OH groups and Ti4+ species on TiO2 surface. These sites are assumed responsible for isomerisation and/or epimerisation activities. As these reactions are catalysed only by Lewis acid sites, it is assumed that a large part of the acid sites detected on TiO2-A are Lewis acid sites. On the contrary, TiO2-R does not bear enough acid sites and to be active for xylose conversion into other pentoses.
Moreover, all pentoses can undergo hydrogenation to three corresponding polyols: arabitol, ribitol, xylitol, as described on Fig. 8. Therefore, apparent Ru activity is not limited to xylitol production but also include ribitol and arabitol production; indeed, the overall reaction system is a complex network of parallel and consecutive reactions. Although this was not the point of this research, this result is also, to the best of our knowledge, the first report of ribitol production from ribulose over a Ru/TiO2 catalyst.
Finally, it is worth noting that the carbon balance is decreasing during xylose reaction over Ru/TiO2-A (reaching 68% after 240 min at 120 °C) or TiO2-A (reaching 57% after 240 min at 120 °C), indicating the formation of unidentified products through successive reactions (see ESI, Fig. S4†). This phenomenon was already described in literature (cf. ref. 47 and 50) and the degradation products were identified as glycoaldehyde, glyceraldehyde, dihydroxyacetone, and at higher temperatures lactic acid, HMF, furfural. Traces of lactic acid, acetic acid and furfural were detected in the products of xylose hydrogenation over Ru/TiO2-A in our study but in amounts too low to be quantified. The formation of humins, i.e. unidentified carbonaceous compounds, is assumed and corroborated by the change in colour of the solution from colourless to light-brown.
First approach of kinetics of sugars hydrogenation
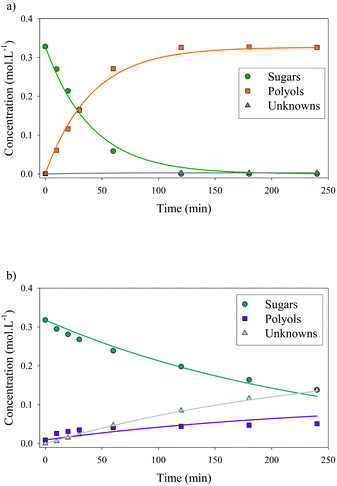
The detailed analysis of reaction products led to a detailed reaction mechanism (Fig. 8). In this mechanism, several sugars are hydrogenated in several polyols. A basic kinetic model was built to determine simply but quantitatively the hydrogenation activity of both ruthenium catalysts (Fig. 9). The model is based on a simplified mechanism were the four identified pentoses are reasonably lumped together (“sugars”) as well as the three polyols products (“polyols”). Therefore, two reactions were included in the model: the hydrogenation of sugars into polyols, with a kinetic constant kH, and the degradation of sugars into unknown products, kD. The following hypotheses were made: (i) reaction orders were assumed to be 1 for sugars and 0 for H2 (i.e. H2 concentration was assumed constant because the system is constantly fed with gaseous H2 to maintain constant H2 pressure), (ii) volumes of liquid and solid were assumed constant, (iii) kinetic constants are apparent pseudo-first order rate constants including a factor corresponding to the catalyst concentration. Details on kinetic modelling are given in ESI.†Fig. 10 depicts the experimental results and the modelling results obtained at 120 °C for both catalysts. A good agreement between experimental and modelling results was observed at all studied temperatures, as shown on parity plot (Fig. S3 in ESI†).
At 120 °C, kinetic constant for hydrogenation rate kH was 20 times higher for Ru/TiO2-R than for Ru/TiO2-A, resulting in a 20-fold increase in initial reaction rate. This illustrates the superior catalytic activity of Ru/TiO2-R. Kinetic constant for degradation rate kD was negligible for Ru/TiO2-R, which corresponds to the high selectivity for xylitol observed earlier. On the other hand, degradation rate for Ru/TiO2-A was almost twice higher than hydrogenation rate, which explains the low selectivity for xylitol.
As Ru/TiO2-R exhibited a higher accessibility of Ru atoms, its superior activity in xylose hydrogenation was expected. Turnover frequency (TOF) values were calculated to normalize ruthenium catalytic activity by the number of surface ruthenium atoms able to activate H2 (cf. ESI†). TOF reaches 0.990 s−1 for Ru/TiO2-R and only 0.052 s−1 for Ru/TiO2-A at 120 °C, which indicates a lower activity of ruthenium catalytic sites on Ru/TiO2-A (Table 3). Therefore, Ru/TiO2-A's low activity cannot be completely explained by the low amount of accessible ruthenium atoms but also by a lower intrinsic activity of catalytic sites for hydrogenation. As a comparison, Lee et al. measured a initial TOF of 0.688 s−1 at 100 °C for xylose hydrogenation over 3%Ru/Al2O3 (ref. 21) whereas our Ru/TiO2-R catalyst reached 0.469 s−1 at the same temperature and similar operating conditions.
| Ru/TiO2-R | Ru/TiO2-A | |
|---|---|---|
| a Detailed calculation of k, TOF and Ea are presented in ESI. | ||
| Kinetic constant/hydrogenation kH,120 °C (103 min−1) | 24.4 | 1.3 |
| Initial TOF/hydrogenation TOF0,120 °C (s−1) | 0.990 | 0.052 |
| Kinetic constant/degradation kD,120 °C (103 min−1) | 0.22 | 2.8 |
| Initial TOF/degradation TOFDEG0,120 °C (s−1) | 0.003 | 0.002 |
| Activation energy/hydrogenation (kJ mol−1) | 83.7 | 18.5 |
| Activation energy/degradation (kJ mol−1) | 147.9 | 106.2 |
With the same methodology, TOFdeg for degradation reaction were calculated from acid sites concentration (see Table 3) and the initial rate of degradation reaction at 120 °C. The values obtained were 0.003 s−1 for Ru/TiO2-R and 0.002 s−1 for Ru/TiO2-A. Therefore, the degradation activity per acid sites is similar for both catalysts. The high selectivity for degradation products in the presence of TiO2-A is thus a consequence of its large specific surface area.
Activation energies were calculated following the Arrhenius law (see ESI†). For Ru/TiO2-R, activation energy determined from hydrogenation rate was 83.7 kJ mol−1. In literature, activation energies for xylose hydrogenation vary from 32 kJ mol−1 (over Raney nickel)11 to 53 kJ mol−1 (ref. 57) or 82 kJ mol−1 (ref. 58) (over ruthenium). Our results are in accordance with the values reported. For Ru/TiO2-A, activation energy determined from hydrogenation rate was 18.5 kJ mol−1, indicating a mechanism different for polyols production, in accordance with the reaction network shown on Fig. 8, and activation energy determined from degradation rate was 106.2 kJ mol−1. These values of Ea are consistent with the low xylitol selectivity at 140 °C observed for Ru/TiO2-A (Fig. 6): at high temperature, degradation is favoured over hydrogenation, whereas at low temperature, xylitol production is favoured over sugars degradation.
In summary, the support TiO2-A is responsible for two phenomena in xylose reactivity:
(i) A decrease in xylose conversion, i.e. a decrease in catalytic activity, which is linked with a decrease in ruthenium sites active for hydrogenation;
(ii) A decrease in xylitol selectivity, which corresponds to the formation of by-products through undesired reactions and therefore to the presence of different catalytic sites on the support.
Therefore, contrary to the study of Hernandez-Mejia et al. on Ru/TiO2 support effects during xylose hydrogenation,27 we attribute the higher activity and selectivity of Ru/TiO2-R not to the presence of smaller Ru nanoparticles but rather to the higher ability of ruthenium active sites to activate H2 on Ru/TiO2-R.
Conclusions
The role of TiO2 support in the hydrogenation of xylose over Ru/TiO2 catalysts was investigated by preparing Ru catalysts with two different TiO2 materials: an anatase TiO2 support with a large specific surface area, large pore volume and medium surface acidity, and a rutile TiO2 support without porosity and negligible surface acidity.The synthesis of Ru/TiO2 catalysts from these two supports gave two different catalytic materials: Ru/TiO2-R bears large ruthenium nanoparticles in weak interaction with TiO2 support, whereas Ru/TiO2-A bears small ruthenium particles in strong interaction with TiO2 support.
Whereas one would expect that small, well-dispersed nanoparticles would result in higher catalytic activity for hydrogenation reaction, the opposite happened. Ru/TiO2-A was less efficient to activate H2, as evidenced by chemisorption measurements. It was also less active for xylose hydrogenation, with initial hydrogenation TOF 20 times slower than for Ru/TiO2-R. This lack of activity was attributed to strong metal support interactions between small ruthenium nanoparticles and TiO2 anatase support.
Moreover, the selectivity of the reaction is also impacted by the type of support. Ru/TiO2-R led to a xylitol selectivity close to 100% at all studied temperatures. In presence of Ru/TiO2-A xylitol selectivity decreased with conversion. The low selectivity in presence of TiO2 anatase was explained by the formation of multiple by-products on TiO2 catalytic sites, including several pentoses isomers of xylose: xylulose, lyxose, ribulose, and the corresponding polyols: arabitol, ribitol. The presence of Lewis acid sites on TiO2 surface is assumed responsible for this particular reactivity.
In conclusion, TiO2 support plays an important role in the reactivity of Ru/TiO2 catalysts. It has been demonstrated that TiO2 rutile, even with a small specific surface area, is the best option for xylitol production. Alternatively, Even if TiO2 anatase present textural properties can compatible with better active phase dispersion, it also produces various pentoses and polyols from a single sugar, xylose due to its acidic character. This work underlines the importance of choice of support in metal–supported catalysis and of its appropriate and fine characterization.
Although the formation of xylose isomers and polyols is due to serendipity, it can represent a new approach in the synthesis of rare sugars and rare polyols from available resources. We present here a new reactivity of TiO2, which is a simple, robust and commercial material, as an alternative for the production of xylulose and lyxose from xylose. Moreover, the production of ribitol and arabitol from these pentoses was also evidenced in the presence of ruthenium.
Author contributions
L. Vilcocq: conceptualisation; funding acquisition; investigation; project administration; supervision; visualisation; writing – original draft. A. M. Paez: investigation; visualisation. V. D. S. Freitas: investigation; writing – review & editing. L. Veyre: investigation; visualisation. R. Philippe: supervision; writing – review & editing. P. Fongarland: supervision; writing – review & editing.Conflicts of interest
There are no conflicts to declare.Acknowledgements
Ruben Vera (CDHL) is acknowledged for his assistance on XRD analysis. Antoinette Boréave (IRCELYON) is thanked for her help on TPR analysis. Stéphanie Pallier (LGPC/CP2M) is acknowledged for her assistance on solid characterizations. Laurent Djakovitch, Noémie Perret and Antonio Hernandez Mañas (IRCELYON) are thanked for their help in FTIR analysis and HPLC analysis. Alain Favre-Réguillon is acknowledged for scientific discussion. This work was supported by National Research Agency (ANR) with the funding of project CHICHE (ANR-18-CE43-0004). The authors thank Axelera cluster for the chemical and environmental sectors.Notes and references
- Y. Panchaksharam, P. Kiri, A. Bauen, C. vom Berg, Á. Puente, R. Chinthapalli, J. Spekreijse, J. Vos, S. Pfau, K. Rübberdt, J. Michels and L. König, Roadmap for the Chemical Industry in Europe towards a Bioeconomy, 2019 Search PubMed.
- S. V. Vassilev, D. Baxter, L. K. Andersen, C. G. Vassileva and T. J. Morgan, Fuel, 2012, 94, 1–33 CrossRef CAS.
- I. Delidovich, K. Leonhard and R. Palkovits, Energy Environ. Sci., 2014, 7, 2803 RSC.
- C. K. Yamakawa, F. Qin and S. I. Mussatto, Biomass Bioenergy, 2018, 119, 54–60 CrossRef CAS.
- A. Ebringerová, Z. Hromádková and T. Heinze, in Polysaccharides I, ed. T. Heinze, Springer-Verlag, Berlin/Heidelberg, 2005, vol. 186, pp. 1–67 Search PubMed.
- H. V. Scheller and P. Ulvskov, Annu. Rev. Plant Biol., 2010, 61, 263–289 CrossRef CAS.
- T. Werpy and G. Petersen, Top Value Added Chemicals from Biomass, NREL report DOE/GO-102004-1992, 2004 Search PubMed.
- J. J. Bozell and G. R. Petersen, Green Chem., 2010, 12, 539 RSC.
- Research and Markets, Xylitol Market: Global Industry Trends, Share, Size, Growth, Opportunity and Forecast 2018-2023, 2018 Search PubMed.
- E. Moreni, Patent FR, 2631831A1, 1989 Search PubMed.
- J. Wisniak, M. Hershkowitz, R. Leibowitz and S. Stein, Ind. Eng. Chem. Prod. Res. Dev., 1974, 13, 75–79 CrossRef CAS.
- I. S. M. Rafiqul and A. M. M. Sakinah, Food Rev. Int., 2013, 29, 127–156 CrossRef CAS.
- Y. Delgado Arcaño, O. D. Valmaña García, D. Mandelli, W. A. Carvalho and L. A. Magalhães Pontes, Catal. Today, 2020, 344, 2–14 CrossRef.
- M. Yadav, D. K. Mishra and J. Hwang, Appl. Catal., A, 2012, 425–426, 110–116 CrossRef CAS.
- R. Morales, C. H. Campos, J. L. G. Fierro, M. A. Fraga and G. Pecchi, Catal. Today, 2018, 310, 59–67 CrossRef CAS.
- F. Brandi, M. Bäumel, V. Molinari, I. Shekova, I. Lauermann, T. Heil, M. Antonietti and M. Al-Naji, Green Chem., 2020, 22, 2755–2766 RSC.
- H. Xia, L. Zhang, H. Hu, S. Zuo and L. Yang, Nanomaterials, 2019, 10, 73 CrossRef.
- A. P. Tathod and P. L. Dhepe, Green Chem., 2014, 16, 4944–4954 RSC.
- R. Morales, C. H. Campos, J. L. G. Fierro, M. A. Fraga and G. Pecchi, Mol. Catal., 2017, 436, 182–189 CrossRef CAS.
- C. Michel, J. Zaffran, A. M. Ruppert, J. Matras-Michalska, M. Jędrzejczyk, J. Grams and P. Sautet, Chem. Commun., 2014, 50, 12450–12453 RSC.
- J. Lee, Y. Xu and G. W. Huber, Appl. Catal., B, 2013, 140–141, 98–107 CAS.
- T. Omotoso, S. Boonyasuwat and S. P. Crossley, Green Chem., 2014, 16, 645–652 RSC.
- J.-P. Lange, Angew. Chem., Int. Ed., 2015, 54, 13186–13197 CrossRef CAS PubMed.
- J. Zhang, L. Pei, J. Wang, P. Zhu, X. Gu and Z. Zheng, Catal. Sci. Technol., 2020, 10, 1518–1528 RSC.
- A. Romero, E. Alonso, Á. Sastre and A. Nieto-Márquez, Microporous Mesoporous Mater., 2016, 224, 1–8 CrossRef CAS.
- D. K. Mishra, J. M. Lee, J. S. Chang and J. S. Hwang, Catal. Today, 2012, 185, 104–108 CrossRef CAS.
- C. Hernandez-Mejia, E. S. Gnanakumar, A. Olivos-Suarez, J. Gascon, H. F. Greer, W. Zhou, G. Rothenberg and N. Raveendran Shiju, Catal. Sci. Technol., 2016, 6, 577–582 RSC.
- F. Liu, J. Ftouni, P. C. A. Bruijnincx and B. M. Weckhuysen, ChemCatChem, 2019, 11, 2079–2088 CrossRef CAS.
- A. Kim, D. P. Debecker, F. Devred, V. Dubois, C. Sanchez and C. Sassoye, Appl. Catal., B, 2018, 220, 615–625 CrossRef CAS.
- A. M. Ruppert, J. Grams, M. Jędrzejczyk, J. Matras-Michalska, N. Keller, K. Ostojska and P. Sautet, ChemSusChem, 2015, 8, 1538–1547 CrossRef CAS.
- K. Yu, N. Kumar, A. Aho, J. Roine, I. Heinmaa, D. Y. Murzin and A. Ivaska, J. Catal., 2016, 335, 117–124 CrossRef CAS.
- G. Gran, H. Dahlenborg, S. Laurell and M. Rottenberg, Acta Chem. Scand., 1950, 4, 559–577 CrossRef CAS.
- G. Gran, Int. Congr. Anal. Chem., 1952, 77, 661–671 CAS.
- R. Berthoud, P. Délichère, D. Gajan, W. Lukens, K. Pelzer, J.-M. Basset, J.-P. Candy and C. Copéret, J. Catal., 2008, 260, 387–391 CrossRef CAS.
- M. Thommes, K. Kaneko, A. V. Neimark, J. P. Olivier, F. Rodriguez-Reinoso, J. Rouquerol and K. S. W. Sing, Pure Appl. Chem., 2015, 87, 1051–1069 CAS.
- G. Lodi, L. A. Pellegrini, A. Aliverti, B. Rivas Torres, M. Bernardi, M. Morbidelli and G. Storti, J. Chromatogr. A, 2017, 1496, 25–36 CrossRef CAS PubMed.
- T. C. Laurent and J. Killander, J. Chromatogr. A, 1964, 14, 317–330 CrossRef CAS.
- A. Mahdavi-Shakib, S. Husremovic, S. Ki, J. Glynn, L. Babb, J. Sempel, I. Stavrinoudis, J.-M. Arce-Ramos, R. Nelson, L. C. Grabow, T. J. Schwartz, B. G. Frederick and R. N. Austin, Polyhedron, 2019, 170, 41–50 CrossRef CAS.
- S. Musić, M. Gotić, M. Ivanda, S. Popović, A. Turković, R. Trojko, A. Sekulić and K. Furić, Mater. Sci. Eng., B, 1997, 47, 33–40 CrossRef.
- M. Primet, P. Pichat and M. V. Mathieu, J. Phys. Chem., 1971, 75, 1216–1220 CrossRef CAS.
- M. V. Mathieu, M. Primet and P. Pichat, J. Phys. Chem., 1971, 75, 1221–1226 CrossRef CAS.
- S. J. Tauster, S. C. Fung, R. T. K. Baker and J. A. Horsley, Science, 1981, 211, 1121–1125 CrossRef CAS.
- S. J. Tauster, S. C. Fung and R. L. Garten, J. Am. Chem. Soc., 1978, 100, 170–175 CrossRef CAS.
- Y. Zhang, X. Su, L. Li, H. Qi, C. Yang, W. Liu, X. Pan, X. Liu, X. Yang, Y. Huang and T. Zhang, ACS Catal., 2020, 10, 12967–12975 CrossRef CAS.
- I. Delidovich, M. S. Gyngazova, N. Sánchez-Bastardo, J. P. Wohland, C. Hoppe and P. Drabo, Green Chem., 2018, 20, 724–734 RSC.
- D. Y. Murzin, E. V. Murzina, A. Aho, M. A. Kazakova, A. G. Selyutin, D. Kubicka, V. L. Kuznetsov and I. L. Simakova, Catal. Sci. Technol., 2017, 7, 5321–5331 RSC.
- I. Delidovich and R. Palkovits, ChemSusChem, 2016, 9, 547–561 CrossRef CAS PubMed.
- J. M. Carraher, C. N. Fleitman and J.-P. Tessonnier, ACS Catal., 2015, 5, 3162–3173 CrossRef CAS.
- J. Dijkmans, D. Gabriëls, M. Dusselier, F. de Clippel, P. Vanelderen, K. Houthoofd, A. Malfliet, Y. Pontikes and B. F. Sels, Green Chem., 2013, 15, 2777 RSC.
- M. S. Holm, Y. J. Pagán-Torres, S. Saravanamurugan, A. Riisager, J. A. Dumesic and E. Taarning, Green Chem., 2012, 14, 702 RSC.
- J. L. Vieira, M. Almeida-Trapp, A. Mithöfer, W. Plass and J. M. R. Gallo, Catal. Today, 2020, 344, 92–101 CrossRef CAS.
- W. R. Gunther, Y. Wang, Y. Ji, V. K. Michaelis, S. T. Hunt, R. G. Griffin and Y. Román-Leshkov, Nat. Commun., 2012, 3, 1109 CrossRef.
- S. J. Angyal, Carbohydr. Res., 1997, 300, 279–281 CrossRef CAS.
- R. Yanagihara, K. Soeda, S. Shiina, S. Osanai and S. Yoshikawa, Bull. Chem. Soc. Jpn., 1993, 66, 2268–2272 CrossRef.
- G. M. Lari, O. G. Gröninger, Q. Li, C. Mondelli, N. López and J. Pérez-Ramírez, ChemSusChem, 2016, 9, 3407–3418 CrossRef CAS PubMed.
- M. Moliner, Y. Roman-Leshkov and M. E. Davis, Proc. Natl. Acad. Sci. U. S. A., 2010, 107, 6164–6168 CrossRef CAS PubMed.
- T. N. Pham, A. Samikannu, A.-R. Rautio, K. L. Juhasz, Z. Konya, J. Wärnå, K. Kordas and J.-P. Mikkola, Top. Catal., 2016, 59, 1165–1177 CrossRef CAS.
- H. Baudel, C. de Abreu and C. Zaror, J. Chem. Technol. Biotechnol., 2005, 80, 230–233 CrossRef CAS.
Footnote |
| † Electronic supplementary information (ESI) available: Publi_TiO2_RSC_2021_ESI.pdf. See DOI: 10.1039/d1ra08193d |
| This journal is © The Royal Society of Chemistry 2021 |

