 Open Access Article
Creative Commons Attribution 3.0 Unported Licence
Correction: Investigation of plasma metabolomics and neurotransmitter dysfunction in the process of Alzheimer’s disease rat induced by amyloid beta 25-35
Mengying Weiab,
Yuanyuan Liua,
Zifeng Pib,
Kexin Yuea,
Shizhe Lic,
Mingxin Hua,
Zhiqiang Liub,
Fengrui Songb and
Zhongying Liu*a
aSchool of Pharmaceutical Sciences, Jilin University, 1266 Fujin Road, Changchun, 130021, China. E-mail: liuzy@jlu.edu.cn; Tel: +86 431 85619704
bNational Center for Mass Spectrometry in Changchun, Jilin Province Key Laboratory of Chinese Medicine Chemistry and Mass Spectrometry, Changchun Institute of Applied Chemistry, Chinese Academy of Sciences, Changchun 130022, China
cGuangdong Univ Technol, Inst Biomed & Pharmaceut Sci, Guangzhou 510006, Guangdong, People’s Republic of China
First published on 15th February 2021
Abstract
Correction for ‘Investigation of plasma metabolomics and neurotransmitter dysfunction in the process of Alzheimer’s disease rat induced by amyloid beta 25-35’ by Mengying Wei et al., RSC Adv., 2019, 9, 18308–18319. DOI: 10.1039/C9RA00302A.
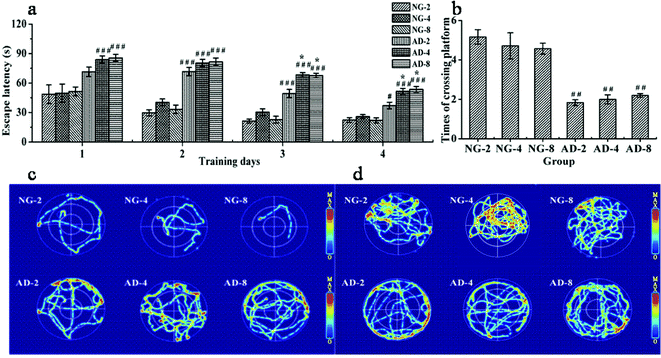
The authors regret that, due to personal negligence, Fig. 1d-NG-4 in this article was repeatedly uploaded as Fig. 1d-NG-2. The authors apologize to readers for this inaccuracy and the corrected figure is shown below. This correction does not affect the results, discussion or conclusion of the article.
The Royal Society of Chemistry apologises for these errors and any consequent inconvenience to authors and readers.
| This journal is © The Royal Society of Chemistry 2021 |

