 Open Access Article
Creative Commons Attribution 3.0 Unported Licence
Correction: Characterization of an exopolysaccharide from probiont Enterobacter faecalis MSI12 and its effect on the disruption of Candida albicans biofilm
G. Seghal Kirana,
S. Priyadharshinia,
K. Anithaa,
Elumalai Gnanamanib and
Joseph Selvin*c
aDepartment of Food Science and Technology, Pondicherry University, Puducherry – 605014, India. E-mail: seghalkiran@gmail.com
bDepartment of Chemistry, Stanford University, Stanford, USA. E-mail: gnanam@stanford.edu
cDepartment of Microbiology, School of Life Sciences, Pondicherry University, Puducherry – 605014, India. E-mail: josephselvinss@gmail.com; jselvin.mib@pondiuni.edu.in; Fax: +91-413-2655358; Tel: +91-413-2655358
First published on 4th June 2021
Abstract
Correction for ‘Characterization of an exopolysaccharide from probiont Enterobacter faecalis MSI12 and its effect on the disruption of Candida albicans biofilm’ by G. Seghal Kiran et al., RSC Adv., 2015, 5, 71573–71585, DOI: 10.1039/C5RA10302A.
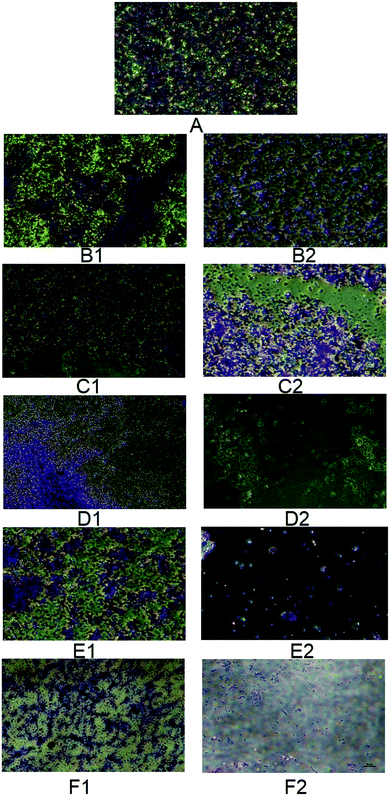
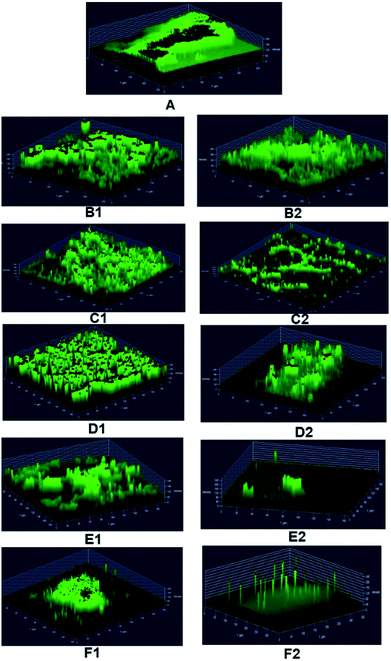
The authors regret that incorrect versions of Fig. 7 and 8 were included in the original article. The correct versions of Fig. 7 and 8 are presented below with updated captions.
Accordingly, the experimental methods followed in the phase contrast microscopy and large-size images of Fig. 7 have been provided in the ESI. The ESI has been updated online to reflect this change.
The Royal Society of Chemistry apologises for these errors and any consequent inconvenience to authors and readers.
| This journal is © The Royal Society of Chemistry 2021 |


