 Open Access Article
Kinetic modelling of Pt/γ-Al2O3–Cl catalysts formulation changes in n-heptane reforming†
Olivier
Said-Aizpuru
*ab,
Florent
Allain
a,
Aurélie
Dandeu
 *a,
Fabrice
Diehl
a,
David
Farrusseng
 b and
Jean-François
Joly
a
aIFP Énergies nouvelles, Rond-point de l'échangeur de Solaize – BP 3, 69360 Solaize, France. E-mail: olivier.saidaizpuru@ugent.be
bIRCELYON, CNRS, 2 Avenue Albert Einstein, 69100 Villeurbanne, France
First published on 19th April 2021
Abstract
Bridging the gap between kinetic model conception and catalyst design is targeted in catalytic naphtha reforming process development. New catalysts are continuously optimised in order to achieve higher selectivity in C5+ products. An adequate description of catalytic transformations by the kinetic models would therefore provide clues for catalyst design and accelerate the time to market implementation of process simulators. This study investigates the influence of site density and location on n-heptane reforming selectivity. It identifies the nature of the limiting steps for the different reforming pathways on a broad range of catalyst formulations. A common lumped model using power law kinetics is developed to describe already published experimental observations on the set of selected catalysts. Linear free energy relationships are used in order to handle a reduced number of statistically relevant adjustable parameters. The dependence between reference rate constants and active phase formulation is then unravelled. Unexpected results indicate that chlorine content and repartition at the crystallite scale affects the hydrogenolysis activity. Within the range of tested formulations, this study suggests that hydroisomerisation reactions are limited by acid sites transformations whereas the aromatisation pathways seem to proceed through a metal/acid bi-functional scheme. The further elaboration of a kinetic model that is able to predict the effect of an industrial catalyst active phase formulation change in full naphtha cut reforming lies beyond the scope of this article.
Introduction
Process simulators are required at different stages of heterogeneous catalytic processes development. Their predictions are essential to identify safe and cost-effective operation conditions. This makes them crucial tools for unit dimensioning and process optimisation. Within process simulators, kinetic models are adequate tools to describe catalyst structure/process performance relationship and their elaboration appears as a key step of both catalyst and process development.1–4Heat and mass transport within catalyst pores, chemical transformation of reagents as well as active sites deactivation are examples of physico-chemical phenomena that are related to catalyst structure and that rule process performance. Given the complexity and the entanglement of these phenomena, the conception of kinetic models is often long and usually requires advanced characterisations of the catalyst. There is therefore an industrial need for robust kinetic modelling methodologies that would: (i) fasten the time to market development of simulators (ii) be able to predict the performances obtained with the use of a fictive solid in order to achieve retro-design of new catalysts.
Naphtha catalytic reforming would highly benefit from such a methodology.5 This process is aimed at producing high-octane gasoline bases, aromatics and hydrogen.6–8 Naphtha reforming chemistry requires metal/acid bi-functional catalysis.9 It consists in converting the linear paraffins and the naphthenes of a C6–C12 hydrocarbon cut into isoparaffins and aromatics. These targeted transformations require bi-functional catalytic reactions. Hydrocracking, hydrogenolysis and coking are parasite reactions. Industrial catalysts are made of platinum nano-particles (possibly associated with other metals such as tin or rhenium) that are supported on chlorinated gamma alumina. Metallic sites catalyse hydro/dehydrogenation reactions whereas chlorinated gamma alumina exhibits mild Brønsted acid sites that can be involved in H+ transfer.
Since the pioneering work of Smith in 1959,10 naphtha reforming kinetic models underwent a significant sophistication including a complexification of their reaction scheme and the introduction of deactivation kinetics. Detailed kinetic models based on power-law rate expressions are widespread approaches used in naphtha reforming. These models are used to obtain a good understanding of naphtha reforming reactions11 and are successfully applied to the conception of industrial reactors.12,13 A current challenge consists in finding a compromise between the simplicity and the accuracy of reforming detailed kinetic model.14
New reforming catalysts active phase formulations are continuously developed in order to reach higher C5+ compounds yields. Active phase optimisation is typically achieved by catalyst screening techniques followed by extrapolation to industrial conditions. This leads to a frequent renewal of the commercial catalysts offer and therefore requires a fast development of associated kinetic models. Reciprocally, current models are hardly able to predict the effect of active phase formulation changes on reforming kinetics and are still not used for the retro-design of new catalysts formulations.
A common industrial practice also consists in adjusting chlorine catalyst concentration (in the 0.7–1%wt range) during operation when a new feedstock is treated or when new product specifications are targeted. This practise still lacks dedicated models.
The objective of this study is to explore the impact of Pt/γ-Al2O3–Cl active sites density and repartition at the crystallite scale on n-heptane reforming intrinsic kinetics. A preliminary experimental study provided suitable data obtained in kinetic regime. Results have already been published and describe the effect of catalyst formulation over a broad range of mild n-heptane reforming conditions.15 The present article presents a kinetic model using power law kinetics and gathering reforming reactions into families through linear free energy relationships (LFER). This model describes the impact of an active phase formulation change on a limited number of apparent rate constants.
This study brings valuable information on the influence of site density and location over reforming selectivity. It also discusses the nature of limiting steps for the different reforming pathways on a broad range of catalyst formulations. This work focuses on intrinsic kinetic studies performed on a model reaction in order to simplify the reaction scheme. Operating conditions were chosen to lower the impact of intra-granular transport as well as deactivation phenomena. Consequently, the model that has been developed cannot be directly used for full naphtha cut reforming catalyst optimisation. Even if some experimental observation remain unexplained, this modelling study deepened the interpretation of experimental results by providing descriptors for the aromatisation and the hydroisomerisation pathways.
Method
Selection of the catalyst library
This works investigates the effect of active sites density and localisation at the alumina crystallite scale on n-heptane reforming intrinsic kinetics. 19 Pt/γ-Al2O3–Cl catalysts with different amounts of Pt, Cl as well as two different alumina crystallite morphologies are gathered.Platinum concentrations vary from 0.3%wt (close to the industrial catalyst content) to 1%wt. Platinum dispersion is high (>85%) and kept for all samples. A partition of the metal between sub-nanometre particles and single atoms was observed on fresh reduced catalyst.16 However, given the conservation of the dispersion level, metallic sites are considered as unique. Therefore, platinum content variation between catalysts is interpreted as a variation in the density of metallic sites.
Chlorine content ranges from 0.1%wt to 1.4%wt among the selected samples. This includes and largely extends the industrial reforming catalyst chlorine concentrations. The nature and the number of mild Brønsted acid sites is affected by chlorine concentration at the surface of the alumina crystallites. In this study, it has been chosen to consider a common mean Brønsted acid site for all the catalysts and to assume that chlorine content can somehow be correlated to the global acid sites concentration.
The 19 tested catalysts are split in two families regarding the nature of the γ-Al2O3 supports. 9 solids are prepared from Sasol® TH100™ boehmite gels. They present parallelepiped shaped crystallites that are referred to as T-flat. The 10 remaining catalysts are synthesised from Sasol® PuralSB3™ boehmite gels and exhibit more roundish alumina crystallites that are called P-egg. Compared to T-flat systems, P-egg crystallites present a higher ratio between edge length and facet surface for a given volume unit. Multi-technique structural investigations revealed that both chlorine and platinum particles are preferentially located on edges.16,17 Therefore, in this study, the repartition of platinum and chlorine at equal concentration is affected by the nature of the support.
Kinetic testing strategy
Catalysts are tested in a high-throughput experimentation set-up comprising 8 parallel millimetric size fixed beds. An identical protocol was developed in order to carry out reaction in kinetic regime and was later performed on each solid. Tests are driven in mild operating conditions and low to middle conversion levels are reached. Different operating conditions are explored. Temperature varies between 390 and 430 °C. Contact time spans from 3.75 to 46 gcata min gHC−1. Two n-heptane over dihydrogen molar ratios are tested (respectively 3 and 5). Overall pressure is equal to 10 barg.Experimental
Catalyst characterisation
The reader is referred to the following articles and their ESI† for a comprehensive description of catalyst characterisation. Preparation and structural investigation of the chlorinated gamma alumina was presented by Batista et al.17 An atomic insight on metallic phase structure was also developed by this team.16Summary of catalytic tests observations
A dedicated article reports the catalytic testing experiments that are modelled in this kinetic study.15 Low to medium conversion ranges (up to 70%) were explored in mild conditions. 97.5 to 100% of the hydrocarbons detected by gas chromatography flame induction detector are C1–C7 paraffins, naphthenes and aromatics. Remaining products are mainly C8 compounds and linear olefins presenting a single unsaturation. The comparison between yield structures indicates that catalyst performance was mainly driven by the competition between hydroisomerisation and hydrogenolysis. It was found that the higher the Pt/Cl ratio, the higher the selectivity towards hydrogenolysis products. This behaviour has to do with the predominance of transformations on metal sites over mild Brønsted acid activity in the case of naphtha reforming catalysts. A linear dependence was established between the density in surface metal sites and the yield in C1–C2 hydrogenolysis products. The analysis of C7− products distribution indicates that cracking mainly results from mono-functional hydrogenolysis with a likely additional contribution of bi-functional hydrocracking. Cumulated hydrogenolysis is only observed in the case of 1%wt Pt samples. No clear correlation was found between the aromatic yield and catalyst properties. Hydrogenolysis product yield is sensitive to platinum content. Five and six atom ring naphthenes play the role of aromatisation intermediates. Chlorine content has nevertheless a surprising effect on hydrogenolysis product yield, with a minimum value observed at intermediate (around 0.5%wt Cl).Modelling
Reactor model
The reactor model used to describe the catalytic tests is written under the form of a Fortran code. This model is able to calculate reactor outlet composition given inlet composition and operating conditions. It assumes that chemical transformations on the active sites are the only phenomenon controlling experimental observations. An ideal isothermal and isobaric plug flow reactor model is considered. The following simplifications are made: the catalytic bed is considered as a pseudo-homogeneous zone where gas–solid reactions occur. All kind of dispersion phenomena are neglected as well as the effect of gas–solid transfer and internal pore diffusion. Deactivation phenomena are also neglected in this model. The validity of these hypotheses was checked during the experimental validation phase (see ref. 15 and 18). An ideal gas thermodynamic model was arbitrarily chosen. Formation standard enthalpies and standard entropies were taken from the DIPPR databank for each compound present in the model.Mass balances for each species on a control volume within the catalytic bed leads to a set of ordinary differential equations. Stationary regime is reached. This problem is then discretised and solved thanks to the LSODE program.19,20
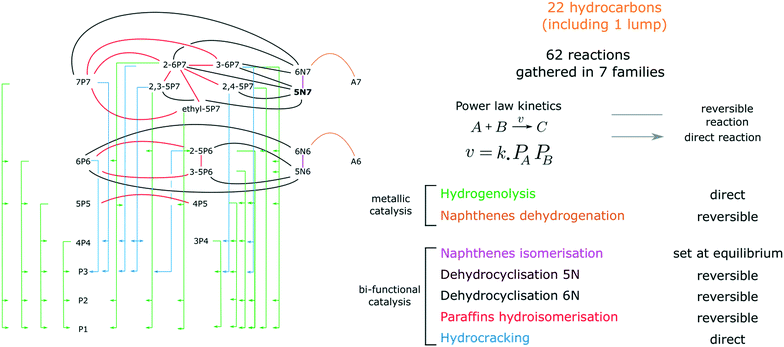
Kinetic scheme
A network of 61 reactions was developed to represent the transformations between 27 compounds (including 25 hydrocarbons, H2 and the inert tracer, He). Olefins and C8 compounds representing less than 2.5% of the GC FID chromatograms area, they were considered as trace species and excluded from the kinetic model. The 25 selected species are referred to as xLy. L stands for the hydrocarbon species (aromatics A, paraffins P, isoparaffins iP and naphthenes N) whereas x and y respectively indicate the length of the principal carbon chain and the total number of carbon atoms. 5N7 is the only lumped compound that gathers the 5 ring naphthenes. The thermodynamic parameters of this lump were arbitrarily set to the ethylcyclopentane values.Reactions are listed in Fig. 1 and on Table 1. They are grouped in 8 families. Hydrogenolysis and Hydrocracking reactions are assumed to be direct. Cyclisations, hydroisomerisations, naphthene interconversion and naphthene dehydrogenations are considered as reversible. Cyclisations are split in three families, C6 cyclisation, cyclisation into 6N7 and cyclisation into 5N7. It is to be noted that the proportion in 6N6 and A6 is rarely higher than 1% at the reactor outlet, which makes the model prediction insensitive to the presence of the benzene aromatisation network. Contrary to what is observed experimentally, the transformation between 6N7 and 5N7 is set at equilibrium in the kinetic model and the value of the corresponding equilibrium constant was fitted. We found it impossible to obtain both sensitive naphthene interconversion kinetic parameters and satisfactory fit of experimental results. This might be explained by a different reactivity of 5N7 isomers, that are not accurately quantified in these experiments.
| Number | Reaction | Type | Rate expression |
|---|---|---|---|
| Family 1: hydrogenolysis | |||
| 1 | 6P6 + H2 → 2·P3 | Direct | r 1 = k1(P6P6PH2) |
| 2 | 6P6 + H2 → 4P4 + P2 | ′′ | r 2 = k2(P6P6PH2) |
| 3 (ref) | 7P7 + H2 → 6P6 + P1 | ′′ | r 3 = k 3 (P 7P7 P H2 ) |
| 4 | 7P7 + H2 → 5P5 + P2 | ′′ | r 4 = k4(P7P7PH2) |
| 5 | 7P7 + H2 → P3 + P4 | ′′ | r 5 = k5(P7P7PH2) |
| 6 | 2,5-P6 + H2 → 2·P3 | ′′ | r 6 = k6(P2,5-P6PH2) |
| 7 | 2-6P7 + H2 → 3P4 + P3 | ′′ | r 7 = k7(P2-6P7PH2) |
| 8 | 2-6P7 + H2 → 4P4 + P3 | ′′ | r 8 = k8(P2-6P7PH2) |
| 9 | 2,3-5P7 + H2 → 4P4 + P3 | ′′ | r 9 = k9(P2,3-5P7PH2) |
| 10 | 2,4-5P7 + H2 → 3P4 + P3 | ′′ | r 10 = k10(P2,4-5P7PH2) |
| 11 | 2-5P6 + H2 → 5P5 + P1 | ′′ | r 11 = k11(P2-5P6PH2) |
| 12 | 2-5P6 + H2 → 4P5 + P1 | ′′ | r 12 = k12(P2-5P6PH2) |
| 13 | 2-5P6 + H2 → 3P4 + P2 | ′′ | r 13 = k13(P2-5PCPH2) |
| 14 | 3-5P6 + H2 → 4P5 + P1 | ′′ | r 14 = k14(P3-5P6PH2) |
| 15 | 3-5P6 + H2 → 3P4 + P2 | ′′ | r 15 = k15(P3-5P6PH2) |
| 16 | 2-6P7 + H2 → 2-5P6 + P1 | ′′ | r 16 = k16(P2-6P7PH2) |
| 17 | 2-6P7 + H2 → 6P6 + P1 | ′′ | r 17 = k17(P2-6P7PH2) |
| 18 | 2-6P7 + H2 → 4P5 + P2 | ′′ | r 18 = k18(P2-6P7PH2) |
| 19 | 3-6P7 + H2 → 6P6 + P1 | ′′ | r 19 = k19(P3-6P7PH2) |
| 20 | 3-6P7 + H2 → 3-5P6 + P1 | ′′ | r 20 = k20(P3-6P7PH2) |
| 21 | 3-6P7 + H2 → 2-5P6 + P1 | ′′ | r 21 = k21(P3-6P7PH2) |
| 22 | 3-6P7 + H2 → 4P5 + P2 | ′′ | r 22 = k22(P3-6P7PH2) |
| 23 | 3-6P7 + H2 → 4P4 + 3P3 | ′′ | r 23 = k23(P3-6P7PH2) |
| 24 | 2,3-5P7 + H2 → 2-5P6 + P1 | ′′ | r 24 = k24(P2,3-5P7PH2) |
| 25 | 2,3-5P7 + H2 → 3-5P6 + P1 | ′′ | r 25 = k25(P2,3-5P7PH2) |
| 26 | 2,3-5P7 + H2 → 4P5 + P2 | ′′ | r 26 = k26(P2,3-5P7PH2) |
| 27 | 2,4-5P7 + H2 → 2-5P6 + P1 | ′′ | r 27 = k27(P2,4-5P7PH2) |
| 28 | Ethyl-5P7 + H2 → 3-5P6 + P1 | ′′ | r 28 = k28(Pethyl-5P7PH2) |
| 29 | Ethyl-5P7 + H2 → 5P5 + P2 | ′′ | r 29 = k29(Pethyl-5P7PH2) |
| Family 2: hydrocracking | |||
|---|---|---|---|
| 30 | 6P6 + H2 → 2·P3 | Direct | r 30 = k30(P6P6PH2) |
| 31 (ref) | 7P7 + H2 → 4P4+P3 | ′′ | r 31 = k 31 (P 7P7 P H2 ) |
| 32 | 2-5P6 + H2 → 2·P3 | ′′ | r 32 = k32(P2-5P7PH2) |
| 33 | 2-6P7 + H2 → 3P4 + P3 | ′′ | r 33 = k33(P2-6P7PH2) |
| 34 | 2-6P7 + H2 → 4P4 + P3 | ′′ | r 34 = k34(P2-6P7PH2) |
| 35 | 3-6P7 + H2 → 4P4 + P3 | ′′ | r 35 = k35(P3-6P7PH2) |
| 36 | 2,3-5P7 + H2 → 4P4 + P3 | ′′ | r 36 = k36(P2,3-5P7PH2) |
| 37 | 2,4-5P7 + H2 → 3P4 + P3 | ′′ | r 37 = k37(P2,4-5P7PH2) |
| Family 3: 6N6 cyclisation | |||
|---|---|---|---|
| 38 | 6N6 + H2 ⇄ 6P6 | Reversible | r 38 = k38(P6P6PH2 − P6P6/Keq (38)) |
| 39 (ref) | 5N6 + H2 ⇄ 2-5P6 | ′′ | r 39 = k 39 (P 5N6 P H2 − P 2-5P6 /K eq (39)) |
| 40 | 5N6 + H2 ⇄ 3-5P6 | ′′ | r 40 = k40(P5N6PH2 − P3-5P6/Keq (40)) |
| 41 | 5N6 + H2 ⇄ 6P6 | ′′ | r 41 = k41(P5N6PH2 − P6P6/Keq (41)) |
| Family 4: 6N7 cyclisation | |||
|---|---|---|---|
| 42 (ref) | 6N7 + H2 ⇄ 7P7 | Reversible | r 42 = k 42 (P 6N7 P H2 − P 7P7 /K eq (42)) |
| 43 | 6N7 + H2 ⇄ 2-6P7 | ′′ | r 43 = k43(P6N7PH2 − P2-6P7/Keq (43)) |
| 44 | 6N7 + H2 ⇄ 3-6P7 | ′′ | r 44 = k44(P6N7PH2 − P3-6P7/Keq (44)) |
| Family 5: 5N7 cyclisation | |||
|---|---|---|---|
| 45 (ref) | 5N7 + H2 ⇄ 2-6P7 | Reversible | r 45 = k 45 (P 5N7 P H2 − P 2-6P7 /K eq (45)) |
| 46 | 5N7 + H2 ⇄ 3-6P7 | ′′ | r 46 = k46(P5N7PH2 − P3-6P7/Keq (46)) |
| 47 | 5N7 + H2 ⇄ 2,3-5P7 | ′′ | r 47 = k47(P5N7PH2 − P2,3-5P7/Keq (47)) |
| 48 | 5N7 + H2 ⇄ 2,4-5P7 | ′′ | r 48 = k48(P5N7PH2 − P2,4-5P7/Keq (48)) |
| Family 6: hydroisomerisation | |||
|---|---|---|---|
| 49 | 5P5 ⇄ 4P5 | Reversible | r 49 = k49(P5P5 − P4P5/Keq (49)) |
| 50 | 6P6 ⇄ 2-5P6 | ′′ | r 50 = k50(P6P6 − P2-5P6/Keq (50)) |
| 51 | 2-5P6 ⇄ 3-5P6 | ′′ | r 51 = k51(P2-5P6 − P3-5P6/Keq (51)) |
| 52 | 6P6 ⇄ 3-5P6 | ′′ | r 52 = k52(P6P6 − P3-5P6/Keq (52)) |
| 53 | 7P7 ⇄ 2-6P6 | ′′ | r 53 = k53(P7P7 − P2-6P7/Keq (53)) |
| 54 (ref) | 7P7 ⇄ 3-6P7 | ′′ | r 54 = k 54 (P 7P7 − P3-6P7/Keq(54)) |
| 55 | 7P7 ⇄ ethyl-5P7 | ′′ | r 55 = k55(P7P7 − Pethyl-5P7/Keq (55)) |
| 56 | 2-6P7 ⇄ 3-6P7 | ′′ | r 56 = k56(P2-6P7 − P2,3-5P7/Keq (56)) |
| 57 | 2-6P7 ⇄ 2,3-5P7 | ′′ | r 57 = k57(P2-6P7 − P2,3-5P7/Keq (57)) |
| 58 | 2-6P7 ⇄ 2,4-5P7 | ′′ | r 58 = k58(P2-6P7 − P2,4-5P7/Keq (58)) |
Power law kinetics are used and partial orders are equal to the stoichiometric coefficient of the reagents. The expressions handle partial pressures in gas phase and equilibrium constants. Rate expressions are provided on Table 1. Excepted the reactions of methylcyclohexane dehydrogenation and naphthenes interconversion, the equilibrium constant of reaction j(Keq(j)) is given by  .
.
Methylcyclohexane dehydrogenation experiments were carried out on the same set-up in order to determine the value of the related equilibrium constant. Results indicated strong deviations between the experimental dehydrogenation equilibrium and the expected value considering the ideal gas tabulated free enthalpy. This observation has been reported by other authors.21,22 The correlation proposed by Schildhauer et al. was well verified on methylcyclohexane dehydrogenation test and was therefore implemented in the present n-heptane reforming kinetic model. This gives, with T expressed in Kelvins,  . A dihydrogen partial pressure order was introduced and fitted in the expression of methylcyclohexane dehydrogenation rate constant. The value of this order was found to be close to 0.3. This suggests that hydrogen adsorption on the catalytic surface cannot be neglected and that a power law expression is hardly valid for this equation.
Linear free energy relationships (LFER)
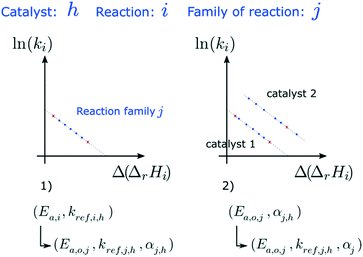
The dependence of reaction constants on temperature is taken into account by the Arrhenius equation. The relation is used with an expression of the pre-exponential factor in function of the rate constant at a reference temperature (500 °C). This leads to the following expression for a given reaction (i): . Let it be ki and Ea,i two fitted parameters for each of the 61 reactions included in the kinetic model and each of the 19 catalysts, the total number of adjustable parameters would exceed the total number of experimental points. Linear free energy relationships (LFER) are then introduced in order to reduce the total number of parameters and to gather those parameters by family of reactions.23 LFER rely under the assumption that, within a family (j), the difference of activation energy is proportional to the difference of reaction enthalpies. The proportionality coefficient is called αj and is considered as an adjustable real number parameter. An additional assumption is made by considering than the pre-exponential factors (rate constant at infinite temperature) are equal for all the reactions belonging to a same family. Activation energy is then expressed as Ea,i = Ea,o + αj (ΔrHo − ΔrHi), which gives, by injection inside the Arrhenius expression:
  . Written as such, the rate constant of each reaction can be computed from the activation energy and the rate constant of a reference reaction (noted o). Those two fitted parameters bear all the kinetic information related to the family. The reference reactions by families are specified on Table 1.
The teams of Yoneda and Klein made a similar use of LFER in order to address catalyst formulation change issues.23–29 They observed that, when ln(ki) is plotted over Δ(ΔrH) the strait lines corresponding to an identical family of reactions for different catalysts are parallel (see Fig. 2). This suggests that the proportionality coefficient αj is kept from a catalyst to another. This is an approximation that was made all along this study.
Parameter regression
As the nature of active sites is assumed to be identical between catalysts, common activation energies (Ea,j) were fitted for each family j and set for all the formulations tested. Similarly, LFER proportionality coefficients (αj) are common to all the catalysts. On the contrary, each formulation is characterised by its set of reference reaction rate constants at reference temperature (kj,h).Reference activation energies, reference rate constants and αj parameters were first fitted on P-egg tests. Then, activation energies and αj coefficients values were extrapolated to T-flat catalysts before the adjustment of reference rate constants on this second family of catalysts. N6 cyclisation (family 3) parameters were not statistically significant. N6 compounds are trace species and family 3 could have been removed from the model.
The optimisation routine is written as a Fortran code and is based on a modified Levenberg–Marquardt algorithm.30,31 The optimiser identifies a set of parameters values that minimises an objective function measuring the deviations between model-predicted and experimental observables. In this case, the outlet molar flows of the 25 selected hydrocarbons are the observables. As presented on Table 2, the objective function is defined as the sum of square deviations for each observable weighted by the carbon atom number of each species. The experiments selected for the optimisation procedure were randomly chosen at a total pressure of 10 barg. The number of selected points is equal to 75% of the validation basis (see Table 3). The set of common fitted parameters estimates is displayed on Table 4.
| Fit on P-egg catalysts | Fit on T-flat catalysts | |
|---|---|---|
| Number of fitted parameters | 82 | 63 |
| Validation basis size/pts | 405 | 355 |
| Fitting basis size/pts | 622 | 551 |
| Objective function | 2.8 × 10⁻⁴ | 3.5 × 10⁻⁴ |
Validation of the model
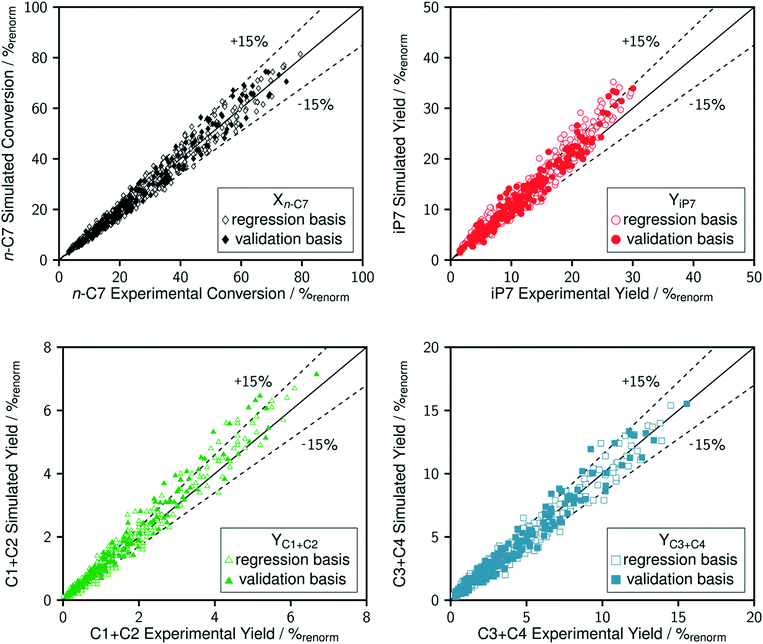
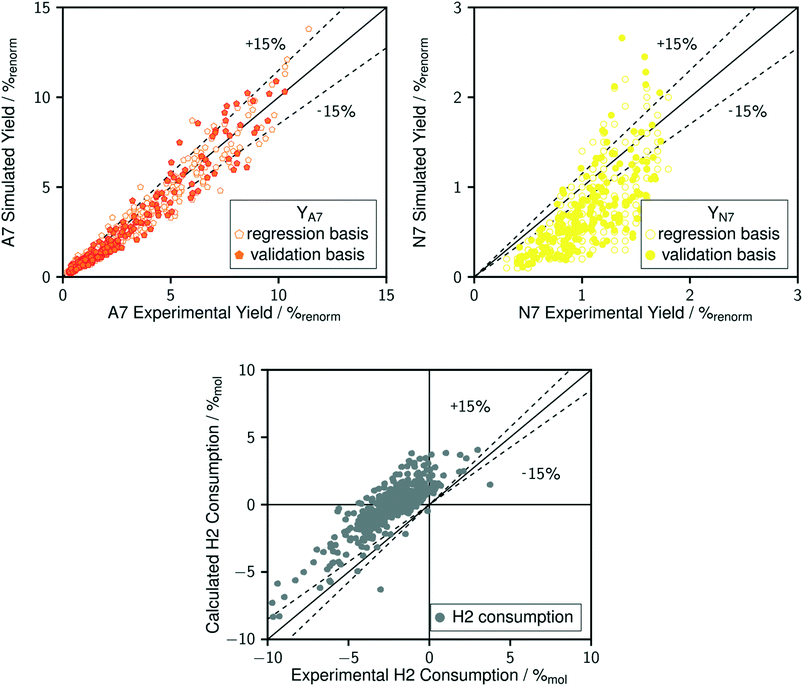
The comparison between model predictions and experimental performances for a set of 10 P-egg catalysts is given on Fig. 3 and 4. Plots obtained with the 9 T-flat catalysts are very similar and they are shown in the ESI.† The parity plots are given for conversion, main product yields as well as dihydrogen consumption. Conversion points distribution is roughly symmetrical with regards to the first bisector and relative value dispersion is between − and +15%. Above 50% conversion, model predictions overestimate isoparaffins yields. Aromatisation products prediction is poorer than for the other products. This could be associated to an inadequate power law rate expression. Dihydrogen consumption is overestimated. Nevertheless, dihydrogen is not taken into account in the objective function definition. The model is fitted on the data that are provided by the FID GC analysis only whereas experimental dihydrogen consumption was calculated from the thermo-conductivity detector (TCD) GC analysis. The accuracy of predictions is comparable between catalysts. No catalyst formulation nor support nature variations were associated to bias in model predictions. As shown in Fig. 5 in the case of a single example catalyst (P-egg_0.3%wtPt_1.3%wtCl), the effect of temperature and contact time variations is reproduced by the model. The quality of model predictions is comparable between different catalysts.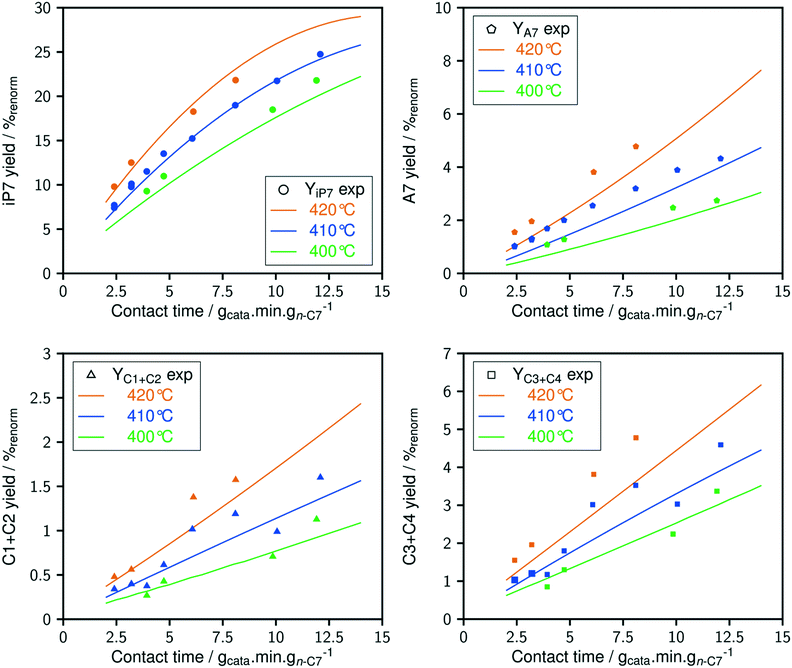 | ||
| Fig. 5 Model prediction of temperature and contact time variations for a given catalyst (P-egg_0.3%wtPt_1.4%wtCl). | ||
The individual significance of each parameter was assessed by performing a student's t-test. In this study, the parameters were considered statistically different from zero, when the estimates dispersion exceeds 95% of the reference tabulated value at the same degree of freedom. Parameters for which the absolute t-value is lower than ten do not satisfy the t-test. 6N cyclisation kinetic parameters, hydrocracking and 6N7 cyclisation LFER α coefficients are therefore considered as statistically irrelevant whereas all the other parameters satisfy the t-test.
Results: influence of active phase formulation changes on n-heptane reforming kinetics
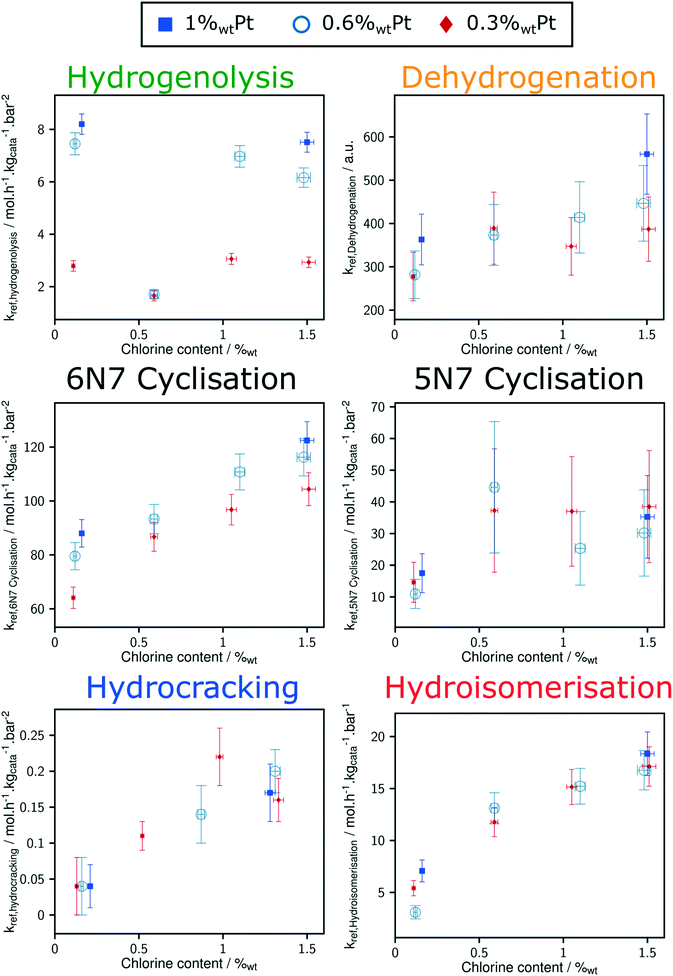
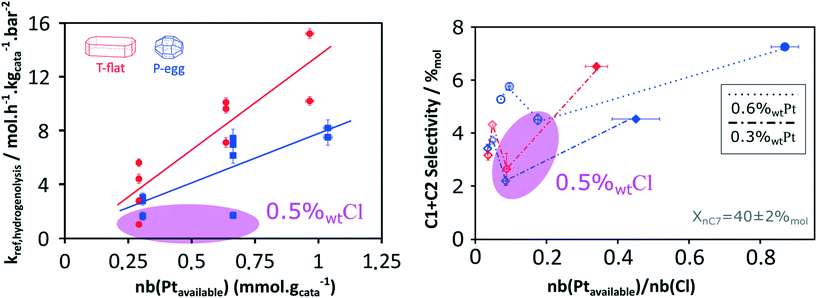
Thanks to the modelling strategy, the dependency of n-heptane reforming reaction rates over Pt and Cl content is borne by a limited number of parameters: the reference rate constant for each family of reaction. Fig. 6 shows the relation between the reference rate constants and P-egg catalysts formulation. The corresponding figure obtained with T-flat catalysts is given in ESI.† Horizontal error bars take into account the experimental uncertainties regarding chlorine content whereas vertical error bars refer to the confidence interval obtained for each parameter following the optimisation procedure. It should be noted that vertical errors are minimised in the case of hydrogenolysis and hydroisomerisation reactions. This can be compared to the experimental observation according to which it is the competition between hydrogenolysis and hydroisomerisation reactions that was mainly affected by formulation variations.15Hydrogenolysis and naphthene dehydrogenation pathways were expected to be catalysed by the metallic phase only. As illustrated on Fig. 8, at a given Cl content, hydrogenolysis activity is roughly proportional to Pt concentration. On the contrary, an increase in Pt is not correlated to a significant rise in naphthene dehydrogenation reference rate constant. This could be explained by the rapidity of naphthene dehydrogenation transformations. Even at 0.3%wt Pt, cyclisation appears as the limiting paraffin aromatisation step. Similarly, the apparent dependence of dehydrogenation reference constant on Cl content might be an artefact inherited from the preceding cyclisation step. The proper distinction between naphthene cyclisation and dehydrogenation kinetics is made difficult by the low concentrations in cycloalkane intermediates. However, a clear dependence of the overall paraffin aromatisation pathway on chlorine content is observed. This supports the bi-functional description of the aromatisation pathway in naphtha reforming.32–35
Hydroisomerisation activity is controlled by chlorine catalyst content and there is no significant dependence of this parameter on Pt content. Moreover, hydroisomerisation activity tends to disappear when chlorine concentration tends to zero. Therefore, it seems that in the range of formulations tested in this study, hydroisomerisation is limited by transformation on acid sites.
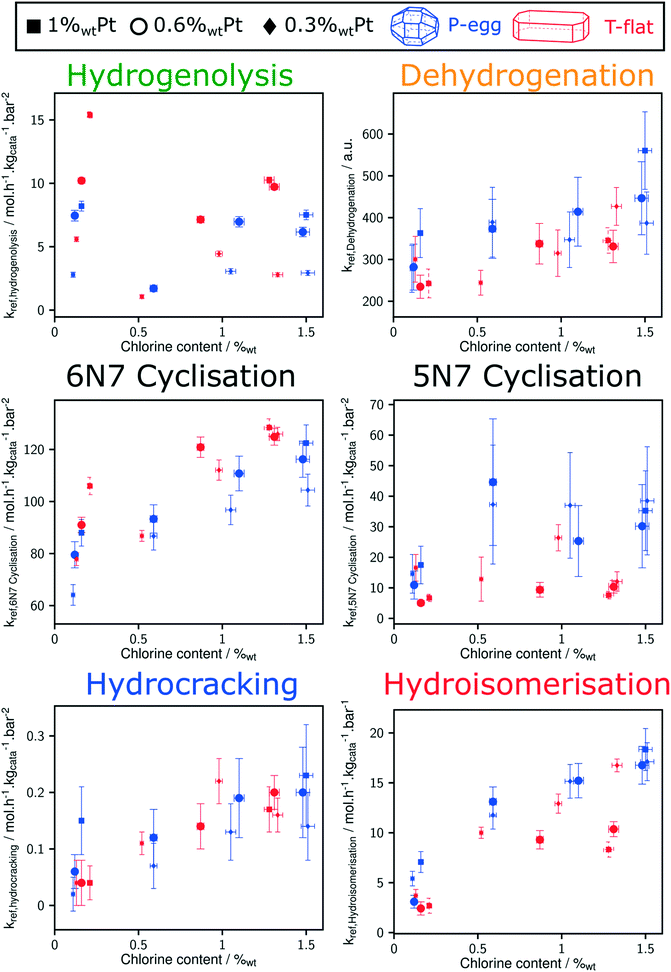
Direct comparison between T-flat and P-egg catalysts is provided on Fig. 7. The striking difference between the catalytic behaviour of the two families of catalysts lies in the hydrogenolysis activity, hydrogenolysis being enhanced on T-flat catalysts. The impact of the support nature on the kinetic parameters of the other reaction families is small or negligible.
Discussion
Considering the shorter edge length per gram of catalyst for T-flat systems as well as the preferential location of Pt and Cl sites on edges, one can expect that chlorine repartition at the vicinity of Pt nanoparticles is higher on T-flat than on P-egg supports. Provided that chlorine modulates the intrinsic hydrogenolysis activity of Pt nanoparticles, the difference in crystallite morphology could therefore explain the impact of the support nature on the catalyst selectivity. On the contrary, the difference in the repartition between Pt and Cl induced by support morphology variations does not affect the value of bi-functional reactions parameters. The distance between metal and acid sites might not be a good selectivity descriptor for the given system.The selectivity in C1 + C2 products singularly drops at intermediate chlorine content (around 0.5%wt). According to this study, this phenomenon is specifically due to an inhibition of the hydrogenolysis rate constants. This observation was reproducible and systematically made on different supports and at different Pt contents (see Fig. 8). The origin of the non-monotonous trends linking catalysts performance and their active phase composition is still unclear. A more accurate description of chlorine impact on active phase structure and a more sophisticated description of the active sites could bring some explanations. Chlorine was found to stabilise Pt single atoms that can possibly act as secondary metallic sites. As in the case of the support effect, the influence of chlorine on metallic site structure and strength may be involved in the non-monotonous relation between hydrogenolysis activity and chlorine content. Another explanation is proposed: assuming the formation of a coke deposit on acid sites, the preferential location of chlorine could impact the preferential repartition of coke and could lead to an inhibition of hydrogenolysis activity at intermediate chlorine levels.
Conclusions
An intrinsic kinetic model was hereby developed in order to explore the influence of an active phase formulation change on the selectivity of a bi-functional reaction network. An identical kinetic scheme is used with a broad range of catalytic formulations. The accuracy of predictions is comparable between catalysts. Thanks to LFER, gathering reactions into families provides a limited number of statistically significant reference rate constants that are used to compare catalysts and to identify more easily possible tendencies linking active phase formulation with kinetics parameters.This study digs two debated issues in naphtha reforming with Pt/γ-Al2O3–Cl catalysts: the nature of the catalytic limiting steps for different reaction pathways as well as the physico-chemical properties of the catalyst impacting reaction selectivity. As observed experimentally, this study confirms that the main impact of alumina support change is made on the hydrogenolysis activity. The rate constants related to the other reaction families are poorly affected by the nature of the support. Hydroisomerisation activity is very preferentially correlated to chlorine content. Over the catalyst panel, it is therefore likely that hydroisomerisation reactions proceed through acid step limited mechanisms.
Aromatisation of paraffins through dehydrocyclisation into naphthenes followed by dehydrogenation was found to be sensitive on both platinum and chlorine amounts. This result excludes an aromatisation pathway catalysed exclusively on the metallic sites.
As reported by the experimental study, a spectacular inhibition of the hydrogenolysis activity is systematically observed at intermediate chlorine contents (around 0.5%wt Cl). The kinetic model does not provide explanations about the origin of this phenomenon. Complementary testing and investigations of post-mortem catalysts could bring some hints.
One can suggest to apply the kinetic modelling methodology proposed in n-heptane reforming to a full naphtha cut. It requires the extension and the validation of LFER reaction families to heavier compounds (up to C12). The addition of a deactivation model is also needed in these conditions. Then, a descriptor based model could be extrapolated at the process scale. Some conclusions can still already be applied to the optimisation of new catalysts. The dependence of the hydrogenolysis activity on chlorine content and gamma alumina support morphology opens new catalysts development perspectives in order to meet the demand for higher C5+ reformate products yields.
Nomenclature
| α | LFER proportionality coefficient |
| ΔrG | Reaction free enthalpy |
| ΔrH | Reaction enthalpy |
| ω | Parameter weight in the regression procedure |
| E a | Activation energy |
| exp | Experimental value |
| F n | Molar flow of species n |
| h | Catalyst |
| i | Family of reaction |
| j | Reaction |
| K eq | Equilibrium constant |
| k | Rate constant |
| n | Reaction partial order |
| obs | Observable |
| P | Partial pressure |
| o | Reference reaction within a family |
| R | Ideal gas constant |
| S | Selectivity |
| sim | Simulated value |
| X | Conversion |
| Y | Yield |
| v | Speed of reaction |
Conflicts of interest
There are no conflicts of interest to declare.Acknowledgements
The authors would like to thank IFPEN for financial support as well as colleagues from IFPEN Process Design and Modelling division for sharing their expertise in naphtha reforming kinetics.References
- J. W. Thybaut and G. B. Marin, J. Catal., 2013, 308, 352–362 CrossRef CAS
.
- S. M. Rao and M. O. Coppens, Chem. Eng. Sci., 2012, 83, 66–76 CrossRef CAS
.
-
J. A. Dumesic, The microkinetics of heterogeneous catalysis, An American Chemical Society Publication, 1993 Search PubMed
.
- K. Toch, J. W. Thybaut and G. B. Marin, AIChE J., 2015, 61, 880–892 CrossRef CAS
.
- O. Said-Aizpuru, F. Allain, F. Diehl, D. Farrusseng, J. F. Joly and A. Dandeu, New J. Chem., 2020, 44, 7243–7260 RSC
.
-
G. J. Antos and A. M. Aitani, Catalytic naphtha reforming, revised and expanded, CRC Press, 2004 Search PubMed
.
-
P. Leprince and others, Procédés de transformation. Le raffinage du pétrole, in Éditions Technip, Paris, 1998 Search PubMed
.
-
J. P. Boitiaux, J. M. Deves, B. Didillon and C. R. Marcilly, Catalytic naphtha reforming science and technology, Marcel Dekker, New York, 1995, pp. 79–111 Search PubMed
.
- G. A. Mills, H. Heinemann, T. H. Milliken and A. G. Oblad, Ind. Eng. Chem., 1953, 45, 134–137 CrossRef CAS
.
- R. B. Smith, Chem. Eng. Prog., 1959, 55, 76–80 CAS
.
- J. Ancheyta-Juarez and E. Villafuerte, Energy Fuels, 2000, 14, 1032–1037 CrossRef CAS
.
- J. Ancheyta-Juarez, E. Villafuerte-Macias, L. Diaz-Garcia and E. Gonzalez-Arredondo, Energy Fuels, 2001, 15, 887–893 CrossRef CAS
.
- M. A. Rodríguez and J. Ancheyta, Fuel, 2011, 90, 3492–3508 CrossRef
.
- A. N. Zagoruiko, A. S. Belyi and M. D. Smolikov, Ind. Eng. Chem. Res., 2021 DOI:10.1021/acs.iecr.0c05653
.
- O. Said-Aizpuru, A. T. Fialho Batista, C. Bouchy, V. Petrazzuoli, F. Allain, F. Diehl, D. Farrusseng, F. Morfin, J. F. Joly and A. Dandeu, ChemCatChem, 2020, 12, 2261–2270 CrossRef
.
- A. T. F. Batista, W. Baaziz, A. L. Taleb, J. Chaniot, M. Moreaud, C. Legens, A. Aguilar-Tapia, O. Proux, J. L. Hazemann, F. Diehl, C. Chizallet, A. S. Gay, O. Ersen and P. Raybaud, ACS Catal., 2020, 10, 4193–4204 CrossRef CAS
.
- A. T. F. Batista, D. Wisser, T. Pigeon, D. Gajan, F. Diehl, M. Rivallan, L. Catita, A. S. Gay, A. Lesage, C. Chizallet and P. Raybaud, J. Catal., 2019, 378, 140–143 CrossRef CAS
.
- V. Petrazzuoli, M. Rolland, A. Mekki-Berrada, O. Said-Aizpuru and Y. Schuurman, Chem. Eng. Sci., 2020, 116314 Search PubMed
.
- A. C. Hindmarsh, ACM Signum newsl., 1980, 15, 10–11 CrossRef
.
- K. Radhakrishnan and A. C. Hindmarsh, NASA Reference publication 1327.
- J. K. Ali and A. Baiker, Chem. Eng. Commun., 2018, 1–10 Search PubMed
.
- T. Schildhauer, E. Newson and S. Müller, J. Catal., 2001, 198, 355–358 CrossRef CAS
.
- S. R. Horton and M. T. Klein, Energy Fuels, 2013, 28, 37–40 CrossRef
.
- I. Mochida and Y. Yoneda, J. Catal., 1967, 7, 386–392 CrossRef CAS
.
- I. Mochida and Y. Yoneda, J. Catal., 1967, 7, 393–396 CrossRef CAS
.
- I. Mochida and Y. Yoneda, J. Catal., 1967, 8, 223–230 CrossRef CAS
.
- Y. Yoneda, J. Catal., 1967, 9, 51–56 CrossRef CAS
.
- I. Mochida and Y. Yoneda, J. Catal., 1967, 9, 57–62 CrossRef CAS
.
- I. Mochida, J. Take, Y. Saito and Y. Yoneda, J. Org. Chem., 1967, 32, 3894–3898 CrossRef CAS
.
- K. Levenberg, Q. Appl. Math., 1944, 2, 164–168 CrossRef
.
- D. W. Marquardt, J. Soc. Ind. Appl. Math., 1963, 11, 431–441 CrossRef
.
- B. H. Davis and P. B. Venuto, J. Catal., 1969, 15, 363–372 CrossRef CAS
.
- B. H. Davis, J. Catal., 1973, 29, 398–403 CrossRef CAS
.
- A. Arcoya, X. L. Seoane and J. M. Grau, Appl. Catal., A, 2005, 284, 85–95 CrossRef CAS
.
- V. K. Shum, J. B. Butt and W. M. H. Sachtler, Appl. Catal., 1984, 11, 151–154 CrossRef CAS
.
Footnote |
| † Electronic supplementary information (ESI) available. See DOI: 10.1039/d1re00073j |
| This journal is © The Royal Society of Chemistry 2021 |


![[double bond, length as m-dash]](https://www.rsc.org/images/entities/b_char_e001.gif) 5N7
5N7


![[thin space (1/6-em)]](https://www.rsc.org/images/entities/char_2009.gif) 762
762


