 Open Access Article
Creative Commons Attribution 3.0 Unported Licence
Kinetic study and modeling of the Schotten–Baumann synthesis of peroxyesters using phase-transfer catalysts in a capillary microreactor
M.
Magosso
a,
M.
van den Berg
 b and
J.
van der Schaaf
 *a
*a
aSustainable Process Engineering, Department of Chemical Engineering and Chemistry, Eindhoven University of Technology, P.O. Box 513, 5600 MB, Eindhoven, The Netherlands. E-mail: j.vanderschaaf@tue.nl
bNouryon, Polymer Catalysts, P.O. Box 10, 7400 AA, Deventer, The Netherlands
First published on 24th May 2021
Abstract
The kinetics of the synthesis of tert-butyl peroxy-2-ethylhexanoate were investigated in a capillary microreactor. TBPEH was synthesized from 2-ethylhexanoyl chloride and tert-butyl hydroperoxide in the presence of a strong base, using the Schotten–Baumann method. The peroxyesterification reaction is always in competition with the unwanted acid chloride hydrolysis. The synthesis was carried out with and without a phase-transfer catalyst. The non-catalyzed reaction showed a low rate, which could be incremented by increasing the temperature and the liquid–liquid interfacial area or by using KOH instead of NaOH as base. The peroxyesterification and hydrolysis rates increased with temperature. However, the use of KOH or the increase in interfacial area accelerated only the peroxyester formation, increasing the selectivity towards the desired product. The addition of a PTC enhanced the peroxyesterification rate without changing the hydrolysis rate. Among the screened PTCs, quaternary ammonium salts with longer alkyl chains gave the best performance, up to 25 times faster peroxyesterification. The rate increase was proportional to the PTC amount. The interfacial area had the same effect as in the non-catalyzed reaction. Because of the tremendous increase in the reaction speed due to the PTC, the rate increased with slug velocity. At low slug velocity the reactants in the thin liquid film surrounding the droplets in the capillary are depleted and the peroxyesterification rate decreases. A reaction mechanism is proposed that explains the experimental observation. The corresponding kinetic model predicts the observed reaction rate with 10% accuracy.
1. Introduction
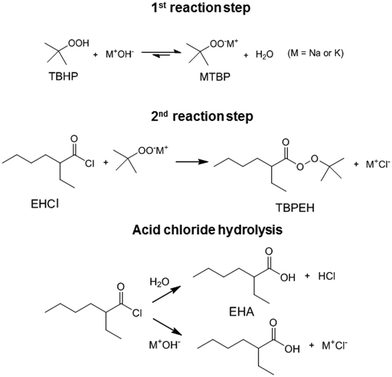
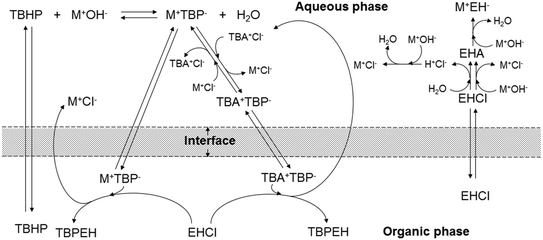
Peroxyesters are important compounds mainly used as initiators for polymerization reactions and hardeners for resins. They are synthesized in the industry using the Schotten–Baumann procedure,1,2 which consists in the biphasic reaction between an acid chloride and an alkyl hydroperoxide under alkaline conditions.3 The most commonly used bases are NaOH and KOH. The base deprotonates the alkyl hydroperoxide, making it a more reactive nucleophile.An example of a commercial peroxyester, whose synthesis was studied in the present work, is tert-butyl peroxy-2-ethylhexanoate (TBPEH). The reactions involved are shown in Fig. 1.
The first reaction step is the deprotonation of tert-butyl hydroperoxide (TBHP) with the base (MOH) in the aqueous phase, a homogeneous and slightly exothermic reaction. The base is usually in excess with respect to TBHP to ensure a high enough pH when the reaction has almost completed. Thanks to the TBHP acidity, the equilibrium is shifted to the right and most of the TBHP present in the aqueous phase is deprotonated. The alkali salt of TBHP (MTBP) further reacts with 2-ethylhexanoyl chloride (EHCl) to form TBPEH and a chloride salt (MCl). The reaction is biphasic with MTBP, MOH, MCl and some TBHP in the aqueous phase and EHCl, TBPEH and most of TBHP in the organic phase. The reaction between EHCl and TBHP is very slow and can be neglected.
Previous research on the Schotten–Baumann reaction kinetics in batch reactors suggested that the reaction occurs in the organic phase after the transfer of the nucleophile (alcohol, diol, polyol, amine, hydroperoxide) from the aqueous phase.4–7 Other authors reported for the benzoylation of nucleophiles, such as acetate,8 benzoate,9 isobutyrate and p-toluate ions,10 that the reaction takes place in both phases. For the esterification of poly(vinyl alcohol)11 it was suggested that the reaction starts in the water phase and continues in the organic one as the partially esterified alcohol becomes more lipophilic. The reaction phase apparently depends on the physical and chemical properties of the system.
Regarding the kinetic regime, there is agreement that a higher degree of agitation has a beneficial effect on the process, suggesting the presence of mass-transfer limitations.4,9,12
The side reaction of the Schotten–Baumann method is the acid chloride hydrolysis. In our case, the by-products formed are then 2-ethylhexanoic acid (EHA) and HCl, which are neutralized by the base.
A fed-batch process is still the most employed way to manufacture peroxyesters in industry, although a few examples of continuous processes exist.13,14 In the fed-batch process, the reactor is pre-charged with water, TBHP and the base. EHCl is then carefully dosed to control the reaction temperature. The reaction temperature must be strictly controlled to avoid peroxide decomposition and the subsequent yield loss or, in worst cases, runaway phenomena that could lead to severe incidents. Switching to a continuous process has the advantages of a better temperature control and lower liquid holdup, increasing the safety of the process. Moreover, a continuous process is usually more economical than batch processes.
The goal of this work was to study the kinetics of the Schotten–Baumann synthesis of TBPEH to better elucidate its mechanism, to understand the effect of different parameters on the reaction rate and selectivity, and to develop a kinetic model. The acquired information is valuable to assess the feasibility of a continuous industrial process and for its design and optimization. Moreover, the findings of this work provide useful insights regarding the Schotten–Baumann method in general.
The kinetic study was performed in a capillary slug-flow microreactor to have a very tight temperature control and well-defined and measurable liquid–liquid interfacial area.15 The influence of the following parameters on the reaction rate was investigated: type of base, reactants concentration, temperature, and liquid–liquid interfacial area.
The synthesis of the peroxyesters tert-butyl peroxypivalate and TBPEH has already been studied using continuous capillary microreactors.16–21 The aim of these studies was mainly to intensify the reaction by applying higher temperatures and increase interphase contact and mixing. Higher turbulence was achieved by using orifices, ultrasound, or micro-structured capillaries, and typically resulted in an acceleration of the reaction. However, a detailed kinetic investigation is missing.
In the current work the reaction was also carried out in the presence of a phase-transfer catalyst (PTC). PTCs are molecules able to accelerate the rate of liquid–liquid interfacial reactions.22 Two different categories of PTCs were tested: quaternary ammonium salts and crown ethers.23 Both of them react with MTBP to form a new ion pair which has a higher affinity with the organic phase and/or a higher reactivity.24
With the experimental results, we elucidate here the reaction mechanism and develop a corresponding kinetic model for the peroxyesterification with and without PTC.
2. Experimental
2.1. Materials
2-Ethylhexanoyl chloride and 2-ethylhexanoic acid were purchased from TCI Europe. tert-Butyl hydroperoxide (70 wt% solution in water) and isododecane (IDD, 80% mixture of isomers) were ordered from Alfa Aesar. Sodium and potassium hydroxide were purchased as 10 N and 8 N solutions from HACH and AMRESCO, respectively. The phase transfer catalysts 18-crown-6 (18-C-6), 15-crown-5 (15-C-5), tetrabutylammonium chloride (TBACl), tetrabutylammonium bromide (TBABr), tetrabutylammonium hydrogen sulfate (TBAHS), methyl tributyl ammonium chloride (MTBACl) and benzyltriethylammonium chloride (TEBACl) were purchased from Sigma Aldrich.TBPEH, needed for HPLC calibration, was synthesized using the Schotten–Baumann method and purified.25 The aqueous phase was prepared by dosing the 70 wt% TBHP aqueous solution into a round-bottom flask containing concentrated KOH solution while stirring. Water was then added to adjust the concentration to the desired value: CaqTBHP = 2.30 M, CaqKOH = 2.65 M. The desired amount of aqueous phase was poured into another round-bottom flask kept under agitation and cooled with an ice bath. EHCl was dosed into the flask, adjusting the dosing rate to keep the reactor temperature below 40 °C. The initial aqueous to organic volume ratio was AO = 2.76, needed to have a 10% molar excess of TBHP with respect to EHCl. The total liquid volume was 40 mL. After EHCl addition, the reaction mixture was stirred for 4 hours. The organic phase was separated and washed once with a 5 wt% sodium carbonate solution and three times with deionized water and dried over anhydrous magnesium sulfate. The purity of the product, measured by HPLC, was 99 wt%.
2.2. Experimental setup
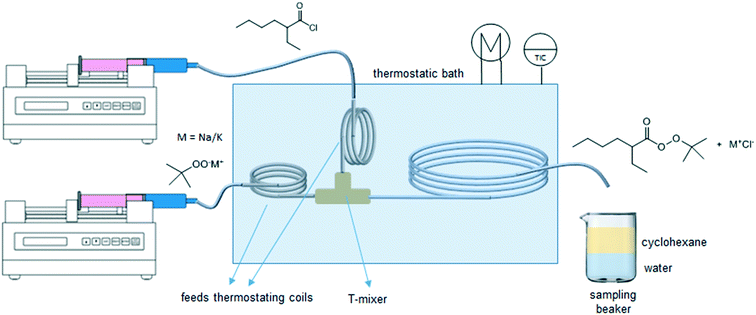
The experimental microreactor setup is shown in Fig. 2. The aqueous phase was prepared separately in batch by the addition of TBHP, MOH and, when used, the PTC, and allowed to cool. This solution and the organic phase made of EHCl, pure or diluted with IDD, were fed separately using two Chemyx Fusion 500 syringe pumps and mixed in a PEEK T-junction before entering the reaction capillary. The flowrates of the two phases were selected so that a regular and stable slug-flow regime was always present in the reactor capillary. All the capillaries were immersed in a thermostatic bath for precise temperature control. Both feed lines had a metal coil (IDcap = 0.75 × 10⁻³ m, ODcap = 1.59 × 10⁻³ m, Lcap = 50 × 10−2 m) to ensure that the two phases reached the desired temperature before entering the reaction capillary. The reaction capillaries were made of PFA, ODcap = 1.59 × 10⁻³ m and IDcap ranging from 0.50 × 10⁻³ to 1.00 × 10⁻³ m.For the interfacial area measurement, pictures of the slug-flow were taken using a Nikon Coolpix A900 digital camera. For a better visualization, the organic phase was dyed with Lumogen Red F 305, a dye inert towards the species present in the system. A ruler was used as reference length to measure the geometry of the slug by image analysis using the IC Measure software. One of the slug-flow pictures taken is shown in Fig. 3.
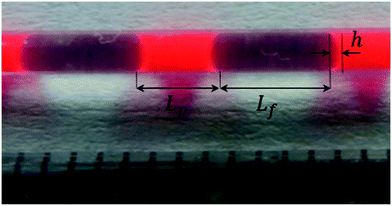 | ||
| Fig. 3 A picture of the slug-flow used to determine Lp, Lf and h. Bright red = organic phase, transparent = aqueous phase. | ||
The slug-flow characteristics varied in each experiment as a function of AO and IDcap. For all other parameters (residence time, slug-flow velocity, temperature or PTC amount), it was verified that the change in this parameter did not affect the slug-flow geometry and regularity.
2.3. Sample preparation and analysis
The aqueous phase of the reaction mixture coming out from the reaction capillary contained MTBP, small amounts of TBHP, MOH, MCl, PTC (when used) and most of the EHA carboxylate. The organic phase contained the EHCl, TBPEH, most of the TBHP and part of the EHA carboxylate.After waiting for at least two residence times to ensure steady state, a 2 mL sample of the biphasic reaction mixture was collected in a beaker previously filled with 25 mL of deionized water and 25 mL of cyclohexane. The volume of collected reaction mixture was indirectly measured from the sampling time, knowing the total volumetric flowrate in the reaction capillary. When the reaction mixture dripped in the beaker the organic phase mixed with the cyclohexane layer, while the aqueous phase mixed with the deionized water layer. Since the collecting beaker was not mixed, the interfacial area and mass transfer between the two liquid layers in it were very low. Together with the instantaneous dilution, this ensured the complete stop of the reaction. After the sample collection the content of the beaker was poured into a separation funnel. The aqueous phase was collected in a 100 mL volumetric flask, diluted to 100 mL with deionized water and analyzed by HPLC. The organic layer was collected in another volumetric flask, diluted to 100 mL with methanol and analyzed using the same instrument.
By diluting the cyclohexane layer with methanol, EHCl was completely converted to methyl-2-ethylhexanoate, which was measured by HPLC. The acid chloride cannot be injected directly into the HPLC column because it could react with the eluent and the stationary phase, giving inaccurate and irreproducible results.
The HPLC Shimadzu UFLC XR was equipped with a CBM-20A controller, two LC-20AD XR pumps, a SIL-20AC XR autosampler, a CTO-20AC column oven and a SPD-M20AD diode array detector. An Agilent ZORBAX SB-C18, 4.6 × 250 mm, 5 μm column was used. The eluent consisted in a mixture of water (19 vol%) and methanol (81 vol%) with 0.01 M phosphoric acid. The latter was added to ensure the protonation of all the analytes and to avoid double peaks in the chromatogram. During each analysis the composition of the eluent was kept constant. The eluent flowrate was 1 mL min−1 and the injection volume was 5 μL. A diode array detector was used and the chromatograms were acquired at a wavelength of 210 nm. The concentrations of EHCl, TBPEH and EHA in both the organic and the aqueous samples were determined.
2.4. Calculation of conversion and yields
By knowing the concentrations of the reactants and products in the samples, the sampling time, the sampling procedure and the properties of the microreactor feeds, it was possible to calculate the molar flowrates of EHCl, TBPEH and EHA at the outlet of the microreactor.From the inlet and outlet molar flowrates, the conversion of EHCl (XEHCl), yield of TBPEH (YTBPEH), yield of EHA (YEHA) and selectivity of TBPEH (STBPEH) were calculated as:
 | (1) |
 | (2) |
 | (3) |
 | (4) |
2.5. TBHP concentration measurements
Measurements were performed to check the partition of TBHP and MTBP between the aqueous and the organic phase of the reaction mixture. Unfortunately, it was not possible to use EHCl as the organic phase because of its high reactivity. Ethyl hexanoate was used instead because of its similar structure and physical properties. An aqueous phase with the desired concentration of TBHP and MOH was prepared, mixed with ethyl hexanoate and stirred. To measure the TBHP and MTBP concentrations into the organic phase, the stirring was interrupted; the two phases were allowed to separate and 1 mL of organic phase was withdrawn and injected into the HPLC column after diluting it 10 times with methanol. The HPLC analysis parameters were the same as those reported in section 2.3. Because of the acidic eluent it was not possible to distinguish between TBHP and MTBP. For each measurement, samples were taken at different mixing times: 1 min, 5 min, 10 min and 30 min. It was found that the equilibrium concentration of TBHP in ethyl hexanoate was already reached after one minute.3. Kinetic study
3.1. Kinetic study without phase-transfer catalysts
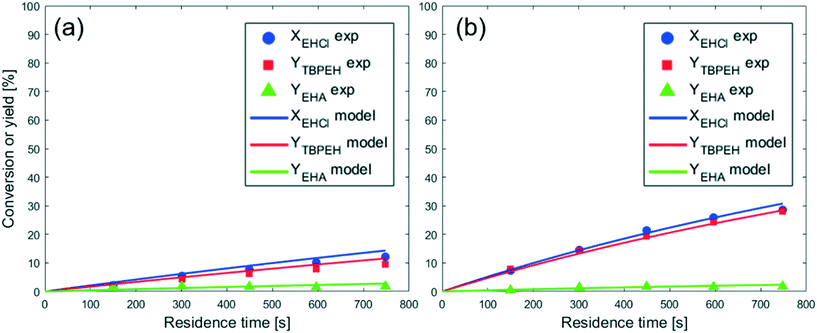
From the observation of Fig. 4, it is evident that the peroxyesterification is much faster with KOH, while the hydrolysis rate is the same as that obtained with NaOH. The TBPEH yield at τ = 750 s is 10% for NaOH and 30% for KOH. The TBPEH selectivity can thus be increased by using KOH.
If the reaction would take place in the organic phase after the migration of MTBP from the aqueous phase into the organic phase and its subsequent reaction with EHCl, the cause for the higher reactivity obtained with KOH could be a higher solubility of KTBP than NaTBP in the organic phase. Because of its lower charge density, K+ is a softer cation than Na+, and this can make the KTBP ion pair more soluble in apolar media like EHCl.26 To investigate this possibility, measurements were performed as described in section 2.5. One aqueous solution of NaTBP and one of KTBP, with the same concentrations used for the experiments of Fig. 4 (CaqTBHP = 2.00 M, ϕTBHP = 1.10, ϕMOH = 1.15), were prepared. Each solution was mixed with ethyl hexanoate and stirred. The ratio of the aqueous to the organic phase volume was 1.18. Table 1 provides the results of these experiments.
| Aqueous phase | C aqTBHP | ϕ MOH | Organic phase | AO | C org,eqTBHP+MTBP |
|---|---|---|---|---|---|
| TBHP + NaOH solution | 2.00 | 1.15 | Ethyl hexanoate | 1.18 | 0.58 ± 0.04 |
| TBHP + KOH solution | 2.00 | 1.15 | Ethyl hexanoate | 1.18 | 0.61 ± 0.04 |
It is apparent from these results that a large amount of TBHP and/or MTBP is present in the organic phase at equilibrium. Unfortunately, the analytical method cannot differentiate between TBHP and MTBP, but it is believed that the amount of MTBP is very low compared to that of the protonated form. TBHP has a high solubility in organic compounds, as proved by the availability of commercial solutions of 5.0–6.0 M TBHP in decane. On the other hand, NaTBP and KTBP are salts which prefer to stay in the aqueous phase. This assumption is corroborated by the fact that a very similar compound, potassium tert-butoxide, has a low solubility in apolar organic solvents: 0.27 wt% in hexane, 2.27 wt% in toluene and 4.34 wt% in ether at 298 K.27 Even if the concentration of KTBP in the organic phase is higher than the concentration of NaTBP, it cannot be seen from this experiment because the amounts are very low compared to the amount of TBHP.
Another reason for the higher reactivity of KTBP might be the higher activity of the peroxide ion.22 K+ is bigger than Na+ and this translates to a longer interionic distance in the ion pair KTBP. The longer distance decreases the activation energy of the ion pair, making it more reactive.
The reaction was carried out in three capillaries with the same length and different IDcap: 0.50 × 10⁻³ m, 0.75 × 10⁻³ m and 1.00 × 10⁻³ m. The results are compared in Fig. 5. The measured values of a are provided in the figure caption.
As expected, the peroxyester yield increased with interfacial area, while the hydrolysis rate was not influenced. At τ = 750 s, YTBPEH goes from 6% in the capillary with IDcap = 1.00 × 10⁻³ m to 11% in the capillary with IDcap = 0.50 × 10⁻³.
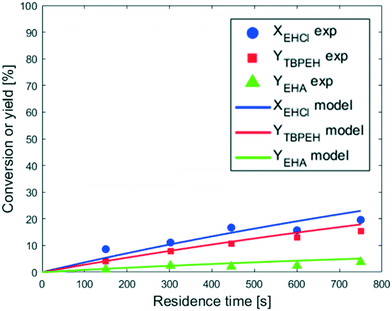
The peroxyesterification yield obtained in Fig. 6 is greater than that shown in Fig. 4(a). This yield increase is not only a direct consequence of the more concentrated reactants but is also due to a higher liquid–liquid interfacial area. Since the EHCl concentration was increased more than the TBHP one, a greater AO ratio was needed to keep the same ϕTBHP = 1.1, leading to an increase of the liquid–liquid interfacial area. Also, the hydrolysis appears to be slightly accelerated by the higher concentration of reactants, but not as much as the peroxyesterification.
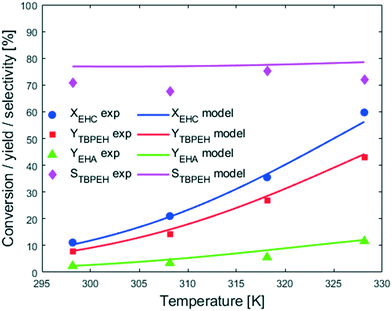
Fig. 7 shows that an increase in temperature leads to higher peroxyesterification and hydrolysis rates. The selectivity is not affected by temperature, meaning that both reactions are accelerated the same amount and would be convenient to work at higher temperature to increase the productivity. However, a yield of EHA of 10% obtained at XEHCl = 60% is unacceptable for the industrial process and it is necessary to find solutions to suppress the hydrolysis.
3.2. Kinetic study with phase-transfer catalysts
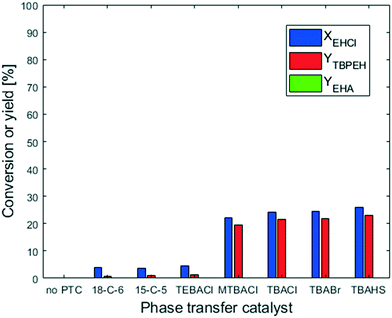
The peroxyesterification between EHCl and TBHP is a slow reaction. We observed a significant effect of the counter-ion of the base: KOH shows a higher reaction rate than NaOH because of its higher charge distribution. An even better result is therefore expected with the addition of a phase-transfer catalyst (PTC). In the following section all the results obtained with PTC are reported.The two crown ethers 18-C-6 and 15-C-5 were chosen because of their known ability to transfer ion pairs containing Na+ and K+, respectively, from the aqueous phase to the organic one.23 However, they had no influence on the peroxyesterification rate. The other PTCs investigated were quaternary ammonium salts with different substituents on the cation and/or different counter-anions. Among them, TEBACl was the most polar because of its smaller organic substituents. Due to its high polarity, TEBACl had very little effect. On the other hand, the less polar ammonium salts had a huge influence on the reaction rate, with a peroxyester yield of 20% in 20 s of residence time. Without PTC, almost no product was formed after 20 s. MTBACl performed slightly worse than the tetrabutylammonium salts, probably because of its slightly higher polarity due to the substitution of a butyl group with a methyl moiety. The anion associated with the tetrabutylammonium cation (Cl−, Br− or HSO4−) did not affect the catalytic activity. The hydrolysis was not influenced by the PTC. As can be seen from Fig. 8, almost no EHA was produced and the TBPEH selectivity is very high. Based on the results of the PTC screening it was decided to use TBACl for further experiments.
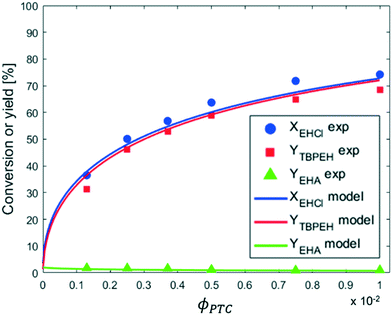
From the observation of Fig. 9 it can be seen that the reaction rate increases with the PTC amount but seems to level off at higher PTC concentrations.
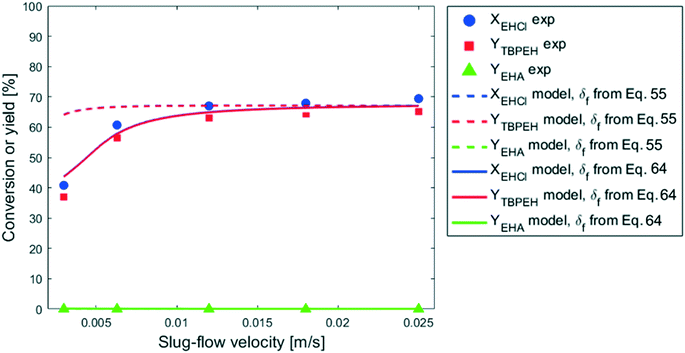
It is interesting to observe that, especially for the two capillaries with IDcap = 1.00 × 10⁻³ m and IDcap = 0.75 × 10⁻³, YTBPEH increases very slowly or not at all for residence times higher than 30 s. Since the residence time was increased by lowering the total liquid flowrate, the velocity decreased with it and this could be the cause for the reaction deceleration. This hypothesis was verified by carrying out the reaction at different slug-flow velocities while keeping the residence time constant by changing the capillary length. It was verified a priori that in the velocity range investigated, the slug-flow was always regular and its geometry, including the interfacial area, did not change. The results are shown in Fig. 11.
In the 0 m s−1 < v < 1 × 10⁻² m s−1 region, the peroxyester yield decreases with the decrease in slug-flow velocity, while v does not have any effect above 1 × 10⁻² m s−1. Since the mass-transfer coefficient increases with the velocity for heterogeneous reactions in capillary microreactors,28,31 one could argue that mass-transfer limitations are present until v = 1 × 10⁻² m s−1, and thereafter the peroxyesterification is in the full kinetic regime. If this was the case it would be difficult to explain the results in Fig. 10. For all the plots of this figure, a slug-flow velocity of v = 1.25 × 10⁻² m s−1 and v = 2.50 × 10⁻² m s−1 corresponds to the residence times of 20 s and 30 s, respectively. The reaction should then be in the kinetic regime and the conversion and yield the same for all the plots, even if the interfacial area is different, but this is not the case. This proves that the reaction is not affected by the slug-flow velocity as a consequence of mass-transfer limitations.
3.3. Discussion
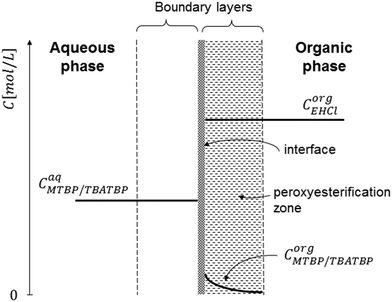
To explain the experimental results, the following kinetic mechanism was proposed. It assumes that the peroxyesterification takes place only in the organic phase boundary layer after the mass transfer of MTBP into it and no reaction occurs in the organic phase bulk. It is also assumed that the mass transfer of MTBP from the aqueous phase bulk to the liquid–liquid interface is an order of magnitude faster than the kinetic rate and thus negligible, and that the concentration of EHCl does not drop appreciably in the organic phase boundary layer. The schemes of the reaction mechanism and the concentration profiles of MTBP and EHCl are shown in Fig. 12 and 13.The resulting peroxyesterification rate for this mechanism is:32
 | (5) |
The PTC additionally affects the anion activity.24 Na+, K+ and the triethylbenzylammonium cation from TEBACl are accessible cations with a strong electrostatic bond with the anion. In quaternary ammonium cations with longer alkyl chains, such as MTBACl and TBACl, the positive charge is more shielded by the bulky organic substituents and less accessible to the anion, leading to an increase of the intrinsic reaction rate.
The proposed peroxyesterification mechanism agrees well with the experimental results because the mass transfer does not influence the overall reaction rate of eqn (5) and (28), while the peroxyesterification rate is still directly proportional to the interfacial area.
The effect of slug-flow velocity shown in Fig. 11 is explained by the phenomenon of film depletion.33 In the slug-flow regime, a thin liquid film of continuous phase is present between the dispersed phase droplets and the capillary inner wall. This film has a major contribution to the liquid–liquid interfacial area. The thickness and the length of the film can vary depending on the physical properties of the system and the capillary geometry. The thickness is usually in the range of 2–35% of IDcap.34 Since the film in our case is very thin and close to the capillary wall, it can be considered effectively stagnant. If the film is very thin and the reaction is fast, part of or all the reactants in the film are consumed before the film is refreshed. Consequently, only part of the interfacial area in the film contributes to the reaction and the conversion is limited by the amount of chemicals in the film. The extent of film depletion depends on the film contact time with the droplet. The higher Lf and the lower v, the higher the contact time and the film depletion. This explains the effect of the slug-flow velocity observed in Fig. 10 and 11. In the experiment presented in Fig. 9, the slug-flow velocity was equal to v = 2 × 10⁻² m s−1 for all the experimental points, meaning that there was no effect of this parameter on the reaction rate because it was outside the range in which the film depletion occurs. Also, for all the reactions carried out without PTC, no effect of the slug-flow velocity on the reaction rate is present. The reason is that the non-catalyzed peroxyesterification is much slower and the film depletion does not occur at any velocity tested.
Concerning the acid chloride hydrolysis, it was shown that this reaction is only influenced by the temperature and acid chloride concentration, suggesting a bulk reaction in the kinetic regime in which the acid chloride and/or the water and base migrate to the other liquid phase, where the hydrolysis takes place. The reason behind the slow hydrolysis is the very low solubility of EHCl in the aqueous phase, and water and the base in the organic phase. In Fig. 12, the EHCl hydrolysis with water and base is assumed to take place in the bulk of the aqueous phase only for simplicity. However, it could also occur in the organic phase after the migration of the water and/or the base.
4. Reactor model
With the experimental information acquired, it was possible to develop a kinetic model for the Schotten–Baumann peroxyesterification between EHCl and TBHP in the capillary microreactor, with and without PTC. Since TBACl was used for most of the experiments, this PTC will be considered in the model description.The model is based on the kinetic mechanism explained in the previous paragraph. The assumptions made are:
(a) total liquid flowrate in the microreactor does not change during the reaction;
(b) acid chloride hydrolysis is a bulk reaction under full kinetic regime, assumed to take place in the aqueous phase;
(c) acid chloride hydrolysis with water is neglected because it is much slower than the hydrolysis with the base, given the high pH of the aqueous phase;35
(d) TBHP is distributed between the aqueous and the organic phase;
(e) TBHP is deprotonated by the base in the bulk of the aqueous phase;
(f) when TBACl is present, MTBP undergoes an ion exchange with it in the bulk of the aqueous phase to form TBATBP;
(g) partial equilibrium assumption is considered for points (d)–(f);
(h) peroxyesterification only takes place in the boundary layer of the organic phase;
(i) the concentration of EHCl does not drop significantly in the organic phase boundary layer;
(j) the physical properties of the organic and aqueous phase do not change during the reaction.
The reactions considered in the model are listed below.
Partition of TBHP between aqueous and organic phase:
 | (6) |
| Rp,TBHP = kp,TBHPCaqTBHP | (7) |
| Rp−1,TBHP = kp−1,TBHPCorgTBHP | (8) |
 | (9) |
| Rd = kdCaqTBHPCaqMOH | (10) |
| Rd−1 = kd−1CaqMTBP | (11) |
 | (12) |
| Rie = kieCaqMTBPCaqTBACl | (13) |
| Rie−1 = kie−1CaqTBATBPCaqMCl | (14) |
| kp−1,TBHP = kp,TBHP/Keqp,TBHP | (15) |
| kd−1 = kd/Keqd | (16) |
| kie−1 = kie/Keqie | (17) |
| Keqd = 10−pKa,TBHP/10−pKw | (18) |
Since TBHP and MTBP are present in the aqueous phase, both the TBHP partition and the deprotonation equilibria have to be considered simultaneously to estimate the value of Keqp. This was done by setting up a system of equations containing the TBHP and MOH mole balances, TBHP partition equilibria and TBHP deprotonation equilibria:
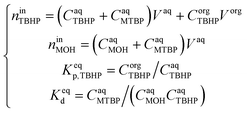 | (19) |
K eqie was fitted to the experimental data. To satisfy the partial equilibrium assumption, kp,TBHP, kd and kie were set very high, all equal to 1 × 10³.
Partition of MTBP between the aqueous and the organic phase:
 | (20) |
| Rp,MTBP = kp,MTBPCaqMTBP | (21) |
| Rp−1,MTBP = kp−1,MTBPCorgMTBP | (22) |
 | (23) |
| Rp,TBATBP = kp,TBATBPCaqTBATBP | (24) |
| Rp−1,TBATBP = kp−1,TBATBPCorgTBATBP | (25) |
 | (26) |
 | (5) |
 | (27) |
 | (28) |
| Keqp,MTBP = CorgMTBP/CaqMTBP | (29) |
| Keqp,TBATBP = CorgTBATBP/CaqTBATBP | (30) |
 and
and  .
.
EHCl alkaline hydrolysis:
 | (31) |
 | (32) |
| CaqEHCl = CorgEHCl/Keqp,EHCl | (33) |
 of eqn (32) is a combination of the true kinetic constant kHB and the partition coefficient:
 | (34) |
Neutralization of the EHA with the base:
 | (35) |
| Rn = knCaqMOHCaqEHA | (36) |
 | (37) |
 | (38) |
 | (39) |
 ,
,  ,
,  ,
,  ,
,  and
and  .
.
To take the phenomenon of film depletion into account, a new modeling approach was used. The computational domain considered was the unit cell shown in yellow and light blue in Fig. 14.
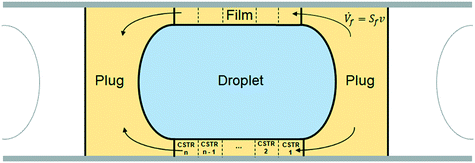 | ||
| Fig. 14 Schematic representation of the unit cell: the computational domain used for the kinetic model. | ||
The volume of the domain was divided into three main parts, as shown in Fig. 14:
• aqueous phase droplet (light blue);
• organic phase film (yellow), consisting of the hollow cylinder around the droplet;
• organic phase plug (yellow), consisting of the total volume of organic phase minus the film volume around the droplet.
It is assumed that the unit cell moves along the capillary at the slug-flow velocity v. The mole balances of each element of fluid of the unit cell can thus be integrated from time 0 to the desired residence time used for the experiments. To represent the fact that in reality the film is stagnant and the droplet slides along it at the velocity v, as discussed in section 3.3, an internal flow going across the film from the right side of the plug to the left side is introduced and shown in Fig. 14.
The aqueous phase droplet was regarded as a perfectly mixed batch reactor where the hydrolysis of EHCl occurs. The plug, consisting of both left and right parts, was considered a perfectly mixed CSTR with an outflow entering the organic film and an inflow coming from the organic film. The film was assumed a PFR with an inflow from the right plug part and an outflow to the left plug part. The volumetric inflow, equal to the outflow, is equal to the product of the slug-flow velocity and the area of the film cross section. The peroxyesterification takes place in both the plug and the film in the boundary layer close to the liquid–liquid interface. The droplet and the plug are approximated as ideally mixed reactors because of the strong recirculation patterns present in them. To represent the film as a PFR in the model, it was divided into n = 20 CSTRs of equal volume.
The compounds, their concentrations and reaction rates vary in each part of the unit cell. To distinguish them, a superscript indicating the unit cell zone is used. The superscript fi stands for CSTR number i of the film (with i = 1, …, 20), ftot for the entire film, p for plug, d for droplet, c for caps and uc for the entire unit cell.
The mole balances of the kinetic model are reported below. TBPEH and EHCl are present only in the organic phase, consisting of the film and the plug. The mole balance of EHCl in the aqueous phase is neglected because of its very low solubility. TBHP is distributed between the two phases and all the other components are present only in the aqueous phase droplet.
The mole balances of EHCl, TBPEH and TBHP in each CSTR of the film are:
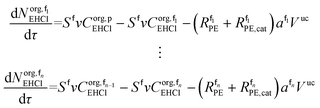 | (40) |
 | (41) |
 | (42) |
 | (43) |
 | (44) |
 | (45) |
Mole balances of TBHP and the remaining species in the aqueous phase droplet:
 | (46) |
 | (47) |
 | (48) |
 | (49) |
 | (50) |
 | (51) |
 | (52) |
 | (53) |
 | (54) |
 | (55) |
The interfacial areas per unit of volume of the film, the caps and the unit cell were calculated as follows:
| af,tot = 2π(Rcap − δf)Lf/Vuc | (56) |
| ac = 2π(Rcap2 − h2)/Vuc | (57) |
| a = ac + af,tot | (58) |
 | (59) |
 | (60) |
| Vf,tot = πδfLf(2Rcap − δf) | (61) |
| afi = af,tot/n | (62) |
| Vfi = Vf,tot/n | (63) |
4.1. Results and discussion
At first, the parameters and
and  were fitted using the experimental results depicted in Fig. 4a. Those experiments used NaOH as base without the addition of PTC. Since the reaction was carried out at a constant temperature of 25 °C it was not possible to determine the Arrhenius parameters for the peroxyesterification and the hydrolysis. The kinetic constants
  and
and  at T = 25 °C were fitted directly. Using these values as initial starting point, the results at every single temperature of Fig. 7 were fitted separately to obtain
  and
and  at each experimental temperature. These values were used to build two Arrhenius plots, one for the peroxyesterification and one for the hydrolysis, and determine
  ,
,  ,
,  , and
, and  . To increase the accuracy, the parameters determined from the Arrhenius plots were used as starting points to fit the experimental points of Fig. 7 together. The fit is shown in the same figure and the values of the fitted parameters are listed in Table 2.
The results shown in Fig. 5 and 6 were predicted using the model and the determined parameters. The predictions are reported in the same figures as continuous lines.
The remaining parameters of Table 2, Keqie and  , needed when a PTC is present, were fitted using the results shown in Fig. 9, showing conversion and yield for different TBACl amounts. Due to lack of experimental data at different temperatures for the phase-transfer catalyzed reaction, it was not possible to determine the Arrhenius parameters of the peroxyesterification. Hence
  was fitted at 25 °C. The fitting is also depicted in Fig. 9. As discussed in section 3.2.3, the slug-flow velocity does not influence the reaction rate in the experiments reported in Fig. 4–9. This is either because the reaction rate is too low or because the slug-flow velocity is not low enough. On the other hand, in the experiments reported in Fig. 10 and 11, the slug-flow velocity has an impact on the peroxyesterification rate.
The experiment reported in Fig. 11 was modelled using the kinetic parameters previously fitted. The result is represented by the dotted line in Fig. 11. While the data at higher velocities are predicted well, the model only shows a very slight decrease of reaction rate with a decrease of the slug-flow velocity. One possible explanation is that the film thickness calculated using the modified Taylor's Law of eqn (55) is higher than the actual film thickness. To verify this hypothesis, the numerical coefficient 1.34 of eqn (55) was treated as an unknown parameter and fitted to the experimental data of Fig. 11. The new equation for the film thickness with the fitted parameters is:
 | (64) |
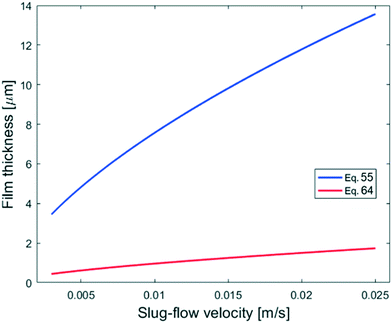 | ||
| Fig. 15 Comparison of the calculated film thicknesses obtained with eqn (55) and (64) based on the experimental conditions shown in Fig. 11. | ||
Another explanation for the mismatch between the model using eqn (55) and experimental data could be an inefficient film refreshment. Even if the film thickness is predicted well by the modified Taylor's law with the original parameters, the mixing inside the plug and/or the droplet at low slug-flow velocities could be not as good as expected, causing a poor refreshment of the film. If this was the case, it would be wrong to approximate the plug and the droplet as two perfectly mixed stirred tanks at every slug-flow velocity.
To model the data shown in Fig. 10, film thicknesses were calculated using eqn (64). The match between the model and experimental data is very good for the capillaries with IDcap equal to 0.75 × 10⁻³ m and 1.00 × 10⁻³ m. For the smallest capillary used, IDcap = 0.50 × 10⁻³ m, the prediction is still good; however, there is a slight overestimation of conversion (X) and yield (Y).
The only experiment where KOH was used as the base is reported in Fig. 4b. No PTC was used. Conversion and yield were measured as a function of the residence time at a fixed temperature. Therefore, it was not possible to determine the Arrhenius parameters, only  . Since the hydrolysis is not affected by the base used, the previously fitted values of
  and
and  were used in the model. The fitted
  is reported in Table 3.
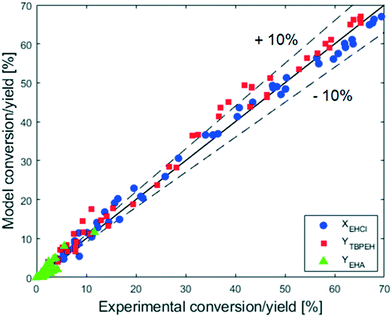
The adequacy of the model prediction can be seen from the parity plot showed in Fig. 16.
It can be observed that the scatter of the data around the parity line is uniform, meaning that it is caused by a random noise. The distance of the points from the parity line seems to be the same over the entire range of conversion and yield. The absolute error is thus constant, while the relative error decreases with the increase of X and Y. For X and Y greater than 20%, the relative error is small and most of the predicted values lie within ±10% of the experimental data. This behavior can be caused by the presence of a constant and random experimental error, which gives the same absolute deviation at every experimental X and Y value. To have a better fitting of the model parameter is thus advisable to use experiments for which the conversion and yields are higher than 20%. This criterion was met because the experimental data used for the fitting in this work are those showed in Fig. 7 and 9.
5. Conclusions
The biphasic Schotten–Baumann peroxyesterification between EHCl and TBHP was carried out in a continuous slug-flow microreactor. It was found that the peroxyesterification is not very fast, probably because of the low reactivity of EHCl due to its long alkyl chain and an ethyl group in the α position with respect to the carbonyl carbon that might cause a steric hindrance. The hydrolysis of the acid chloride is slower than the peroxyesterification. In view of the use of a continuous reactor for the industrial synthesis of TBPEH, it would be advisable to accelerate the peroxyesterification and limit the hydrolysis. It was found that increasing the temperature accelerates both reactions, which is unwanted. In order to increase the TBPEH formation only, three solutions have been identified: use of KOH instead of NaOH as base, increase in interfacial area and use of an appropriate phase transfer catalyst. The last had the biggest impact. The hydrolysis is not affected by the liquid–liquid interfacial area because it is probably in the kinetic regime and takes place in the bulk of one, or both, of the liquid phases. It was determined that the phase-transfer catalyzed peroxyesterification is affected by the slug-flow velocity for 0 < v < 1.2 × 10⁻² m s−1, even if the reaction rate is influenced by the interfacial area at any slug-flow velocity. This situation suggested a kinetic mechanism in which the peroxyesterification occurs only in the boundary layer of the organic phase and the concentrations of MTBP or TBATBP and EHCl do not drop in the boundary layers of the aqueous and organic phase, respectively, as represented in Fig. 12 and 13. The corresponding peroxyesterification rate expression is thus dependent on the specific interfacial area, but not on mass-transfer. The effect of flow velocity can be explained with the phenomenon of the film depletion, which occurs only when the peroxyesterification is very fast and the slug-flow velocity is low.The higher reaction rate with KOH can be explained by the higher solubility of KTBP with respect to NaTBP. Another explanation could be that the tert-butyl peroxide anion is more activated in KTBP thanks to the lower interaction with the bigger K+ cation. The same phenomenon can also explain the effect of the phase transfer catalyst. Thanks to the large organic part of the PTC cation, the tert-butyl peroxide anions linked to them are more soluble in the organic phase and probably also more activated.
The kinetic model was implemented in Matlab® and its parameters fitted to the experimental results. The film depletion was taken into account in the model. The use of the original modified Taylor's law to estimate the film thickness did not show a dependence on the slug-flow velocity. However, by modifying the equation in order to get a thinner film, the effect of the slug-flow velocity could be represented well by the model. This indicates that either the original modified Taylor's law is not applicable for the system studied or that the film refreshment is not efficient at low velocities. The calculated values obtained with the model match the experimental data quite well and most of the calculated values lie within ±10% of the corresponding experimental data.
This work provides a deeper understanding of the kinetics of the Schotten–Baumann synthesis of tert-butyl peroxy-2-ethylhexanoate and shows the effect of different operating parameters on the peroxyesterification and hydrolysis rates. Together with the proposed kinetic model, the synthesis of TBPEH and similar compounds can be optimized. Furthermore, the findings presented and the methodology can be generalized for the Schotten–Baumann synthesis of other compounds.
Nomenclature
Latin symbols
| IDcap | Inner capillary diameter, m |
| R cap | Inner capillary radius, m |
| ODcap | Outer capillary diameter, m |
| L cap | Capillary length, m |
| AO | Aqueous to organic phase volumetric flowrate ratio, VaqVorg−1, — |
| C | Concentration, mol L−1 |
| V | Volume, L |
| N | Moles, mol |
| Ṅ | Molar flowrate, mol s−1 |
| L p | Length of the organic phase plug, m |
| L f | Length of the organic phase film, m |
| h | Radius of the aqueous phase droplet caps, m |
| T | Temperature, K |
| a | Interfacial area per unit of reactor volume, m2 LR−1 |
| X | Conversion, — |
| Y | Yield, — |
| S | Selectivity, — |
| S f | Film cross section, dm2 |
| v | Slug-flow velocity, dm s−1 |
| R | Reaction rate, mol L−1 s−1 |
| D | Diffusion coefficient, m2 s−1 |
| Ca | Capillary number, μorgvσ−1, — |
Greek symbols
| ϕ TBHP | Molar flow ratio of TBHP over EHCl, Ṅaq,inTBHPṄaq,inEHCl−1, — |
| ϕ MOH | Molar flow ratio of MOH over TBHP, Caq,inMOHCaq,inTBHP−1, — |
| ϕ PTC | Molar flow ratio of PTC over TBHP, Caq,inPTCCaq,inTBHP−1, — |
| τ | Residence time, s |
| ρ | Molar density, mol L−1 |
| δ f | Film thickness, m |
Abbreviations
| EHCl | 2-Ethylhexanoyl chloride |
| TBHP | tert-Butyl hydroperoxide |
| TBPEH | tert-Butyl peroxy-2-ethylhexanoate |
| EHA | 2-Ethylhexanoic acid |
| MEH | Sodium or potassium 2-ethylhexanoate |
| NaTBP | Sodium tert-butyl peroxide |
| KTBP | Potassium tert-butyl peroxide |
| MTBP | NaTBP or KTBP |
| MCl | NaCl or KCl |
| MOH | NaOH or KOH |
| PTC | Phase-transfer catalyst |
| IDD | Isododecane |
| 15-C-5 | 15-Crown-5 |
| 18-C-6 | 18-Crown-6 |
| TBACl | Tetrabutylammonium chloride |
| TBABr | Tetrabutylammonium bromide |
| TBAHS | Tetrabutylammonium hydrogen sulfate |
| MTBAC | Methyl tributyl ammonium chloride |
| TEBACl | Benzyltriethylammonium chloride |
| exp | Experimental |
| TBATBP | Tetrabutylammonium tert-butyl peroxide |
| CSTR | Continuous stirred tank reactor |
| PFR | Plug-flow reactor |
Superscripts
| aq | Relative to the aqueous phase |
| org | Relative to the organic phase |
| in | At the reaction capillary inlet |
| out | At the reaction capillary outlet |
| eq | At equilibrium |
Subscripts
| R | Reactor |
Conflicts of interest
There are no conflicts to declare.Acknowledgements
This research was carried out within the HighSinc program – a joint development between Nouryon Specialty Chemicals and the Department of Chemical Engineering and Chemistry at Eindhoven University of Technology.References
- J. Sanchez and T. N. Myers, in Kirk-Othmer Encyclopedia of Chemical Technology, John Wiley & Sons, Inc., Hoboken, NJ, USA, 2000 Search PubMed.
- A. Uhl, M. Bitzer, H. Wolf, D. Hermann, S. Gutewort, M. Völkl and I. Nagl, in Ullmann's Encyclopedia of Industrial Chemistry, Wiley-VCH Verlag GmbH & Co. KGaA, Weinheim, Germany, 2018, pp. 1–45 Search PubMed.
- Z. Wang, Comprehensive Organic Name Reactions and Reagents, John Wiley & Sons, Inc., Hoboken, NJ, USA, 2009, pp. 2536–2539 Search PubMed.
- H. Yang and C. Huang, Kinetics for benzoylation of sodium phenoxide by liquid – liquid phase-transfer catalysis, Appl. Catal., A, 2006, 299, 258–265 Search PubMed.
- S. Baj, A. Chrobok and I. Gottwald, Application of solid-liquid phase transfer catalysis system for peroxyester synthesis: A kinetic study of hydroperoxides acylation in the presence of solid sodium carbonate, Appl. Catal., A, 2002, 224, 89–95 Search PubMed.
- C.-Y. Wang, D.-C. Wang, W.-Y. Chiu and L.-W. Chen, Study on the kinetics of interfacial polycondensation for polyarylate, Angew. Makromol. Chem., 1997, 248, 123–137 Search PubMed.
- C. C. Wamser and J. A. Yates, Kinetics and mechanisms for the two-phase reaction between aqueous aniline and benzoyl chloride in chloroform, with and without pyridine catalysis, J. Org. Chem., 1989, 54, 150–154 Search PubMed.
- M.-L. Wang, C.-C. Ou and J.-J. Jwo, Effect of the Organic Solvents on the Pyridine 1-Oxide-Catalyzed Reaction of Benzoyl Chloride and Acetate Ion in a Two-Phase Medium, Ind. Eng. Chem. Res., 1994, 33, 2034–2039 Search PubMed.
- C. S. Kuo and J. J. Jwo, Inverse Phase Transfer Catalysis. Kinetics and Mechanism of the Pyridine 1-Oxide-Catalyzed Substitution Reaction of Benzoyl Chloride and Benzoate Ion, J. Org. Chem., 1995, 1991–1995 Search PubMed.
- W. K. Fife and Y. Xin, Inverse phase-transfer catalysis: probing its mechanism with competitive transacylation, J. Am. Chem. Soc., 1987, 109, 1278–1279 Search PubMed.
- M. Tsuda, Schotten-baumann esterification of poly(vinyl alcohol). I, Die Makromolekulare Chemie, 1964, 72, 174–182 Search PubMed.
- H.-B. Tsai and Y.-D. Lee, Polyarylates. III. Kinetic studies of interfacial polycondensation, J. Polym. Sci., Part A: Polym. Chem., 1987, 25, 2195–2206 Search PubMed.
- J.-M. Corpart, S. Grimaldi, G. Martino-Gauchi and P. Maj, US Pat., 8088942B2, 2012 Search PubMed.
- U. D. Wagle and V. Ramdas, US Pat., 4075236B1, 1978 Search PubMed.
- A. Ufer, M. Mendorf, A. Ghaini and D. W. Agar, Liquid/Liquid Slug Flow Capillary Microreactor, Chem. Eng. Technol., 2011, 34, 353–360 Search PubMed.
- T. Illg, V. Hessel, P. Löb and J. C. Schouten, Novel Process Window for the safe and continuous synthesis of tert.-butyl peroxy pivalate in a micro-reactor, Chem. Eng. J., 2011, 167, 504–509 Search PubMed.
- T. Illg, V. Hessel, P. Lçb and J. C. Schouten, Continuous synthesis of tert-butyl peroxypivalate using a single-channel microreactor equipped with orifices as emulsification units, ChemSusChem, 2011, 4, 392–398 Search PubMed.
- T. Illg, V. Hessel, P. Löb and J. C. Schouten, Orifice microreactor for the production of an organic peroxide – non-reactive and reactive characterization, Green Chem., 2012, 14, 1420 Search PubMed.
- L. Fritzsche and A. Knorr, Transformation of the 2nd step of a peroxyester synthesis from semi-batch to continuous mode, Chem. Eng. Process., 2013, 70, 217–221 Search PubMed.
- L. Fritzsche and A. Knorr, Continuous synthesis of a high energetic substance using small scale reactors, Chem. Eng. Trans., 2013, 32, 685–690 Search PubMed.
- T. Illg, A. Knorr and L. Fritzsche, Microreactors—A Powerful Tool to Synthesize Peroxycarboxylic Esters, Molecules, 2015, 21, 5 Search PubMed.
- C. M. Starks, C. L. Liotta and M. E. Halpern, in Phase-Transfer Catalysis, SpringerNetherlands, Dordrecht, 1994, pp. 1–22 Search PubMed.
- C. M. Starks, C. L. Liotta and M. E. Halpern, in Phase-Transfer Catalysis, SpringerNetherlands, Dordrecht, 1994, pp. 123–206 Search PubMed.
- C. M. Starks, C. L. Liotta and M. E. Halpern, in Phase-Transfer Catalysis, SpringerNetherlands, Dordrecht, 1994, pp. 266–338 Search PubMed.
- N. A. Milas and D. M. Surgenor, Studies in Organic Peroxides. IX. t-Butyl Peresters, J. Am. Chem. Soc., 1946, 68, 642–643 Search PubMed.
- C. M. Starks, C. L. Liotta and M. E. Halpern, in Phase-Transfer Catalysis, SpringerNetherlands, Dordrecht, 1994, pp. 266–338 Search PubMed.
- D. Caine, in Encyclopedia of Reagents for Organic Synthesis, John Wiley & Sons, Ltd, 2006 Search PubMed.
- A. Ghaini, M. N. Kashid and D. W. Agar, Effective interfacial area for mass transfer in the liquid-liquid slug flow capillary microreactors, Chem. Eng. Process., 2010, 49, 358–366 Search PubMed.
- M. N. Kashid and D. W. Agar, Hydrodynamics of liquid-liquid slug flow capillary microreactor: Flow regimes, slug size and pressure drop, Chem. Eng. J., 2007, 131, 1–13 Search PubMed.
- N. Zohari, M. H. Keshavarz and Z. Dalaei, Prediction of decomposition onset temperature and heat of decomposition of organic peroxides using simple approaches, J. Therm. Anal. Calorim., 2016, 125, 887–896 Search PubMed.
- N. Di, M. Raimondi, L. Prat, C. Gourdon and P. Cognet, Direct numerical simulations of mass transfer in square microchannels for liquid – liquid slug flow, J, 2008, 63, 5522–5530 Search PubMed.
- O. Levenspiel, in Chemical Reaction Engineering, John Wiley & Sons, Inc., New York, 3rd edn, 1999, pp. 523–539 Search PubMed.
- M. N. Kashid, A. Renken and L. Kiwi-minsker, Gas – liquid and liquid – liquid mass transfer in microstructured reactors, Chem. Eng. Sci., 2011, 66, 3876–3897 Search PubMed.
- M. M. G. Eain, V. Egan and J. Punch, Film thickness measurements in liquid–liquid slug flow regimes, Int. J. Heat Fluid Flow, 2013, 44, 515–523 Search PubMed.
- W. Mabey and T. Mill, Critical review of hydrolysis of organic compounds in water under environmental conditions, J. Phys. Chem. Ref. Data, 1978, 7, 383–415 Search PubMed.
| This journal is © The Royal Society of Chemistry 2021 |

