 Open Access Article
Creative Commons Attribution 3.0 Unported Licence
Fluorescent probe for the imaging of superoxide and peroxynitrite during drug-induced liver injury†
Luling
Wu‡
 ab,
Jihong
Liu‡
ab,
Xue
Tian
ab,
Jihong
Liu‡
ab,
Xue
Tian
 b,
Robin R.
Groleau
 b,
Steven D.
Bull
 b,
Ping
Li
 *a,
Bo
Tang
 *a and
Tony D.
James
 *abc
*abc
aCollege of Chemistry, Chemical Engineering and Materials Science, Key Laboratory of Molecular and Nano Probes, Ministry of Education, Collaborative Innovation Center of Functionalized Probes for Chemical Imaging in Universities of Shandong, Institutes of Biomedical Sciences, Shandong Normal University, Jinan 250014, People's Republic of China. E-mail: lip@sdnu.edu.cn; tangb@sdnu.edu.cn
bDepartment of Chemistry, University of Bath, Bath, BA2 7AY, UK. E-mail: t.d.james@bath.ac.uk
cSchool of Chemistry and Chemical Engineering, Henan Normal University, Xinxiang 453007, P. R. China
First published on 4th January 2021
Abstract
Drug-induced liver injury (DILI) is an important cause of potentially fatal liver disease. Herein, we report the development of a molecular probe (LW-OTf) for the detection and imaging of two biomarkers involved in DILI. Initially, primary reactive oxygen species (ROS) superoxide (O2˙−) selectively activates a near-infrared fluorescence (NIRF) output by generating fluorophore LW-OH. The C![[double bond, length as m-dash]](https://www.rsc.org/images/entities/char_e001.gif) C linker of this hemicyanine fluorophore is subsequently oxidized by reactive nitrogen species (RNS) peroxynitrite (ONOO−), resulting in cleavage to release xanthene derivative LW-XTD, detected using two-photon excitation fluorescence (TPEF). An alternative fluorescence pathway can occur through cleavage of LW-OTf by ONOO− to non-fluorescent LW-XTD-OTf, which can react further with the second analyte O2˙− to produce the same LW-XTD fluorescent species. By combining NIRF and TPEF, LW-OTf is capable of differential and simultaneous detection of ROS and RNS in DILI using two optically orthogonal channels. Probe LW-OTf could be used to detect O2˙− or O2˙− and ONOO− in lysosomes stimulated by 2-methoxyestradiol (2-ME) or 2-ME and SIN-1 respectively. In addition, we were able to monitor the chemoprotective effects of tert-butylhydroxyanisole (BHA) against acetaminophen (APAP) toxicity in living HL-7702 cells. More importantly, TPEF and NIRF imaging confirmed an increase in levels of both O2˙− and ONOO− in mouse livers during APAP-induced DILI (confirmed by hematoxylin and eosin (H&E) staining).
C linker of this hemicyanine fluorophore is subsequently oxidized by reactive nitrogen species (RNS) peroxynitrite (ONOO−), resulting in cleavage to release xanthene derivative LW-XTD, detected using two-photon excitation fluorescence (TPEF). An alternative fluorescence pathway can occur through cleavage of LW-OTf by ONOO− to non-fluorescent LW-XTD-OTf, which can react further with the second analyte O2˙− to produce the same LW-XTD fluorescent species. By combining NIRF and TPEF, LW-OTf is capable of differential and simultaneous detection of ROS and RNS in DILI using two optically orthogonal channels. Probe LW-OTf could be used to detect O2˙− or O2˙− and ONOO− in lysosomes stimulated by 2-methoxyestradiol (2-ME) or 2-ME and SIN-1 respectively. In addition, we were able to monitor the chemoprotective effects of tert-butylhydroxyanisole (BHA) against acetaminophen (APAP) toxicity in living HL-7702 cells. More importantly, TPEF and NIRF imaging confirmed an increase in levels of both O2˙− and ONOO− in mouse livers during APAP-induced DILI (confirmed by hematoxylin and eosin (H&E) staining).
Introduction
Drug-induced liver injury (DILI) is a leading cause of acute liver failure in the USA and Europe, and has as such raised serious concerns for public health.1–3 The potential to induce DILI is also one of the most common causes of compound attrition in drug development, often leading to drug withdrawals, restrictions, and project termination.3 Minimizing hepatotoxicity is therefore crucial, requiring effective techniques for preclinical screening of DILI.4,5 Unfortunately, probes capable of imaging DILI in living animals remain limited,6–8 making the development of methods for accurate diagnosis vital for improving the treatment of DILI.9–11A common cause of DILI is overdose of acetaminophen (APAP), causing oxidative and nitrosative stress through elevated levels of reactive oxygen species (ROS) and reactive nitrogen species (RNS). Metabolism of APAP in the liver proceeds via transformation into a toxic metabolite, N-acetyl-p-benzoquinone imine (NAPQI).12 APAP hepatotoxicity is known to arise from the interference of NAPQI with complex I/II of the mitochondrial electron transport chain (ETC), resulting in the leakage of electrons from the ETC to oxygen which induces superoxide (O2˙−) formation.13,14 O2˙− is then converted into hydrogen peroxide (H2O2) and oxygen (O2) by manganese superoxide dismutase, leading to additional oxidative stress. In addition, O2˙− can react with endogenous nitric oxide (NO) to generate RNS peroxynitrite (ONOO−).15 Considering these ROS and RNS are products of different pathways, and exhibit different biological effects, their simultaneous detection could improve our understanding of the in vivo mode of action in DILI.8,16–18
Fluorescence imaging is commonly used as a non-invasive method to image and measure these types of analytes with high temporal and spatial resolution suitable for diagnostic applications in living organisms.19 Improvements to fluorescent methods can be made by using near-infrared fluorescence (NIRF, 650–900 nm), which benefits from minimized auto-fluorescence of endogenous biomolecules and reduced light scattering in tissues.20–22 While a number of NIRF-based probes have been used for the detection of O2˙−,23–28 none have yet been used to evaluate changes in O2˙− in DILI. Further improvements to biological fluorescence imaging can be achieved with the use of two-photon excitation fluorescence (TPEF), which brings unique benefits such as increased spatial resolution and enhanced penetration depths.29,30 Nevertheless, such probes capable of two-photon excitation suitable for investigating the role of ONOO− in DILI are still rare.7
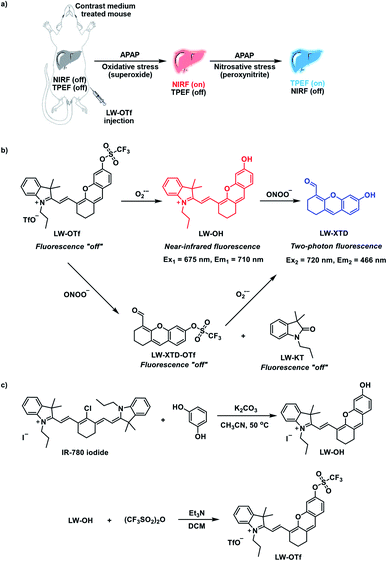
Our groups' research interests lie in developing new fluorescent probes for the detection and imaging of ROS and RNS, with a recent focus on dual-response probes.30–34 Carrying on this work, fluorescent probe LW-OTf was designed and synthesized with the intention imaging of DILI. O2˙−, a primary ROS, and ONOO−, a prominent RNS, were chosen as pertinent DILI-related biomarkers for this study. To the best of our knowledge, LW-OTf represents the first reaction-based small-molecule fluorescent probe having NIRF and TPEF capabilities with two independent optical channels: NIRF for O2˙− and TPEF for ONOO− (Scheme 1a and b).
The synthesis of LW-OTf was carried out over two steps (Scheme 1c and S3†). Hemicyanine-based fluorophore LW-OH was first prepared by retro-Knoevenagel reaction35 followed by addition of a O2˙−-reactive trifluoromethylsulfonyl unit (triflyl, Tf) to afford LW-OTf![[thin space (1/6-em)]](https://www.rsc.org/images/entities/char_2009.gif) 36,37 (for further discussion of the TfO− counteranion see the ESI†). In the presence of O2˙− triflyl deprotection occurs, which leads to an increased NIRF signal by generation of fluorophore LW-OH. Subsequent reaction with ONOO− results in oxidative cleavage of the alkene linker of LW-OH to generate xanthene derivative LW-XTD,38–40 capable of two-photon fluorescence (see ESI† for further discussion of hemicyanine-xanthene fluorescent turn-on mechanism and selectivity). An alternative fluorescence activation pathway can also occur, in which LW-OTf is first cleaved by ONOO− to produce non-fluorescent LW-XTD-OTf, which can subsequently react with superoxide to produce the same final xanthene derivative LW-XTD. Unfortunately, fluorescence experiments could not detect this second pathway, as generation of ONOO− requires an aqueous medium, which led to rapid decomposition of KO2-derived O2˙− in an assay setting, and so sequential addition of peroxyntrite then superoxide could not be carried out.41 This dual-response molecular design allows LW-OTf to produce either NIRF or TPEF signals in response to O2˙− and ONOO−, respectively (Scheme 1b).
36,37 (for further discussion of the TfO− counteranion see the ESI†). In the presence of O2˙− triflyl deprotection occurs, which leads to an increased NIRF signal by generation of fluorophore LW-OH. Subsequent reaction with ONOO− results in oxidative cleavage of the alkene linker of LW-OH to generate xanthene derivative LW-XTD,38–40 capable of two-photon fluorescence (see ESI† for further discussion of hemicyanine-xanthene fluorescent turn-on mechanism and selectivity). An alternative fluorescence activation pathway can also occur, in which LW-OTf is first cleaved by ONOO− to produce non-fluorescent LW-XTD-OTf, which can subsequently react with superoxide to produce the same final xanthene derivative LW-XTD. Unfortunately, fluorescence experiments could not detect this second pathway, as generation of ONOO− requires an aqueous medium, which led to rapid decomposition of KO2-derived O2˙− in an assay setting, and so sequential addition of peroxyntrite then superoxide could not be carried out.41 This dual-response molecular design allows LW-OTf to produce either NIRF or TPEF signals in response to O2˙− and ONOO−, respectively (Scheme 1b).
Results and discussion
With LW-OTf in hand, we first evaluated its optical properties. As shown in Fig. S1,†LW-OTf (10 μM, pH 7.4) exhibited absorption maxima at 546 and 576 nm, whilst for LW-OH (formed in situ by addition of O2˙−, 20 μM) those absorptions decreased, with a new maximum at 687 nm. Subsequent addition of ONOO− (17.5 μM) to the solution resulted in the emergence of a peak at 353 nm. These observations are in good agreement with the proposed mechanism for the sequential reaction of LW-OTf with O2˙− followed by ONOO− (Scheme 1). The fluorescence behavior (Fig. 1 and 2) of this sensing system was then evaluated. Initially, negligible fluorescence was observed, with incremental addition of O2˙− (0–25 μM) causing a continuous increase in emission intensity at 710 nm using excitation at 675 nm (Fig. 1a). Removal of the triflyl unit in the presence of O2˙− released fluorophore LW-OH, causing a 15.6-fold enhancement in fluorescence emission intensity. An excellent linear relationship between the emission intensity at 710 nm and the concentration of O2˙− over the 0–18 μM range was observed (linear equation: y1 = 3030 + 2068 × [O2˙−] (μM), R2 = 0.995, y1 is the intensity at 710 nm, Fig. 1b), and the detection limit was calculated to be 46.5 nM. The fluorescence behavior of LW-OTf in the presence of both O2˙− and ONOO− was then evaluated. Excitation at 360 nm was selected for one-photon fluorescence experiments, matching the observed maximum absorption for LW-XTD at 353 nm, as well as previous reports of this system.38LW-OTf initially exhibited a weak emission signal at 461 nm in the presence of O2˙−, however upon subsequent addition of ONOO− the D–π–A-based oxidation product LW-XTD exhibited a strong fluorescence emission at 461 nm, upon excitation at 360 nm (Fig. 2a). As the concentration of ONOO− was increased from 0 to 4.2 μM the fluorescence intensity at 461 nm gradually increased as well (linear equation: y2 = 5657 + 5074 × [ONOO−] (μM), R2 = 0.994, y2 is the intensity at 461 nm), with a detection limit for ONOO− of 38.2 nM (Fig. 2b). The use of two-photon microscopy, was first described by Webb et al. in 1990, and has since been adopted for bioimaging applications.42 Given that the excitation of a fluorophore using two-photon fluorescence is twice that of one-photon fluorescence, an excitation wavelength of 720 nm was chosen for two-photon measurements. LW-OTf also exhibited two-photon fluorescence for the detection of ONOO− in the presence of O2˙−in vitro using an excitation of 720 nm (Fig. S2†).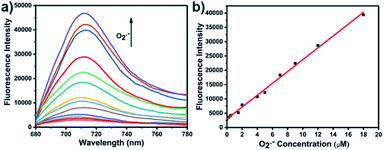 | ||
| Fig. 1 (a) One-photon fluorescence spectra of LW-OTf (2.4 μM) after addition of KO2 (0–25 μM). (b) Linear relationship between fluorescence intensity of LW-OTf (2.4 μM) and concentration of O2˙− (0–18 μM). λex/em = 675/710 nm. Note: O2˙− was prepared by dissolving KO2 in DMSO, and was then added to LW-OTf (in DMSO). The mixture was diluted with PBS buffer (10 mM, pH 7.4) before each measurement. See ESI for detailed procedures.† | ||
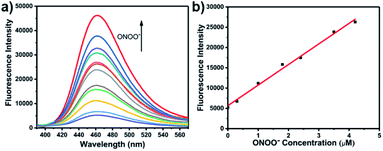 | ||
| Fig. 2 (a) One-photon fluorescence spectra of LW-OTf (2.4 μM) pre-incubated with O2˙− (5 μM), followed by addition of ONOO− (0–36 μM). λex/em = 360/461 nm. (b) Linear relationship between fluorescence intensity of LW-OTf (2.4 μM, pre-incubated with O2˙− (5 μM)) and concentration of ONOO− (0–4.2 μM). λex/em = 360/461 nm. Note: O2˙− was prepared by dissolving KO2 in DMSO, and was then added to LW-OTf (in DMSO), followed by addition of ONOO− (in water). The mixture was diluted with PBS buffer (10 mM, pH 7.4) before each measurement. See ESI for detailed procedures.† | ||
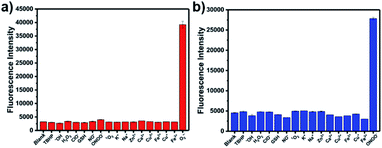
The optical selectivity of LW-OTf towards the selected ROS and RNS was then evaluated in vitro, confirming that its fluorescence response was most sensitive to the presence of O2˙− (Fig. 3a). As previously noted, C![[double bond, length as m-dash]](https://www.rsc.org/images/entities/char_e001.gif) C cleavage by ONOO− could also occur, however as this does not lead to a fluorescent signal, no selectivity issues arose. Selectivity towards ONOO− was then determined using a stepwise approach, first incubating LW-OTf with superoxide, then adding either ONOO− or a range of other ROS. Fragmentation of LW-OH to LW-XTD resulting from RNS-mediated oxidative cleavage of the C
C cleavage by ONOO− could also occur, however as this does not lead to a fluorescent signal, no selectivity issues arose. Selectivity towards ONOO− was then determined using a stepwise approach, first incubating LW-OTf with superoxide, then adding either ONOO− or a range of other ROS. Fragmentation of LW-OH to LW-XTD resulting from RNS-mediated oxidative cleavage of the C![[double bond, length as m-dash]](https://www.rsc.org/images/entities/char_e001.gif) C linker was monitored by measuring the increase in emission at 461 nm after excitation at 360 nm. These experiments demonstrated that intermediate LW-OH was specifically responsive to ONOO− over H2O2, NO˙, ˙OH, 1O2, and ClO− (Fig. 3b). pH titrations indicated that the fluorescence intensity of LW-OTf was greatest at pH 7–8, matching the physiological pH at which this probe would operate in vivo (Fig. S3 and S5†). Fluorescence intensities at 710 nm decreased significantly at lower pH, likely due to phenolic protonation of LW-OH, resulting in reduced intramolecular charge transfer (ICT) (Fig. S3†).43–45 Decomposition of ONOO− at acidic pH is likely responsible for the decreased emission intensities at 461 nm (Fig. S5†).46
C linker was monitored by measuring the increase in emission at 461 nm after excitation at 360 nm. These experiments demonstrated that intermediate LW-OH was specifically responsive to ONOO− over H2O2, NO˙, ˙OH, 1O2, and ClO− (Fig. 3b). pH titrations indicated that the fluorescence intensity of LW-OTf was greatest at pH 7–8, matching the physiological pH at which this probe would operate in vivo (Fig. S3 and S5†). Fluorescence intensities at 710 nm decreased significantly at lower pH, likely due to phenolic protonation of LW-OH, resulting in reduced intramolecular charge transfer (ICT) (Fig. S3†).43–45 Decomposition of ONOO− at acidic pH is likely responsible for the decreased emission intensities at 461 nm (Fig. S5†).46
In order to better understand and ultimately confirm the suggested mode of action of probe LW-OTf, we assessed the time course of the reaction of LW-OTf with both O2˙− and ONOO− (Fig. S4 and S6†). Whilst the reaction of LW-OTf with O2˙− was finished within 10 min (Fig. S4†), the subsequent addition of ONOO− resulted in an instantaneous and significant fluorescence increase (Fig. S6†). Both reaction profiles are consistent with the known reactivity of both analytes, and offer promising prospects for future applications, since rapid detection is particularly important for real-time detection of O2˙− and ONOO− in living systems. In addition, high-resolution LC-MS experiments were performed to confirm the proposed fluorescence mechanisms (Fig. S7–S12†). Addition of KO2 (3 equiv. in DMSO) to a solution of LW-OTf (in MeOH) resulted in the representative cation of LW-OH ([M]+, m/z = 412.2283), indicating the triflyl-deprotection of LW-OTf by superoxide (Fig. S8†). The mass spectra following the addition of ONOO− (1 equiv. in water) were found to be consistent with the mechanism proposed above, with detection of the mass ion for LW-XTD ([M + H]+, m/z = 229.0860) as well as the indoline by-product confirming oxidative cleavage of LW-OH by ONOO− (Fig. S9 and S10†).38,47 HRMS was also used to prove the alternate activation pathway, with direct addition of ONOO− (5 equiv. in water) to LW-OTf (in MeOH) generating a mass ion for LW-XTD-OTf ([M + H]+, m/z = 361.0357, Fig. S12†).39,40
These promising in vitro results prompted us to explore the duplex imaging of LW-OTf in living cells and in mice. Using MTT assays, it was confirmed that LW-OTf was non-toxic to HL-7702 cells (Fig. S13†). Pre-treatment of the cells with a superoxide scavenger Tiron (10 μM, 30 min),48,49 followed by incubation with LW-OTf (2.4 μM) for a further 15 min resulted in only weak fluorescence in the red channel (Fig. S14a†). Conversely, pre-treatment with Tiron followed by stimulation by varying amounts of 2-methoxyestradiol50–52 (2-ME, 0, 0.5, 2.0, 3.0 μg mL−1), an O2˙− promoter, resulted in significant fluorescence intensity enhancement in the red channel (Fig. S14a†). Only weak fluorescence and no significant change was observed in the blue channel, for which an excitation wavelength of 405 nm was used (closest available to 360 nm). These results clearly confirm the ability of LW-OTf to selectively detect superoxide in cells using NIRF.
Interestingly, LW-OTf detected O2˙− primarily in lysosomes after stimulation with 2-ME (red channel, Fig. S16a, d, g and j†), probably facilitated by endocytosis.45 Co-staining with commercial organelle markers was performed using Lyso-Tracker Green (Fig. S16b†), ER-Tracker Red (Fig. S16e†), Golgi-Tracker Red (Fig. S16h†) and Mito-Tracker Green (Fig. S16k†). The Pearson correlation coefficients with the markers for the lysosomes, endoplasmic reticulum, Golgi, and mitochondria were 0.87, 0.51, 0.39 and 0.35, respectively.
As shown in Fig. S14b,† cells were first pre-incubated with Tiron (10 μM), then exposed to 2-ME (3.0 μg mL−1), followed by staining with LW-OTf (2.4 μM), and finally incubated with SIN-1 (ONOO− donor).53 A concentration-dependent change in fluorescence emission intensity in the blue and red channel was observed. The addition of 3.0 mM SIN-1 led to a 4.25-fold enhancement of the average blue fluorescence intensity and 2.54-fold decrease in the average red fluorescence intensity (Fig. S14d†). Similar to the results shown in Fig. S16, LW-OTf demonstrated the ability to visualize ONOO− in lysosomes with a Pearson correlation coefficient of 0.90 (Fig. S17†).
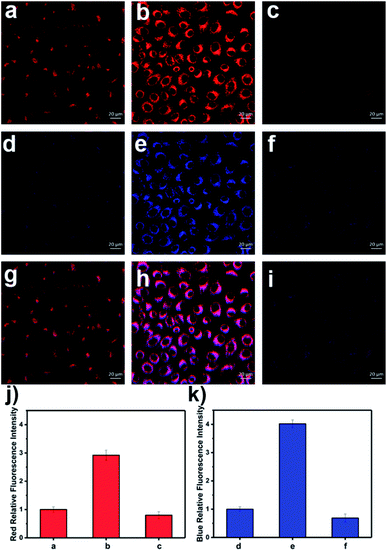
Since overdose of APAP leads to the overproduction of ROS and RNS,54 APAP-induced DILI was chosen as a representative model for liver toxicity in which to evaluate the effectiveness of LW-OTf. Although this model is often used for single detection of ONOO−,7,55–57 simultaneous detection of RNS and ROS in DILI is still rare.8 Treatment of HL-7702 cells with APAP and LW-OTf produced a marked increase in fluorescence in both the red and blue channels (Fig. 4b and e), indicating upregulation of intracellular O2˙− and ONOO− after administration of APAP, and demonstrating the ability of our probe to detect concentration changes of O2˙− by NIRF and ONOO− by TPEF in DILI. This was further confirmed using tert-butylhydroxyanisole (BHA), a ROS and RNS scavenger58 which has been used to eliminate ROS and relieve APAP-induced liver injury.59,60 Upon addition of BHA, the fluorescence intensity for both the red and blue channels decreased (Fig. 4c and f). Similarly, LW-OTf exhibited the expected one-photon fluorescence changes in the blue and red channel from APAP-induced hepatotoxicity and remediation using BHA (Fig. S15†).
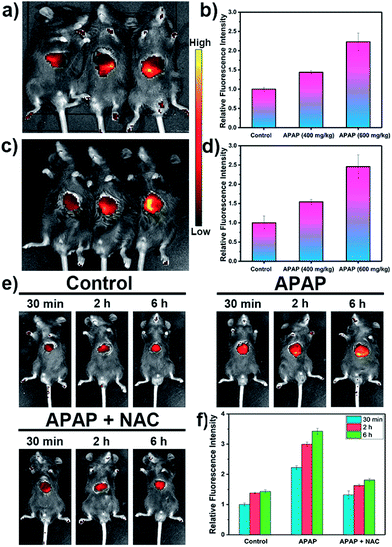
Inspired by these cell imaging experiments, LW-OTf was used for in vivo imaging of O2˙− and ONOO− in DILI. Towards that aim, C57 mice were treated with APAP either at analgesic low dosage (200 mg kg−1, control group), or high dosages (400 mg kg−1 and 600 mg kg−1). After 6 h,61,62 all three groups were given intraperitoneal injections of LW-OTf (200 μL, 48 μM), and imaging was performed after a further 15 min. The NIRF imaging ability for O2˙− in exposed livers was investigated first. As shown in Fig. 5a (left mouse) and Fig. 5b, only weak fluorescence at 710 nm was observed in the control group mice, implying only low concentrations of O2˙− for low doses of APAP. In contrast, after the administration of high doses of APAP, the mouse livers displayed significant fluorescence enhancements in a concentration-dependent manner, indicating DILI-induced overproduction of O2˙− after APAP treatment. Deep tissue penetration imaging of O2˙− in depilated mice using probe LW-OTf indicated a 1.54-fold (APAP 400 mg kg−1) and 2.46-fold (APAP 600 mg kg−1) increase in the emission at 710 nm (Fig. 5c and d). Furthermore, as displayed in Fig. 5e and f, the highest dosage group (APAP 600 mg kg−1) showed significant fluorescence enhancement over time, indicating continued DILI-induced ROS overproduction. To confirm this, N-acetylcysteine (NAC), a hepatoprotective agent, was injected into the DILI mice (APAP 600 mg kg−1), resulting in a significant attenuation in the fluorescent signal back to levels comparable to the control group mice.
Our attention then turned to two-photon in vivo bio-imaging of ONOO− using LW-OTf, using the same mouse models as discussed above. Following surgical treatment, the liver of each mouse was assessed using two-photon fluorescence imaging with excitation at 720 nm. The livers of mice under nitrosative stress (Fig. 6c) exhibited distinct fluorescence enhancements (approximately 3.68-fold) when compared to the control mice (Fig. 6a). These results validate the ability of LW-OTf to image both superoxide and peroxynitrite in vivo, using NIRF for the former, and TPEF for the latter.
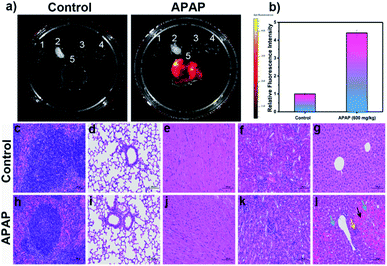
Following on from these in vivo results, we wished to explore the distribution of DILI-induced ROS/RNS in mice. Again, DILI model group mice were injected intraperitoneally with a dose of APAP (600 mg kg−1), whilst a control group was given only physiological saline. After 6 h both groups were injected with LW-OTf (200 μL, 48 μM) and left for 15 min before being killed and dissected to isolate their major organs for ex vivo NIRF imaging (Fig. 7a and b). As shown in Fig. 7a, when compared to the other organs (spleen, lung, heart, and kidney), a significant fluorescence signal was observed in the liver of both DILI and control group mice. In addition, LW-OTf exhibited a stronger fluorescence signal in the livers of DILI mice than in those of healthy mice (Fig. 7b). Furthermore, hematoxylin and eosin (H&E) staining of the liver tissues and other major organ tissues (spleen, lung, heart, and kidney) was carried out to identify the histological changes during the APAP treatment. All tissue types from both the control and model groups were examined for tissue architecture, degeneration, necrosis, hemorrhage, and inflammatory cell infiltration, looking for splenic, pulmonary, cardiac, renal, and hepatic damage. No obvious differences or damage were observed upon comparison of the control and model tissue samples of the spleen, lung, heart and kidney, indicating clearly that no APAP-induced damage had occurred (Fig. 7c–f and h–k).
As displayed in Fig. 7g, the control group liver appeared healthy, with the structure of the liver lobules clear, neatly arranged hepatocytes, and no obvious degeneration, necrosis, inflammatory cell infiltration or congestion of hepatic sinusoids. The hepatocytes from the model group (Fig. 7l), on the other hand, exhibited clear signs of liver damage. Significant congestions and hemorrhage was visible in the sinusoids of the acinar III zone (black arrow), and a large amount of hepatocyte steatosis with dense vacuoles in the cytoplasm (blue arrow) were observed. Some hepatocytes with dissolved and disappeared nuclei were necrotic (green arrow). Slight inflammatory infiltration and individual inflammatory foci in the liver lobules could be seen (yellow arrow). Thus, these H&E staining results are in good agreement with the results of in vitro and in vivo fluorescence imaging using O2˙− and ONOO− as biomarkers.
Conclusions
In conclusion, we have established LW-OTf as the first molecular fluorescent probe for the in situ imaging of RNS and ROS associated with drug-induced liver injury in living cells and mice. LW-OTf was able to detect O2˙− and ONOO−via near-infrared fluorescence and two-photon fluorescence, respectively. We believe that the molecular design of LW-OTf can be generalized for dual imaging of other biomarkers (e.g. alkaline phosphatase)63 and ONOO− in DILI by simply changing the protecting group on the NIRF signaling moiety. In principle, the detection of RNS and ROS in real time with fluorescence imaging agents could significantly help guide the understanding of ROS- and RNS-related diseases and potentially contribute to the development of new approaches for the treatment of DILI.Conflicts of interest
There are no conflicts to declare.Acknowledgements
All the animal experiments were performed strictly in accordance with the relevant laws and guidelines issued and approved by the Ethical Committee of Shandong Normal University for the Care and Use of Laboratory Animals. L. W. wishes to thank China Scholarship Council and the University of Bath for supporting his PhD in the UK. We would like to thank the EPSRC and the University of Bath for funding. T. D. J. wishes to thank the Royal Society for a Wolfson Research Merit Award and the Open Research Fund of the School of Chemistry and Chemical Engineering, Henan Normal University for support (2020ZD01). R. R. G. wishes to thank the EPSRC Centre for Doctoral Training in Catalysis (EP/L016443/1). P. L. and B. T. thank National Natural Science Foundation of China (22074083, 91753111, 21927811) and the Key Research and Development Program of Shandong Province (2018YFJH0502), National Major Scientific and Technological Special Project for “Significant New Drugs Development” (2017ZX09301030004). NMR characterisation facilities were provided by the Material and Chemical Characterisation Facility (MC2) at the University of Bath (http://go.bath.ac.uk/mc2), and we would like to thank Dr Catherine Lyall for her support with characterization. The EPSRC UK National Mass Spectrometry Facility at Swansea University is thanked for analyses. Thanks are also due to Dr Grace M. E. Pearson for helpful conversations and advice. All data supporting this study are provided as ESI† accompanying this paper.Notes and references
- W. M. Lee, Clin. Liver Dis., 2013, 17, 575–586 CrossRef.
- A. Reuben, D. G. Koch and W. M. Lee, Hepatology, 2010, 52, 2065–2076 CrossRef.
- G. A. Kullak-Ublick, R. J. Andrade, M. Merz, P. End, A. Benesic, A. L. Gerbes and G. P. Aithal, Gut, 2017, 66, 1154–1164 CrossRef CAS.
- S. S. Bale, L. Vernetti, N. Senutovitch, R. Jindal, M. Hegde, A. Gough, W. J. McCarty, A. Bakan, A. Bhushan, T. Y. Shun, I. Golberg, R. DeBiasio, O. B. Usta, D. L. Taylor and M. L. Yarmush, Exp. Biol. Med., 2014, 239, 1180–1191 CrossRef.
- A. Van Summeren, J. Renes, D. Lizarraga, F. G. Bouwman, J.-P. Noben, J. H. M. van Delft, J. C. S. Kleinjans and E. C. M. Mariman, OMICS, 2013, 17, 71–83 CrossRef CAS.
- P. Cheng, Q. Miao, J. Li, J. Huang, C. Xie and K. Pu, J. Am. Chem. Soc., 2019, 141, 10581–10584 CrossRef CAS.
- Y. Li, X. Xie, X. Yang, M. Li, X. Jiao, Y. Sun, X. Wang and B. Tang, Chem. Sci., 2017, 8, 4006–4011 RSC.
- A. J. Shuhendler, K. Pu, L. Cui, J. P. Uetrecht and J. Rao, Nat. Biotechnol., 2014, 32, 373–380 CrossRef CAS.
- L. Wu, Q. Ding, X. Wang, P. Li, N. Fan, Y. Zhou, L. Tong, W. Zhang, W. Zhang and B. Tang, Anal. Chem., 2020, 92, 1245–1251 CrossRef CAS.
- J. A. Kramer, J. E. Sagartz and D. L. Morris, Nat. Rev. Drug Discovery, 2007, 6, 636–649 CrossRef CAS.
- N. Noureddin and N. Kaplowitz, in Drug-Induced Liver Toxicity, ed. M. Chen and Y. Will, Humana, New York, NY, 2018, ch. 1, pp. 3–18 Search PubMed.
- C. Latchoumycandane, C. W. Goh, M. M. Ong and U. A. Boelsterli, Hepatology, 2007, 45, 412–421 CrossRef CAS.
- K. K. Lee, N. Imaizumi, S. R. Chamberland, N. N. Alder and U. A. Boelsterli, Hepatology, 2015, 61, 326–336 CrossRef CAS.
- K. Du, A. Ramachandran, J. L. Weemhoff, H. Chavan, Y. Xie, P. Krishnamurthy and H. Jaeschke, Toxicol. Sci., 2016, 154, 214–226 CrossRef CAS.
- H. Jaeschke, M. R. McGill and A. Ramachandran, Drug Metab. Rev., 2012, 44, 88–106 CrossRef CAS.
- S. Russmann, G. A. Kullak-Ublick and I. Grattagliano, Curr. Med. Chem., 2009, 16, 3041–3053 CrossRef CAS.
- D. Pessayre, A. Mansouri, D. Haouzi and B. Fromenty, Cell Biol. Toxicol., 1999, 15, 367–373 CrossRef CAS.
- H. Jaeschke, G. J. Gores, A. I. Cederbaum, J. A. Hinson, D. Pessayre and J. J. Lemasters, Toxicol. Sci., 2002, 65, 166–176 CrossRef CAS.
- E. Haustein and P. Schwille, HFSP J., 2007, 1, 169–180 CrossRef CAS.
- E. A. Owens, M. Henary, G. El Fakhri and H. S. Choi, Acc. Chem. Res., 2016, 49, 1731–1740 CrossRef CAS.
- L. Wu, X. Tian, H.-H. Han, J. Wang, R. R. Groleau, P. Tosuwan, B. Wannalerse, A. C. Sedgwick, S. D. Bull, X.-P. He and T. D. James, ChemistryOpen, 2019, 8, 1407–1409 CrossRef CAS.
- F. Ding, Y. Fan, Y. Sun and F. Zhang, Adv. Healthcare Mater., 2019, 8, 1900260 CrossRef.
- J. Zhang, C. Li, R. Zhang, F. Zhang, W. Liu, X. Liu, S. M.-Y. Lee and H. Zhang, Chem. Commun., 2016, 52, 2679–2682 RSC.
- F. Yu, M. Gao, M. Li and L. Chen, Biomaterials, 2015, 63, 93–101 CrossRef CAS.
- Y. Wang, M. Gao, C. Liao, F. Yu and L. Chen, Sens. Actuators, B, 2019, 301, 127038 CrossRef CAS.
- K. Xu, X. Liu and B. Tang, ChemBioChem, 2007, 8, 453–458 CrossRef CAS.
- J. Yang, X. Liu, H. Wang, H. Tan, X. Xie, X. Zhang, C. Liu, X. Qu and J. Hua, Analyst, 2018, 143, 1242–1249 RSC.
- X. Han, R. Wang, X. Song, F. Yu, C. Lv and L. Chen, Biomaterials, 2018, 156, 134–146 CrossRef CAS.
- P. T. C. So, C. Y. Dong, B. R. Masters and K. M. Berland, Annu. Rev. Biomed. Eng., 2000, 2, 399–429 CrossRef CAS.
- L. C. Murfin, M. Weber, S. J. Park, W. T. Kim, C. M. Lopez-Alled, C. L. McMullin, F. Pradaux-Caggiano, C. L. Lyall, G. Kociok-Köhn, J. Wenk, S. D. Bull, J. Yoon, H. M. Kim, T. D. James and S. E. Lewis, J. Am. Chem. Soc., 2019, 141, 19389–19396 CrossRef CAS.
- L. Wu, A. C. Sedgwick, X. Sun, S. D. Bull, X.-P. He and T. D. James, Acc. Chem. Res., 2019, 52, 2582–2597 CrossRef CAS.
- X. Jiao, Y. Li, J. Niu, X. Xie, X. Wang and B. Tang, Anal. Chem., 2018, 90, 533–555 CrossRef CAS.
- H. Xiao, W. Zhang, P. Li, W. Zhang, X. Wang and B. Tang, Angew. Chem., Int. Ed., 2020, 59, 4216–4230 CrossRef CAS.
- W. Zhang, J. Liu, P. Li, X. Wang, S. Bi, J. Zhang, W. Zhang, H. Wang and B. Tang, Biomaterials, 2019, 225, 119499 CrossRef CAS.
- L. Yuan, W. Lin, S. Zhao, W. Gao, B. Chen, L. He and S. Zhu, J. Am. Chem. Soc., 2012, 134, 13510–13523 CrossRef CAS.
- J. J. Hu, N.-K. Wong, S. Ye, X. Chen, M.-Y. Lu, A. Q. Zhao, Y. Guo, A. C.-H. Ma, A. Y.-H. Leung, J. Shen and D. Yang, J. Am. Chem. Soc., 2015, 137, 6837–6843 CrossRef CAS.
- L. Wu, L. Liu, H.-H. Han, X. Tian, M. L. Odyniec, L. Feng, A. C. Sedgwick, X.-P. He, S. D. Bull and T. D. James, New J. Chem., 2019, 43, 2875–2877 RSC.
- D.-Y. Zhou, Y. Li, W.-L. Jiang, Y. Tian, J. Fei and C.-Y. Li, Chem. Commun., 2018, 54, 11590–11593 RSC.
- D. Oushiki, H. Kojima, T. Terai, M. Arita, K. Hanaoka, Y. Urano and T. Nagano, J. Am. Chem. Soc., 2010, 132, 2795–2801 CrossRef CAS.
- X. Jia, Q. Chen, Y. Yang, Y. Tang, R. Wang, Y. Xu, W. Zhu and X. Qian, J. Am. Chem. Soc., 2016, 138, 10778–10781 CrossRef CAS.
- F. Tampieri, G. Cabrellon, A. Rossa, A. Barbon, E. Marotta and C. Paradisi, ACS Sens., 2019, 4, 3080–3083 CrossRef CAS.
- H. M. Kim and B. R. Cho, Chem. Rev., 2015, 115, 5014–5055 CrossRef CAS.
- Q. Wan, S. Chen, W. Shi, L. Li and H. Ma, Angew. Chem., Int. Ed., 2014, 53, 10916–10920 CrossRef CAS.
- L. Wu, X. Li, C. Huang and N. Jia, Anal. Chem., 2016, 88, 8332–8338 CrossRef CAS.
- H. Fang, S. Yao, Q. Chen, C. Liu, Y. Cai, S. Geng, Y. Bai, Z. Tian, A. L. Zacharias, T. Takebe, Y. Chen, Z. Guo, W. He and J. Diao, ACS Nano, 2019, 13, 14426–14436 CrossRef CAS.
- M. Kirsch, H.-G. Korth, A. Wensing, R. Sustmann and H. de Groot, Arch. Biochem. Biophys., 2003, 418, 133–150 CrossRef CAS.
- D.-Y. Zhou, Y. Li, W.-L. Jiang, Y. Tian, J. Fei and C.-Y. Li, Chem. Commun., 2018, 54, 13159 RSC.
- Y. Xuan and J. Qu, RSC Adv., 2018, 8, 4125–4129 RSC.
- F. A. Taiwo, J. Spectrosc., 2008, 22, 491–498 CrossRef CAS.
- W. Zhang, J. Zhang, P. Li, J. Liu, D. Su and B. Tang, Chem. Sci., 2019, 10, 879–883 RSC.
- P. Huang, L. Feng, E. A. Oldham, M. J. Keating and W. Plunkett, Nature, 2000, 407, 390–395 CrossRef CAS.
- Y. Zhou, E. O. Hileman, W. Plunkett, M. J. Keating and P. Huang, Blood, 2003, 101, 4098–4104 CrossRef CAS.
- F. J. Martin-Romero, Y. Gutiérrez-Martin, F. Henao and C. Gutiérrez-Merino, J. Fluoresc., 2004, 14, 17–23 CrossRef CAS.
- K. Du, A. Ramachandran and H. Jaeschke, Redox Biol., 2016, 10, 148–156 CrossRef CAS.
- D. Li, S. Wang, Z. Lei, C. Sun, A. M. El-Toni, M. S. Alhoshan, Y. Fan and F. Zhang, Anal. Chem., 2019, 91, 4771–4779 CrossRef CAS.
- W.-L. Jiang, Y. Li, W.-X. Wang, Y.-T. Zhao, J. Fei and C.-Y. Li, Chem. Commun., 2019, 55, 14307–14310 RSC.
- D. Cheng, W. Xu, L. Yuan and X. Zhang, Anal. Chem., 2017, 89, 7693–7700 CrossRef CAS.
- K. Machida, H. Tsukamoto, J.-C. Liu, Y.-P. Han, S. Govindarajan, M. M. C. Lai, S. Akira and J.-h. J. Ou, Hepatology, 2010, 52, 480–492 CrossRef CAS.
- G. He and M. Karin, Cell Res., 2011, 21, 159–168 CrossRef CAS.
- W. Chamulitrat, M. F. Hughes, T. E. Eling and R. P. Mason, Arch. Biochem. Biophys., 1991, 290, 153–159 CrossRef CAS.
- J. L. Hynson and M. South, Med. J. Aust., 1999, 171, 497 CrossRef CAS.
- E. Yoon, A. Babar, M. Choudhary, M. Kutner and N. Pyrsopoulos, J. Clin. Transl. Hepatol., 2016, 4, 131–142 Search PubMed.
- Y. Wu, S. Huang, J. Wang, L. Sun, F. Zeng and S. Wu, Nat. Commun., 2018, 9, 3983 CrossRef.
Footnotes |
| † Electronic supplementary information (ESI) available. See DOI: 10.1039/d0sc05937d |
| ‡ These authors contributed equally to this work. |
| This journal is © The Royal Society of Chemistry 2021 |

