 Open Access Article
Investigating states of gas in water encapsulated between graphene layers†
Wei-Hao
Hsu
and
Ing-Shouh
Hwang
 *
*
Institute of Physics, Academia Sinica, Nankang, Taipei 11529, Taiwan. E-mail: ishwang@phys.sinica.edu.tw
First published on 4th January 2021
Abstract
Conventionally, only two states are assumed to exist in water: well-dispersed gas monomers and gas bubbles. Rarely is this paradigm explored experimentally. To close this gap, here we used transmission electron microscopy (TEM) to study degassed water, deionized water, and gas-supersaturated water encapsulated in graphene liquid cells. While neither degassed water nor deionized water yielded specific features, two major microscopic structures were evident in gas-supersaturated water: (1) polycrystalline nanoparticles formed of gas molecules and (2) a high density of tiny cells. Dark-field TEM imaging revealed that water molecules surrounding each cell form crystalline structures—a surprising discovery of a clathrate state in gas-supersaturated water that may help resolve several long-standing puzzles. Overall, this study suggests that water may form a matrix that actively interacts with gas molecules in complex and subtle ways.
Introduction
Dissolution of gases in liquid water is a general, fundamental, and critical phenomenon across living and nonliving things. Despite numerous studies over the last century, there remain many mysteries about gas dissolved in water, such as the nucleation mechanism of gas bubbles in water, whether nanobubbles exist in bulk water, the abnormal thermodynamic properties of gas-saturated water, and more.1–8 Simple gas molecules, such as N2, O2, Ar, and SF6, are small nonpolar molecules with very low solubility in water. Conventionally it has been assumed that dissolved gas molecules are well dispersed as monomers (Fig. S1a†). The concentration of gas molecules at a given time and position, C(r,t), has been used to describe the gas condition in aqueous solutions, even when the dissolved gas concentration is near or above the saturation level.9–12 Gas bubbles may form in water (Fig. S1b†) when the gas concentration exceeds a certain supersaturation level.However, recent experiments suggest that gas concentration alone is not sufficient to describe gas dissolved in water, and it has been proposed that a portion of gas molecules aggregate into clusters when the gas concentration is near or above the saturation concentration.13–15 Therefore, here we sought to examine whether dissolved gas forms clusters or other microstructures in water. Transmission electron microscopy (TEM) of graphene liquid cells (GLCs) can reveal structures in liquid with sub-nanometer or atomic resolution.16–20 We encapsulated water between two laminated graphene layers spanning the holes in TEM grids; we investigated degassed water, deionized water, and water supersaturated with pure gas (N2, O2, Ar, Xe, CO2, and SF6) at room temperature. We detected two major structures in gas-supersaturated water: (1) individual polycrystalline nanoparticles (typically several nanometers in diameter) in liquid water, and (2) clathrate structures (often ∼100 nm or larger in lateral size). In the clathrate structures, water molecules form a polycrystalline matrix hosting a high density of gas-containing cells (cell separation of 4–8 nm). Together, these observations challenge the conventional view of gas in water (Fig. S1†) and reveal intricate and surprising interactions among water molecules and gas molecules.
Experimental procedures
Materials
Deionized water was prepared using a Milli-Q system (Millipore Corp.) with a resistivity of 18.2 MΩ cm. To prepare gas-supersaturated water, a glass bottle (50 mL) containing deionized water (20 mL) was placed in a pressure tank (TNKB1-3; Misumi) and pumped to ∼0.1 atm for 1 h with an oil-free vacuum pump (Rocker 410, Rocker). The tank was pressurized to 2–4 atm with high-purity (99.999%) gas (Fig. S2a†). Six gases (N2, O2, Ar, Xe, CO2, SF6) were used. The water was stored in the pressurized tank for ∼2 days; the tank was opened right before preparing graphene liquid cells (GLCs). To prepare degassed water, the glass bottle containing deionized water was kept in the same pressure tank pumped to ∼0.1 atm (Fig. S2b†) for ∼2 days. The tank was opened right before preparation of GLCs. Unless otherwise specified, all experiments were conducted at room temperature (22–24 °C). To prepare GLCs, two commercial graphene-covered copper grids for transmission electron microscopy (TEM; 2000-mesh, 2–6 graphene layers, SKU-TEM-CU-2000-025, Graphene Supermarket) were heated to 180 °C on a hot plate for 1 h to remove moisture and contaminants on the graphene. The grids were cooled to room temperature in a dry cabinet. Then, a droplet (∼1 μL) of water (degassed, deionized, or gas-supersaturated) was deposited on a graphene-covered grid with the graphene side up, and the other graphene-covered grid was immediately placed on the droplet with the graphene side down (Fig. S2c†). A cover slip was placed on top to press the two TEM grids to squeeze out most of the water, leaving only a tiny amount of water trapped between the graphene sheets. Finally, two copper grids were separated with tweezers; the resulting GLCs were attached to only one TEM grid, which could be discerned easily with the eyes. For gas-supersaturated water, we studied 9 samples of N2-supersaturated water, 2 samples of O2-supersaturated water, 6 samples of Ar-supersaturated water, 2 samples of Xe-supersaturated water, 2 samples of CO2-supersaturated water, 4 samples of SF6-supersaturated water, all prepared at 3–4 atm, as well as one sample of N2-supersaturated water prepared at 2 atm.Transmission electron microscopy (TEM)
All GLC samples were imaged with a field-emission TEM (JEM-2100F, JEOL) with an acceleration voltage of 100 kV. The background pressure was ∼5 × 10⁻⁶ Pa. Unless specified otherwise, bright-field imaging was typically operated at underfocus to achieve high image contrast. Electron loss energy spectroscopy (EELS) was conducted with a GIF 863 Tridiem (Gatan) in diffraction mode. The thickness of water pockets was estimated as 20–200 nm via the EELS log-ratio technique.21Results
TEM of degassed water and deionized water in GLCs
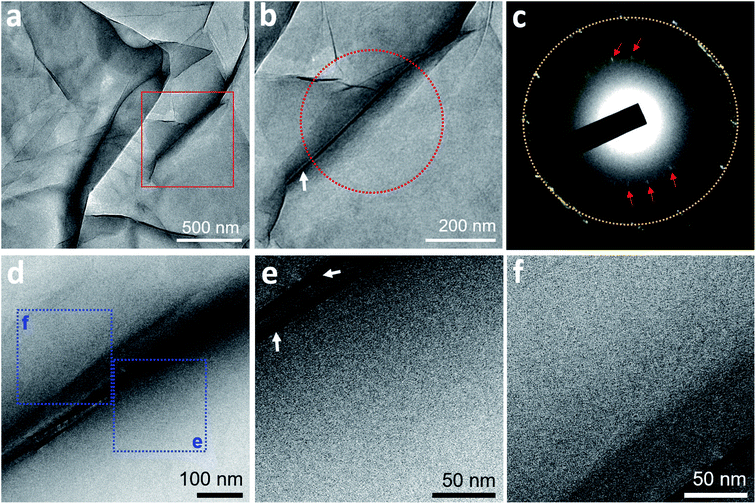
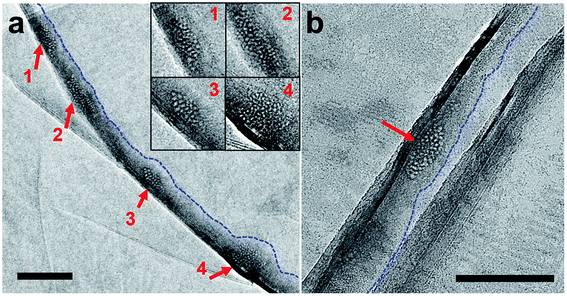
On TEM of two GLCs containing degassed water, encapsulated water pockets appeared with darker contrast than non-encapsulated regions (Fig. 1a and b), mainly due to variations in water thickness. The shapes of encapsulated liquid pockets were very irregular, and graphene wrinkles (dark lines in TEM images) often appeared in water-encapsulated regions (Fig. 1). No specific structure was evident in water pockets containing degassed water (Fig. 1). The diffraction pattern of degassed water only contained spots corresponding to {0−110} graphene lattice (spacing of 2.14 Å)22 and graphene interlayer spacing (d-spacing of 3.3 Å)23 associated with wrinkles of multi-layer graphene (Fig. 1c). These observations indicate a homogenous liquid medium inside the encapsulated water regions. Electron energy loss spectroscopy (EELS) performed on a pocket of degassed water revealed spectra of a carbon K-edge associated with graphene and an oxygen K-edge associated with water (Fig. S3†).We also prepared three GLC samples containing deionized water, which is partially degassed with air gas at 60–80% of the saturation concentration. Similarly, no specific structure was detected in the water pockets of deionized water (Fig. S4†).
Polycrystalline nanoparticles of gas molecules in gas-supersaturated water
We carried out bright-field imaging of water pockets containing N2-supersaturated water (Fig. S5a†). Higher-resolution images revealed dark particles several nanometers in size inside the water pockets (Fig. S5b–d†). The sizes of these nanoparticles gradually increased over time through two coarsening mechanisms: coalescence (Fig. 2, white outline) and Ostwald ripening (Fig. 2, yellow outline). The shapes of the particles were far from spherical directly after coalescence, but the particles became more spherical over time (Fig. 2, white outline). We detected a gradual disappearance of small particles and an increase in size of large particles during Ostwald ripening (Fig. 2, yellow outline). High-resolution images also revealed polycrystalline structures in these dark particles (Fig. 2, 1040 s and 1393 s). The crystalline lattice structures vary over time, probably due to electron irradiation and/or intrinsic structural rearrangements at room temperature.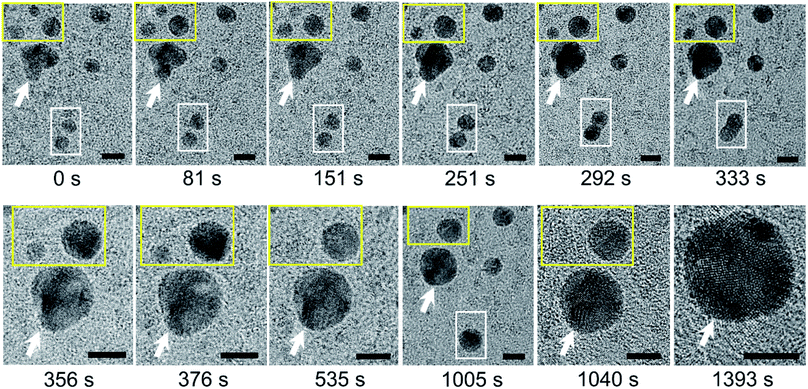 | ||
| Fig. 2 Coarsening of polycrystalline nanoparticles of N2 molecules over time in supersaturated water. Acquisition time is indicated below each image. The image labeled t = 0 s was acquired 65 s after the image in Fig. S5d.† Note the two types of coarsening processes in these images: Ostwald ripening (yellow outline) and coalescence (white outline). The white arrow highlights a reference particle. Scale bars: 5 nm. | ||
In some water pockets, dark particles several tens nanometers in size were observed in GLCs containing N2-supersaturated water (Fig. S6a†). EELS spectra around the nitrogen K-edge (∼400 eV) were obtained for large particles (Fig. S6b†) and spectra around the oxygen K-edge (∼540 eV) were obtained throughout the liquid pockets (Fig. S6c†), indicating that water containing nitrogen is encapsulated in the GLC. It was previously proposed that gas molecules dissolved in water may aggregate into clusters in bulk water,13,15,24 and theoretical simulations have indicated that small hydrophobic molecules such as CH4 tend to cluster in water.25,26 Our current observations support this hypothesis, but to our knowledge the formation of polycrystalline structures has never been proposed or predicted previously.
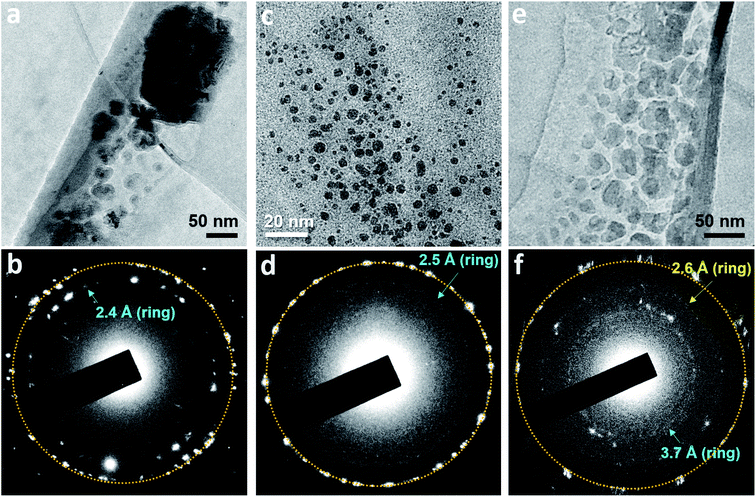
Polycrystalline dark particles also appeared in GLCs containing O2, Ar, Xe, or SF6-supersaturated water. Selected area electron diffraction (SAED) patterns acquired on these regions contained spots forming rings (Fig. 3), indicating the presence of small crystals with many different orientations.
Clathrate state in gas-supersaturated water
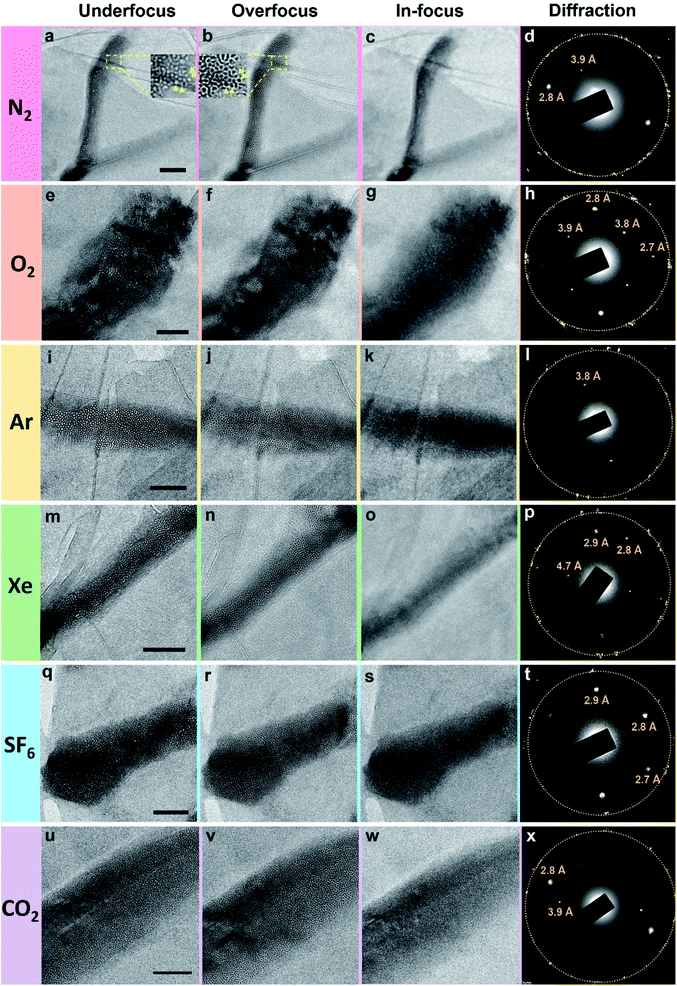
The polycrystalline nanoparticles shown in Fig. 2, 3, S5 and S6† were only detected in a small number of the water pockets in GLC samples of gas-supersaturated water. We uncovered an intriguing and distinctive state in most of the water pockets in the same GLC samples (Fig. 4). This state features a high density of tiny cells: in a pocket containing N2-supersaturated water, these cells appear as white spots at underfocus (Fig. 4a) and as dark spots at overfocus (Fig. 4b). In focus, the cells have very low contrast and are difficult to discern (Fig. 4c). Similar structures were visualized in GLCs containing water supersaturated with other gases, including O2, Ar, Xe, SF6, and CO2 (Fig. 4). EELS of this state in pockets containing SF6-supersaturated water revealed clear features of S and O (Fig. 5), indicating that the water contains SF6.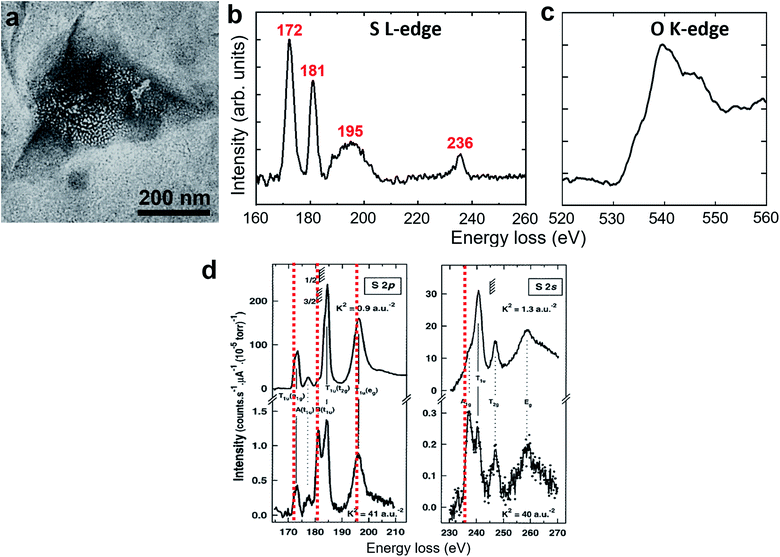 | ||
| Fig. 5 EELS of a clathrate structure in SF6-supersaturated water. (a) Bright-field TEM image. (b and c) Background-subtracted EELS spectra acquired from the region in (a). The red values in (b) indicate the energy of the peaks associated with the sulfur L-edge, revealing the existence of SF6 molecules. (c) The peak near 540 eV in (c) is associated with the oxygen K-edge from water molecules. (d) Comparison with previously reported EELS spectra of SF6 gas.27 The red dashed lines indicate the peak values in our measurement in (b). The spectra in (b) are somewhat different from those of SF6 gas in terms of the peak positions, the peak shape, and the relative intensity. | ||
Interestingly, there have been numerous TEM observations of high densities of gas-containing cells in solids after the solids are implanted with a certain dose of gas ions (such as He+, Kr+, and Xe+) at appropriate temperatures.28–31 In those reports, the gas-containing cells appeared as bright spots at underfocus and as dark spots at overfocus, similar to our TEM observations (Fig. 4). Why do gas atoms/molecules form such a peculiar state in water, as noble gas atoms do in solids?
Note the additional diffraction spots in SAED patterns (Fig. 4d, h, l, p, t and x). These diffraction spots are not commensurate with graphene's lattices and were consistently observed in all water pockets containing this intriguing state. We originally suspected that these spots were contributed by the crystalline structures of gas molecules in the tiny cells. However, they do not form the rings depicted in Fig. 3. Instead, only a few discrete sets of diffraction spots corresponding to certain crystal planes are apparent in Fig. 4, and some spots exhibit rather strong intensity, which should be contributed from crystals of sizes considerably larger than those of the tiny cells. Also, diffraction spots with interplanar spacing (d-spacing) of 2.6–2.8, 3.4, or 3.7–3.9 Å are commonly detected with different gases in this state (Fig. 4). These d-spacing values appear to be consistent with those of hexagonal ice (d-spacing of 2.1, 2.25, 2.7, 3.4, 3.7, and 3.9 Å at 163 K),32 but occasionally we perceived diffraction spots with d-spacing of 4.5–4.7 Å (for example Fig. 4p). Diffraction spots with d-spacing of 2.1 or 2.25 Å for hexagonal ice are not easily distinguished from first-order diffraction spots of graphene (∼2.14 Å).
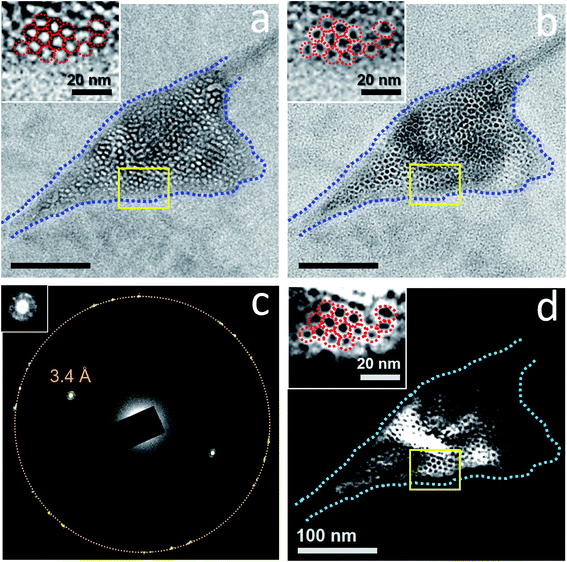
Dark-field TEM imaging of N2-supersaturated water encapsulated in a GLC revealed regions of honeycomb-like structures with water molecules forming a solid matrix hosting the tiny cells (Fig. 6). The SAED pattern contained a pair of strong peaks corresponding to crystals with d-spacing of 3.4 Å (Fig. 6c). Note that in a dark-field TEM image, the crystals that contribute to the diffracted beam appear bright (Fig. 6d). The tiny cells, which appear as white spots at underfocus (Fig. 6a) and as dark spots at overfocus (Fig. 6b), exhibit dark contrast and the surrounding water exhibits bright contrast in the dark-field TEM image (Fig. 6d). Thus, the water molecules surrounding each of the gas-containing cells form crystalline structures, which is characteristic of a clathrate state. Notice that the bright regions in the dark-field TEM image (Fig. 6d) are somewhat co-localized with the dark regions in the bright-field image (Fig. 6b), suggesting diffraction contrast for the crystal grains of the clathrate state in bright-field images.
The region highlighted in Fig. 6 was studied again after the sample was aired for 4 days and before being subjected to TEM again (Fig. 7). The corresponding SAED pattern (Fig. 7a) was very similar to that in Fig. 6c, indicating that the major crystalline structure of the matrix persisted after 4 days. However, bright-field imaging (Fig. 7b) revealed a cell configuration somewhat different from that in Fig. 6b, particularly in terms of the darker regions associated with diffraction contrast. Dark-field TEM imaging visualized a slow change in the matrix configuration over time (Fig. 7c–i); the bright-field image acquired after dark-field TEM imaging (Fig. 7j) also showed some change from Fig. 7b. These observations indicate that this clathrate state is very stable and can survive even after the sample is transferred between a vacuum and ambient air. Notably, this slow change in the detailed matrix configuration occurred even without electron irradiation. However, the change rate of the solid matrix increased with increasing magnification (electron dose rate): when imaged at a magnification that resolves atomic lattices (×250![[thin space (1/6-em)]](https://www.rsc.org/images/entities/char_2009.gif) 000, dose rate ∼340 e− Å−2 s−1), the liquid inside the pockets sometimes drained out within several minutes (Fig. S7†). Given the sensitivity of clathrate structures to high electron flux, we usually imaged the structures at magnifications lower than ×30
000, dose rate ∼340 e− Å−2 s−1), the liquid inside the pockets sometimes drained out within several minutes (Fig. S7†). Given the sensitivity of clathrate structures to high electron flux, we usually imaged the structures at magnifications lower than ×30![[thin space (1/6-em)]](https://www.rsc.org/images/entities/char_2009.gif) 000 (dose rate ∼4.5 e− Å−2 s−1) to minimize the effect of electron irradiation.
000 (dose rate ∼4.5 e− Å−2 s−1) to minimize the effect of electron irradiation.
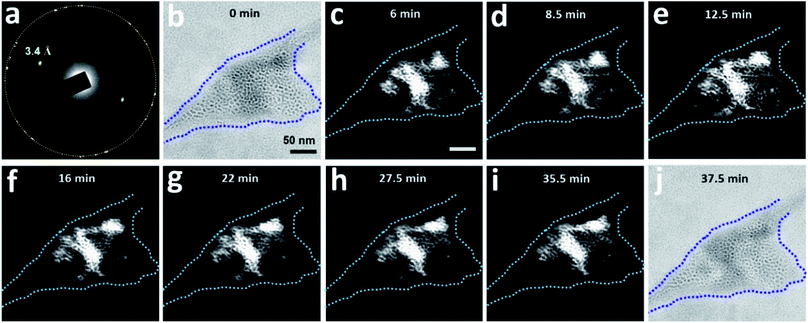 | ||
Fig. 7 Slow dynamics of a clathrate structure for N2-supersaturated water encapsulated in a GLC. The region visualized in Fig. 6 was subjected again to TEM four days after the initial visualization. The sample was tilted slightly (0.1°) around the X-axis. (a) SAED pattern of the region. The orange circle indicates the first-order diffraction spots of the multi-layer graphene. (b) Bright-field image (overfocus) acquired before dark-field TEM imaging. The dashed blue line outlines the pocket containing the clathrate structure. (c–i) Dark-field TEM images acquired from the diffracted beam indicated with d-spacing of 3.4 Å in (a). (j) Bright-field image (overfocus) acquired after dark-field TEM imaging. Magnification was maintained at ×20![[thin space (1/6-em)]](https://www.rsc.org/images/entities/char_2009.gif) 000 throughout image acquisition. 000 throughout image acquisition. | ||
Rotation of the sample revealed more three-dimensional information about the clathrate structures (Fig. 8). After the sample shown in Fig. 7 was aired for 2 days, the SAED pattern (Fig. 8a) was similar to those in Fig. 6c and 7a, indicating that the major crystalline structures of the solid matrix persisted. Bright-field imaging (Fig. 8b) uncovered differences from Fig. 7j, particularly the darker regions associated with the diffraction contrast. The dark-field TEM image (Fig. 8c) also showed some bright regions that co-localized with the dark regions in the bright-field image (Fig. 8b). The dark-field TEM image in Fig. 8c was very different from those taken 2 days earlier (Fig. 7c–i), suggesting considerable water restructuring in the solid matrix. After the sample was tilted to +0.3° around the X-axis and −1.5° around the Y-axis, the SAED pattern showed little change (Fig. 8d), but the bright-field image displayed different contrast (Fig. 8e). The corresponding dark-field TEM image (Fig. 8f) showed a honeycomb-like pattern that differed from that in Fig. 8c. After we tilted the sample further by −3.8° around the Y-axis, strong diffraction spots with d-spacing of 2.6 Å appeared in the SAED pattern of the same pocket (Fig. 8g; the corresponding bright-field image appears in Fig. 8h). The dark-field TEM image acquired from the diffracted beam indicated by d-spacing of 2.6 Å also contained honeycomb-like patterns (Fig. 8i) but with a spatial distribution different from those seen in Fig. 8c and f. Together, these data indicate that the clathrate structure inside the pocket is composed of several grains of crystals with different orientations.
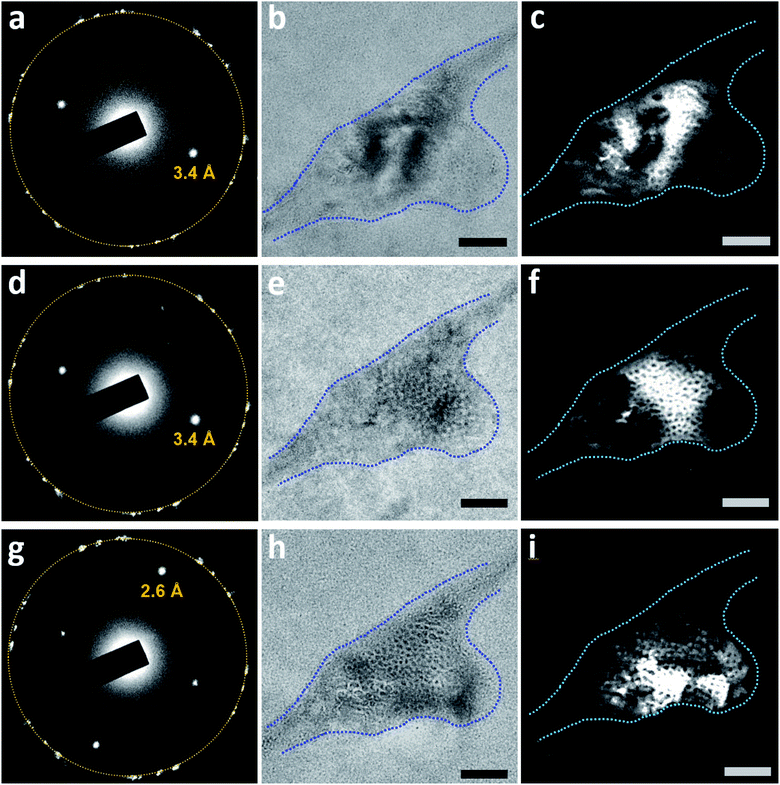 | ||
| Fig. 8 Bright-field and dark-field TEM imaging of a clathrate structure in N2-supersaturated water upon sample rotation. The depicted region is that shown in Fig. 7, 2 days later. (a) SAED pattern of the region. The orange circle indicates the first-order diffraction spots of the multi-layer graphene. (b) Bright-field image (in focus) acquired before dark-field TEM imaging. The blue dashed lines outline the pocket containing the clathrate structure. (c) Dark-field TEM image acquired from the diffracted beam indicated with d-spacing of 3.4 Å in (a). (d) SAED pattern of the region after the sample was tilted to +0.3° around the X-axis and −1.5° around the Y-axis. (e) Bright-field image (in focus) after the sample was tilted. (f) Dark-field TEM image acquired from the diffracted beam indicated with d-spacing of 3.4 Å in (d). (g) SAED pattern of the region after the sample was tilted to +0.3° around the X-axis and −5.3° around the Y-axis. (h) Bright-field image (overfocus) after the sample was tilted. (i) Dark-field TEM image acquired from the diffracted beam indicated with d-spacing of 2.6 Å in (g). Scale bars: 100 nm. | ||
The honeycomb-like structures were consistently detected via dark-field TEM imaging of GLCs containing gas-supersaturated water when the sample was tilted to certain orientations such that the diffraction spots were very bright (Fig. S8–S11†). We often saw a ring surrounding the major diffraction spots associated with the clathrate state; sometimes the ring was composed of several small and weak spots (inset in Fig. 6c), suggesting lattice-like superstructures. The radius of the ring was consistent with the average spacing between cells.
The clathrate structure usually occupied nearly the entire pocket (Fig. 4 and 6), although there were occasions where the clathrate structures occupied <50% of a water pocket (Fig. 9). These clathrate structures coexist with liquid water (Fig. S9 and S10†).
Discussion
The clathrate state detected here in GLCs differs from typical gas clathrates (gas hydrates),33–35 which have been studied for many decades. The latter exist at temperatures well below room temperature and at pressures considerably higher than 1 atm; the former exist under ambient conditions. The latter have very small cages (or cells, <1 nm) and the structures exhibit good long-range order and can grow to a macro size; the former have poor long-range order and seem to have a finite size (typically <1 μm). The SAED patterns and dark-field TEM images of this new clathrate state clearly indicate that water molecules form crystalline structures surrounding the gas-containing cells. It remains difficult to fully determine the detailed crystalline structures of water surrounding the cells. While most of the d-spacings obtained from SAED patterns are similar to those in hexagonal ice at −110 °C,32 occasionally we found diffraction spots with d-spacing of 4.5–4.7 Å. We therefore currently do not know whether there is more than one type of crystal in the clathrate state. There are many water ice structures under various thermodynamic conditions, but those are bulk ice structures with no or few broken water hydrogen bonds. Crystalline water structures in the clathrate state consist of interfacial water surrounding and/or between the gas-containing cells; thus, many broken hydrogen bonds and structural relaxation can be expected. It is highly likely that water in the clathrate state forms new crystalline water structures that are distinct from previous ice structures. Further experimental and theoretical endeavors will be needed to elucidate this issue.We still do not know the states adopted by the gas molecules inside the cells (cages) or the percentage of gas in the clathrate state. The EELS spectra for sulfur (Fig. 5b) is somewhat different from the spectra of SF6 gas (Fig. 5d),27 indicating that SF6 in the clathrate state is not in the vapor phase. It has been claimed that Z-contrast is dominant in in-focus TEM images and that the defocused images feature phase-contrast.31 The low contrast for those tiny cells in our in-focus images suggests that the gas molecules may be in a condensed form with a mass density close to that of the surrounding water. When we performed EELS on the clathrate structures from N2-, Ar-, and Xe- supersaturated water, no spectra associated with N, Ar, or Xe were detected. Spectra associated with the oxygen K-edge (Fig. 5c) were consistently detected in all clathrate structures, indicating that water is the major constituent of the clathrate state. We speculate that the scattering cross sections from N2, Ar, and Xe may not be as large as that from S (SF6) and that the gas concentration in the clathrate state is not high. Further experiments using methods with higher sensitivity will be needed to determine the ratio of gas in the clathrate state.
Although we are not certain whether clathrate structures are also present in bulk water, the coexistence of liquid water with the clathrate structures inside the same water pocket (Fig. 9, S9 and S10†) suggests such a possibility. Each clathrate structure may behave like an individual nanoparticle or like a colloid suspended in water. Importantly, the presence of clathrate structures in bulk water may unlock several long-standing puzzles related to gas in water.
Compared with the dissolution of gases in organic solvents, which is well understood,6,7 the dissolution of gases in water exhibits abnormal thermodynamic properties, such as an anomalously large increase in heat capacity, a large decrease in standard enthalpy, and an extremely large loss of entropy.5,36 The unusually large entropy loss suggests a considerably higher degree of solvent ordering for gases in water than in organic solvents, motivating the “iceberg model” in which water forms frozen patches or microscopic “icebergs” around gas molecules.4 Conventionally, gas in water has been assumed to be a homogeneous system with gas molecules behaving as well-dispersed monomers (Fig. S1a†), so the iceberg model depicts an ice-like structure or increased ordering of water around individual gas molecules or small nonpolar solutes. This paradigm was later extended to interpret hydrophobic hydration and even to explain hydrophobic interactions,8,37 which play a pivotal role in many chemical phenomena and biological processes in aqueous solution.5 Since the proposal of the iceberg model in 1945,4 there have been numerous experimental and theoretical investigations of water structuring (hydration) around small nonpolar solutes or hydrophobic parts of large molecules, but most have not supported the existence of ice-like structures surrounding individual hydrophobic solutes or hydrophobic parts of large molecules;5 a few works have supported the iceberg model.38
Recently, Grdadolnik et al. studied liquid water in equilibration with high-pressure gas (Kr, Xe, CH4, and C2H6) using infrared spectroscopy.38 The infrared spectra indicated that, in addition to liquid water, there are structures in which water hydrogen bonds are strengthened to levels observed in ice and clathrates.38 Excitingly, the clathrate structures uncovered here may be the long-sought microscopic “icebergs”, motivating new interpretation of the iceberg model. When the gas concentration in water is well below the saturation level, gas molecules may exist as well-dispersed monomers in liquid water (Fig. S1a†). Since we did not detect any specific features or any crystalline water structures in GLCs containing degassed water (Fig. 1) or partially degassed water (Fig. S4†), there may be no ice-like structures surrounding dispersed gas monomers. However, water with gas concentrations near or above saturation level may not be the homogeneous system of the classic paradigm. The presence of clathrate structures in water may explain the abnormal thermodynamic properties evident upon dissolution of gases in water. It may also explain the enhanced solubility of gas in water with decreasing temperature: clathrate structures are energetically more favorable at lower temperatures.
The clathrate structures reported here may also be the so-called “nanobubbles” in bulk water (also called bulk nanobubbles).3 Total reflectance infrared spectroscopy of nanobubble solutions indicated the presence of hard hydrogen bonds equivalent to those found in ice and gas hydrates.39 It has been reported that bulk nanobubbles 50–500 nm in diameter can be prepared by pressurizing gas in water and then decompressing the water to ambient pressure.40,41 Thus, bulk nanobubbles may be present in the gas-supersaturated water that we prepared here. The hard hydrogen bonds measured by Ohgaki et al.39 are consistent with our clathrate structures. In the many samples we have studied via TEM, bubble-like structures with diameters >50 nm rarely appeared and the clathrate structures were the major structures observed in most water-containing pockets. In addition, the clathrate structures detected here are equivalent in size to bulk nanobubbles.
The existence and stability of bulk nanobubbles have been highly debated. To date, numerous experimental studies have shown that bulk nanobubbles can be stable in water for hours or even weeks.3,39–41 Those studies mainly employed optical methods, which lack the resolution to see detailed structures in “nanobubbles”. Current theories do not support the existence of nanobubbles in water;2,10 small bubbles have very short lifetimes mainly due to the very high interfacial tension of gas bubbles in water. Our clathrate structures have an ice shell, which would have a much smaller interfacial tension with surrounding liquid water and thus be more stable than gas bubbles.
How gas bubbles are nucleated in water is another long-standing puzzle. Bubble nucleation in water occurs much more easily than predicted by theories based on the conventional view of gases dissolved in water.1,42 Many researchers believe that there may be persistent gas micronuclei in water, which may later evolve into gas bubbles under certain conditions, such as decompression, heating, or mechanical agitation. To date, there are no established definitions of micronuclei or explanations of why they are stable. Plesset has argued that small gas bubbles cannot serve as persistent micronuclei due to their poor stability and short lifetime,42 as is the case for bulk nanobubbles. Our clathrate structures may therefore function as persistent micronuclei. It remains to be determined how these clathrate structures may evolve into gas bubbles.
The microscopic structures for gas in water that we report here may also contribute to the efficient capture of oxygen in water by aquatic animals, such as fish. The oxygen concentration in ambient air (276 mg L−1) is ∼34 times higher than that in water (8 mg L−1 at 20 °C); the molecular ratio of oxygen in air (∼20%) is ∼40![[thin space (1/6-em)]](https://www.rsc.org/images/entities/char_2009.gif) 000 times higher than that in water (∼0.0005%); the diffusion constant of oxygen in air (∼20 mm2 s−1) is ∼10
000 times higher than that in water (∼0.0005%); the diffusion constant of oxygen in air (∼20 mm2 s−1) is ∼10![[thin space (1/6-em)]](https://www.rsc.org/images/entities/char_2009.gif) 000 times higher than that in water (∼0.002 mm2 s−1). It is therefore amazing that aquatic animals can capture sufficient oxygen from water. It would be extremely difficult to achieve this capture if all dissolved oxygen molecules were in the well-dispersed monomer form. The formation of gas-containing microscopic structures, particularly clathrate structures, may facilitate such efficient capture.
000 times higher than that in water (∼0.002 mm2 s−1). It is therefore amazing that aquatic animals can capture sufficient oxygen from water. It would be extremely difficult to achieve this capture if all dissolved oxygen molecules were in the well-dispersed monomer form. The formation of gas-containing microscopic structures, particularly clathrate structures, may facilitate such efficient capture.
Conclusion
Our observations of two major states in GLCs indicate that dissolved gas molecules in water may form microscopic structures other than well-dispersed monomers or bubbles, implying intriguing and complex interactions among water and gas molecules. Our observations indicate that water is not simply a solvent for gas molecules: it is a matrix that actively interacts with gas molecules in complex and subtle ways. Understanding the interactions among water and gas molecules may improve our understanding of many fundamental phenomena related to gas in water and open the door to many new applications. Further investigation of the gas-containing microscopic structures in water, their mechanism(s) of formation, and their energetics will be crucial, as will studies of the contributions of temperature, ions, pH, and other molecules to the formation of gas-containing structures in water.Authors' contributions
I.-S. H. initiated the project. W.-H. H. performed experiments. All authors contributed to analyzing the data and writing the manuscript.Conflicts of interest
There are no conflicts to declare.Acknowledgements
We acknowledge technical supports from I.-H. Chen in the advanced nano/micro-fabrication and characterization lab at Academia Sinica, Taiwan. This research was supported by the Ministry of Science and Technology of Taiwan (MOST 106-2112-M-001-025-MY3 and MOST 109-2112-M-001-048-MY3) and Academia Sinica.References
- S. D. Lubetkin, Langmuir, 2003, 19, 2575 CrossRef CAS.
- S. Ljunggren and J. C. Eriksson, Colloids Surf., A, 1997, 129, 151 CrossRef.
- M. Alheshibri, J. Qian, M. Jehannin and V. S. J. Craig, Langmuir, 2016, 32, 11086 CrossRef CAS.
- H. S. Frank and M. W. Evans, J. Chem. Phys., 1945, 13, 507 CrossRef CAS.
- W. Blokzijl and J. B. F. N. Engberts, Angew. Chem., Int. Ed. Engl., 1993, 32, 1545 CrossRef.
- D. D. Eley, Trans. Faraday Soc., 1939, 35, 1421 RSC.
- G. L. Pollack, Science, 1991, 251, 1323 CrossRef CAS.
- P. Ball, Chem. Rev., 2008, 108, 74 CrossRef CAS.
- P. S. Epstein and M. S. Plesset, J. Chem. Phys., 1950, 18, 1505 CrossRef CAS.
- D. Lohse and X. Zhang, Phys. Rev. E: Stat., Nonlinear, Soft Matter Phys., 2015, 91, 031003(R) CrossRef.
- D. Lohse and X. Zhang, Rev. Mod. Phys., 2015, 37, 981 CrossRef.
- M. Blander and J. L. Katz, AIChE J., 1975, 21, 833 CrossRef CAS.
- C.-K. Fang, H.-C. Ko, C.-W. Yang, Y.-H. Lu and I.-S. Hwang, Sci. Rep., 2016, 6, 24651 CrossRef CAS.
- H.-C. Ko, W.-H. Hsu, C.-W. Yang, C.-K. Fang, Y.-H. Lu and I.-S. Hwang, Langmuir, 2016, 32, 11164 CrossRef CAS.
- C.-W. Yang, Y.-H. Lu and I.-S. Hwang, Chin. J. Phys., 2013, 51, 174 CAS.
- J. M. Yuk, J. Park, P. Ercius, K. Kim, D. J. Hellebusch, M. F. Crommie, J. Y. Lee, A. Zettl and A. P. Alivisatos, Science, 2012, 336, 61 CrossRef CAS.
- G. Algara-Siller, O. Lhtinen, F. C. Wang, R. R. Nair, U. Kaiser, H. A. Wu, A. K. Geim and I. V. Grigorieva, Nature, 2015, 519, 443 CrossRef CAS.
- C. Wang, Q. Qiao, T. Shokufar and R. F. Klie, Adv. Mater., 2014, 26, 3410 CrossRef CAS.
- B. H. Kim, J. Yang, D. Lee, B. K. Choi, T. Hyeon and J. Park, Adv. Mater., 2018, 30, 1703316 CrossRef.
- H. Wu, H. Friedrich, J. P. Patterson, N. A. J. M. Sommerdijk and N. de Jonge, Adv. Mater., 2020, 32, 2001582 CrossRef CAS.
- T. Malis, S. C. Cheng and R. F. Egerton, J. Electron Microsc. Tech., 1988, 8, 193 CrossRef CAS.
- J. C. Meyer, A. K. Giem, M. I. Katsnelson, K. S. Novoselov, T. J. Booth and S. Roth, Nature, 2007, 446, 60 CrossRef CAS.
- S. J. Chae, F. Gunes, K. K. Kim, E. S. Kim, G. H. Han, S. M. Kim, H. J. Shin, S. M. Yoon, J. Y. Choi, M. H. Park, C. W. Yang, D. Pribat and Y. H. Lee, Adv. Mater., 2009, 21, 2328 CrossRef CAS.
- Y.-H. Lu, C.-W. Yang, C.-K. Fang, H.-C. Ko and I.-S. Hwang, Sci. Rep., 2014, 4, 7189 CrossRef.
- T. M. Raschke, J. Tsai and M. Levitt, Proc. Natl. Acad. Sci. U. S. A., 2001, 98, 5965 CrossRef CAS.
- D. Chandler, Nature, 2005, 437, 640 CrossRef CAS.
- I. G. Eustatiu, J. T. Francis, T. Tyliszczak, C. C. Turci, A. L. D. Kilcoyne and A. P. Hitchcock, Chem. Phys., 2000, 257, 235 CrossRef CAS.
- S. Thiébaut, B. Décamps, J. M. Pénisson, B. Limacher and A. P. Guégan, J. Nucl. Mater., 2000, 277, 217 CrossRef.
- J. Gao, L. Bao, H. Huang, Y. Li, Q. Lei, Q. Deng, Z. Liu, G. Yang and L. Shi, Nucl. Instrum. Methods Phys. Res., Sect. B, 2017, 399, 62–68 CrossRef CAS.
- H. Zhang, Z. Yao, M. R. Daymond and M. A. Kirk, J. Appl. Phys., 2014, 115, 103509 CrossRef.
- A. H. Mir, J. A. Hinks, J. Delaye, S. Peuget and S. E. Donnelly, Sci. Rep., 2018, 8, 15320 CrossRef.
- M. Kumai, J. Glaciol., 1968, 7, 95 CrossRef.
- J. Lee and J. W. Kenney III, in Solidification, ed. A. E. Ares, IntechOpen, Rijeka, Croatia, 2018, ch. 7 Search PubMed.
- E. D. Sloan, C. A. Koh and C. Koh, Clathrate Hydrates of Natural Gases, CRC Press, Boca Raton, FL, 3rd edn, 2007 Search PubMed.
- B. A. Buffett, Annu. Rev. Earth Planet. Sci., 2000, 28, 477 CrossRef CAS.
- E. Wilhelm, R. Battino and R. J. Wilcock, Chem. Rev., 1977, 77, 219 CrossRef CAS.
- W. Kauzmann, Adv. Protein Chem., 1969, 14, 1 Search PubMed.
- J. Grdadolnik, F. Merzel and F. Avbelj, Proc. Natl. Acad. Sci. U. S. A., 2017, 114, 322 CrossRef CAS.
- K. Ohgaki, N. Q. Khanh, Y. Joden, A. Tsuji and T. Nakagawa, Chem. Eng. Sci., 2010, 65, 1296 CrossRef CAS.
- A. Azevedo, R. Etchepare, S. Calgaroto and J. Rubio, Miner. Eng., 2016, 94, 29 CrossRef CAS.
- S. Ke, W. Xiao, N. Quan, Y. Dong, L. Zhang and J. Hu, Langmuir, 2019, 35, 5250 CrossRef CAS.
- M. S. Plesset, Tensile Strength of Liquids, Report no. 85-47, Division of Engineering and Applied Science, California Institute of Technology, 1969 Search PubMed.
Footnote |
| † Electronic supplementary information (ESI) available. See DOI: 10.1039/d0sc06262f |
| This journal is © The Royal Society of Chemistry 2021 |

