 Open Access Article
Stepwise nitrosylation of the nonheme iron site in an engineered azurin and a molecular basis for nitric oxide signaling mediated by nonheme iron proteins†
Shiliang
Tian‡
 a,
Ruixi
Fan‡
 b,
Therese
Albert
 c,
Rahul L.
Khade
 d,
Huiguang
Dai
 a,
Kevin A.
Harnden
a,
Parisa
Hosseinzadeh
a,
Jing
Liu
a,
Mark J.
Nilges
a,
Yong
Zhang
a,
Kevin A.
Harnden
a,
Parisa
Hosseinzadeh
a,
Jing
Liu
a,
Mark J.
Nilges
a,
Yong
Zhang
 *d,
Pierre
Moënne-Loccoz
 *c,
Yisong
Guo
 *b and
Yi
Lu
 *a
*a
aDepartment of Chemistry, Department of Biochemistry, School of Chemical Sciences Electron Paramagnetic Resonance Lab, University of Illinois at Urbana-Champaign, 600 South Mathews Avenue, Urbana, IL, USA. E-mail: yi-lu@illinois.edu; Tel: +1-217-333-2619
bDepartment of Chemistry, Carnegie Mellon University, 4400 Fifth Avenue, Pittsburgh, PA, USA. E-mail: ysguo@andew.cmu.edu; Fax: +1-412-268-1061; Tel: +1-412-268-1704
cDepartment of Chemical Physiology and Biochemistry, Oregon Health & Science University, 3181 S.W. Sam Jackson Park Road, Portland, OR, USA. E-mail: moennelo@ohsu.edu; Tel: +1-503-346-3429
dDepartment of Chemistry and Chemical Biology, Stevens Institute of Technology, 1 Castle Point Terrace, Hoboken, NJ, USA. E-mail: yzhang37@stevens.edu; Fax: +1-201-216-8240; Tel: +1-201-216-5513
First published on 31st March 2021
Abstract
Mononitrosyl and dinitrosyl iron species, such as {FeNO}7, {FeNO}8 and {Fe(NO)2}9, have been proposed to play pivotal roles in the nitrosylation processes of nonheme iron centers in biological systems. Despite their importance, it has been difficult to capture and characterize them in the same scaffold of either native enzymes or their synthetic analogs due to the distinct structural requirements of the three species, using redox reagents compatible with biomolecules under physiological conditions. Here, we report the realization of stepwise nitrosylation of a mononuclear nonheme iron site in an engineered azurin under such conditions. Through tuning the number of nitric oxide equivalents and reaction time, controlled formation of {FeNO}7 and {Fe(NO)2}9 species was achieved, and the elusive {FeNO}8 species was inferred by EPR spectroscopy and observed by Mössbauer spectroscopy, with complemental evidence for the conversion of {FeNO}7 to {Fe(NO)2}9 species by UV-Vis, resonance Raman and FT-IR spectroscopies. The entire pathway of the nitrosylation process, Fe(II) → {FeNO}7 → {FeNO}8 → {Fe(NO)2}9, has been elucidated within the same protein scaffold based on spectroscopic characterization and DFT calculations. These results not only enhance the understanding of the dinitrosyl iron complex formation process, but also shed light on the physiological roles of nitric oxide signaling mediated by nonheme iron proteins.
Introduction
Nitric oxide (NO) plays important roles in a variety of biological processes, such as neurotransmission, transcriptional regulation, cytotoxicity, immune response signaling, and blood pressure regulation.1 Compared to the in-depth understanding of NO regulation by heme proteins, knowledge of NO signaling mediated by nonheme iron proteins is still lacking, even though the latter is of comparable significance.2,3 Representative examples include NO modulated iron metabolism via activating iron-regulatory protein 1 (IRP1),4 NO inhibition of transcriptional ferric uptake regulation protein (Fur) via nitrosylation of the iron acquisition site,5 and transcription activation of enhancer-binding protein NorR by reversible binding of NO at the mononuclear nonheme iron site.6 NO has also been reported to react with various nonheme iron proteins including ribonucleotide reductase,7,8 ferritin,9 and iron–sulfur cluster proteins.10–13 The reactivities often feature the rapid formation of either mononitrosyl or dinitrosyl iron complexes (DNICs), with DNICs being more common and detected in a vast array of animal tissues and cell cultures.14,15A representative DNIC species is {Fe(NO)2}9, an Enemark–Feltham notation,16 found in both biological systems and synthetic models.17–20 While {Fe(NO)2}9 is structurally well-characterized, the formation mechanism is not fully understood.18,21 Since {Fe(NO)2}9 can be synthesized by reacting ferrous iron with NO, one logical postulation is that its formation may go through an intermediate state of high-spin {FeNO}7, which is also a dominant product from the ferrous iron and NO reaction. Knowledge of the redox behaviors of {FeNO}7 is limited, and the reactivity of its reduced product {FeNO}8 is largely unexplored.22 Pioneered by Wieghardt et al. reporting the first comprehensive characterization of low-spin {FeNO}6–8 complexes,23 a series of {FeNO}6–8 and highly reduced {FeNO}8–10 complexes have been spectroscopically and structurally characterized.24–27 Lehnert's group reported the first series of high-spin {FeNO}6–8 complexes and demonstrated that the redox transformation of high-spin {FeNO}6–8 was iron-based in contrast to that of the corresponding low-spin complexes where the redox transformation was generally NO centered.28 Most recently, Meyer and coworkers synthesized a complete series of five {FeNO}6–10 complexes with one ligand scaffold.29 While significant progress has been made in the chemistry of nonheme iron and NO reaction, the transformation from {FeNO}7 to {Fe(NO)2}9 has been rarely reported. Ford and coworkers have shown that aqueous Fe(II), in the presence of cysteine, can bind with NO, forming an {FeNO}7 complex, which subsequently eliminates a thiyl radical and then coordinates with NO to produce an {Fe(NO)2}9 complex.30 Similar chemistry has been demonstrated in a model system via disproportionation of an {FeNO}7 complex to yield {Fe(NO)2}9 and a ferric species.31
While synthetic inorganic complexes have provided structural and spectroscopic metrics as invaluable complements to the studies of the active sites of metalloproteins, these systems also have limitations like difficulties in incorporating site-specific non-covalent interactions and employing biologically relevant ligands or physiological conditions. Protein-based models and artificial metalloenzymes offer an alternative solution by constructing a metallo-center in a protein scaffold through the design of the coordination sphere.32–41 Azurin (Az) has been demonstrated to be an excellent scaffold for engineering of chemical reactivity or catalytic function, as the engineered Az construct is more conveniently expressed in E. coli rapidly (overnight) and with high yield (>100 mg purified protein per liter growth media), amenable to spectroscopic studies.42–46 In this work, we have constructed {Fe(NO)2}9 in an engineered Az scaffold and elucidated the stepwise nitrosylation pathway from {FeNO}7via {FeNO}8 to {Fe(NO)2}9 for the first time based on spectroscopic characterization and DFT calculations. Our results clarified the electronic and geometric structures of {FeNO}7 and {Fe(NO)2}9 motifs, expanded the knowledge of fundamental reaction mechanisms of endogenous NO, and provided a molecular basis for the physiological roles of NO signaling mediated by nonheme iron proteins.
Results and discussion
Preparation and spectroscopic characterization of Fe(II)-M121H/H46EAz
To elucidate the structural features and the reaction mechanism of the stepwise nitrosylation of nonheme iron sites, we sought to re-design wild type Az to accommodate a mononuclear iron center with conformational flexibility for ligand replacement. M121H/H46EAz was chosen as the protein scaffold based on structural analysis (Fig. 1). The crystal structure of the mutant revealed that the primary coordination sphere of the metal center had a distorted tetrahedral geometry with a τ4 value of 0.72.47 The metal–N(His121) bond length is 2.4 Å, longer than that of the normal M–N bond (∼2.0 Å). Another coordinating residue, Glu46, displayed conformation flexibility (Fig. S1†). The relatively weak coordination of these two residues to the metal center confers the potential of replacement by exogenous ligands like NO.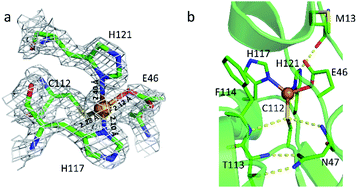 | ||
| Fig. 1 Metal-binding site in M121H/H46EAz. (a) Overlay of the structure and the 2Fo − Fc electron density map. (b) Hydrogen bond interactions around the active site. The backbone of M13 forms a hydrogen bond to the side chain of H121. The backbones of F114 and N47 form hydrogen bonds directly with Cys112. The hydrogen bonds between T113 and N47 are responsible for the rigidity of the metal-binding site (PDB: 4WKX, chain A). | ||
Titrating the apo-M121H/H46EAz with (NH4)2Fe(SO4)2 resulted in the accumulation of an absorption band centered at 330 nm, coinciding with the S(Cys) → Fe(II) ligand to metal charge-transfer (LMCT) band reported in two other engineered nonheme iron sites in Az (Fig. S2A†).43,44 The absorbance at 330 nm reached its maximum after adding one equivalent of (NH4)2Fe(SO4)2 (Fig. S2B†), indicating that the iron-binding site is mononuclear. By fitting the absorbance changes at 330 nm as a function of the total Fe(II) concentration, the dissociation constant (Kd) was determined to be 8 μM (Fig. S2C†). By titrating a known amount of Fe(II) ions into a large excess of apo-M121H/H46EAz, the 330 nm extinction coefficient was determined to be 970 M−1 cm−1 (Fig. S2D†), significantly lower than the reported values of 1800 and 1610 M−1 cm−1 in the other two nonheme iron Az systems.43,44 The result suggests a weak LMCT interaction between S(Cys) and Fe(II), consistent with the long S(Cys)–M bond distance observed in the M121H/H46EAz crystal structure.47 The zero-field Mössbauer spectrum of 57Fe(II)-M121H/H46EAz measured at 4.2 K displays two species with isomer shift δ1 = 0.94 mm s−1, quadrupole splitting |ΔEQ1| = 2.66 mm s−1 (86%), δ2 = 1.23 mm s−1, and |ΔEQ2| = 3.55 mm s−1 (14%) (Fig. S3†), both of which are typical high spin ferrous species. The large difference in Mössbauer parameters (particularly the isomer shift) indicates different ligand environments for these two ferrous species (see the DFT section for the potential structural candidates of these ferrous species).
Generation of {FeNO}7
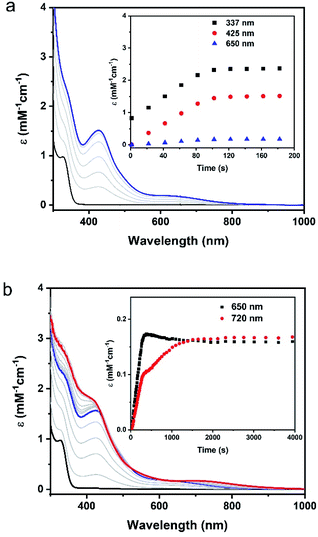
Upon addition of 0.5 equiv. of Proli NONOate, which would release 1 equiv. of NO in solution, the colorless solution of Fe(II)-M121H/H46EAz (0.1 mM) turned yellow immediately at pH 7. Monitoring the reaction by UV-Vis revealed the formation of a new species (1) with strong absorptions at 337 and 425 nm and a weak absorption at 650 nm, which reached a plateau in 2 min and remained stable at room temperature for at least 1 hour (Fig. 2).The EPR (Electron Paramagnetic Resonance) spectrum of the above reaction system at 5 K exhibited two S = 3/2 signals with g values of around 4 and 2 (Fig. S4†), similar to the EPR features of {FeNO}7 species of other nonheme enzymes.48,49 Detailed EPR spectral analysis based on the temperature dependent EPR data revealed different zero-field splitting (ZFS) parameters for the two S = 3/2 species (D and E/D, see Fig. S4 and Table S1† for detailed simulation parameters). With the determination of ZFS parameters of the S = 3/2 {FeNO}7 species, Mössbauer analysis was then carried out on a sample generated by treating Fe(II)-M121H/H46EAz (0.9 mM) with 0.7 eq. of Proli NONOate. Mössbauer spectra of this sample contained ∼20% Fe(II)-M121H/H46EAz (Fig. S5†). The rest of the spectra (∼70%) mainly originated from the S = 3/2 {FeNO}7 species. By subtracting the Fe(II)-M121H/H46EAz component from the raw experimental data, the difference spectra were subject to a detailed analysis (Fig. 3). The evidence of the existence of two S = 3/2 species came from the two resolved absorption peaks at a velocity scale of ∼4–5 mm s−1. Mössbauer simulations of the S = 3/2 {FeNO}7 species were carried out by fixing the D and E/D values on the EPR determined ones. With a large and positive D, the Mössbauer spectra of the two S = 3/2 species measured at 4.2 K exclusively reflect the magnetic properties of the mS = ±1/2 Kramers doublet of the S = 3/2 spin system, where the Mössbauer magnetic features reveal the parameters of the spin system in the x–y plane. Thus, the spectra in Fig. 3 depend primarily on the x and y components of the 57Fe nuclear magnetic hyperfine tensor (Ax and Ay) and of the electric field gradient (EFG) tensor (Vxx and Vyy). Therefore, by simulating Mössbauer spectra collected under multiple applied magnetic field conditions, Ax, Ay, ΔEQ, η, and δ can be determined (Table S1†). However, due to the small E/D values (E/D < 0.05), the Mössbauer spectra measured at 4.2 K are relatively insensitive to the z-component of the magnetic hyperfine tensor (Az), thus a relatively large uncertainty exists for this parameter (Table S1†). Together with the EPR simulations, the Mössbauer simulations revealed that the two {FeNO}7 species gave comparable Mössbauer parameters to those reported for other S = 3/2 {FeNO}7 species in the literature.50–52 However, clear differences between these two {Fe(NO)}7 species were also observed. Specifically, the rhombic {FeNO}7 species (D = 10 cm−1, E/D = 0.033, 30% of the total iron) exhibited a larger isomer shift (δ = 0.60 mm s−1) than that (δ = 0.48 mm s−1) of the axial {FeNO}7 species (D = 6 cm−1, E/D = 0.007, 40% of the total iron), and larger A values. This type of difference has previously been observed in the two {FeNO}7 species of isopenicillin N synthase (IPNS), where the IPNS·NO complex gave larger δ and A values than the IPNS·ACV·NO complex (ACV: (L-α-amino-δ-adipoyl)-L-cysteinyl-D-valine).50 The authors suggested that these differences were due to the direct binding of the thiolate ligand from ACV to the iron center in the IPNS·ACV·NO complex. A similar ligand binding situation may be encountered here. Namely, Cys ligation exists in the axial {FeNO}7 species, but not in the rhombic {FeNO}7 species. This is further confirmed by the DFT calculations included in this study (vide infra). Therefore, species 1 is tentatively considered as a mixture of protein bound {FeNO}7 with different binding modes.53 Further investigation by using freeze-quench coupled Mössbauer analysis suggested that the conversion of Fe(II)-M121H/H46EAz to {FeNO}7 species is rapid after NO treatment, as Fe(II)-M121H/H46EAz is completely converted to the axial {FeNO}7 species at 10 s, the first time point used in the freeze quench experiment (Fig. S6†). However, the rhombic {FeNO}7 forms much more slowly and is likely converted from the axial {FeNO}7 species. At 100 s after the initial NO exposure, the ratio of the two {FeNO}7 species is ∼70![[thin space (1/6-em)]](https://www.rsc.org/images/entities/char_2009.gif) :
:![[thin space (1/6-em)]](https://www.rsc.org/images/entities/char_2009.gif) 30 (axial vs. rhombic). Finally, an additional species was detected by Mössbauer, accounting for ∼10% of the total Fe in the sample (Fig. 3). The magnetic field dependent behavior of this minor species suggests that it is an integer spin system (vide infra).
30 (axial vs. rhombic). Finally, an additional species was detected by Mössbauer, accounting for ∼10% of the total Fe in the sample (Fig. 3). The magnetic field dependent behavior of this minor species suggests that it is an integer spin system (vide infra).
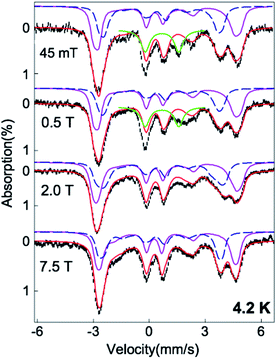 | ||
| Fig. 3 4.2 K variable field Mössbauer spectra of the Fe(II)-M121H/H46EAz complex treated with NO (black) and the spectral simulations (red). The experimental data shown in this figure were obtained by subtracting 20% Fe(II)-M121H/H46EAz spectra from the raw experimental data (see Fig. S5†). The simulations of the two S = 3/2 {FeNO}7 species are shown in purple solid lines (for the E/D = 0.033 species) and blue dashed lines (for the E/D = 0.007 species). The former species accounts for ∼40% of the total iron in the sample, and the latter one accounts for ∼30% of the total Fe. The relative ratio of the two {FeNO}7 species (40/30) determined by Mössbauer spectra is consistent with the 56/44 ratio observed in EPR. The green solid lines are the simulation of the {FeNO}8 species, which accounts for ∼10% of the iron in the sample. The magnetic broadening of this minor species observed in the experimental data with field strength > 0.5 T suggests the integer spin nature of this species. See the main text and Table S1† for detailed simulation parameters. | ||
Conversion of {FeNO}7 to {Fe(NO)2}9 and spectroscopic characterization
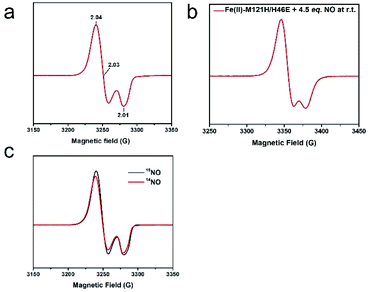
Upon addition of 2 equiv. of Proli NONOate to {FeNO}7 (species 1), a new species (2) with strong absorbance at 330 and 400 nm and a weak feature centered around 720 nm was developed (Fig. 2). Adding 1 equiv. of dithionite in addition to the excess NO would accelerate the formation of species 2 (Fig. S7†). Therefore, the excess NO at least partially functioned as a reductant, and species 2 is likely a reduced product of {FeNO}7.The EPR spectrum of the above reaction system containing species 2 measured at 30 K displayed an S = 1/2 signal with g = 2.04, 2.03, and 2.01 (Fig. 4a). The signal remained the same after the sample underwent buffer exchange with a 10 kDa filtration membrane, indicating that the signal is associated with the protein scaffold (Fig. S8†). Unlike the isotropic signal observed in iron nitrosyl species in small molecule complexes, which can be attributed to fast tumbling of the small molecules and consequent averaging of g values in all directions,54 the g tensor of species 2 remained anisotropic at room temperature (Fig. 4b), further indicating that the signal is associated with the protein. Temperature-dependent EPR spectra showed a typical signal temperature correlation of metal species, i.e. the intensity of the signal increased with decreasing temperature (Fig. S9†). Power saturation measurements gave a half-saturation power of 1.6 mW at 40 K (Fig. S10†), further confirming that the g ∼ 2 signal is associated with a metal ion rather than with a free radical, since the latter usually exhibits smaller half-saturation power due to slow spin relaxation.55
Due to the relatively fast relaxation and complicated spectral interpretation, the ENDOR experiment on the S = 3/2 {FeNO}7 species was not performed. Instead, we probed its structure by labeling it with 15NO and characterizing the resulting species 2 by EPR, Mössbauer and Q-band ENDOR. Little change was observed in the 15NO sample spectrum compared to that of the 14NO sample (Fig. 4c), suggesting that the hyperfine coupling constant between Fe and NNO was very small. The observation points to the possibility that species 2 contains {Fe(NO)2}9, because a large N hyperfine coupling was reported for low-spin {FeNO}7 species,56 while a small N hyperfine coupling was observed in {Fe(NO)2}9.21 Simulations of the Mössbauer spectra of species 2 collected under multiple magnetic fields revealed a paramagnetic hyperfine structure with δ = 0.25 mm s−1 and ΔEQ = −1.32 mm s−1 fitted with an S = 1/2 spin Hamiltonian (see more comments in the ESI text and Fig. S11 and S12†). This isomer shift is consistent with those reported for other {Fe(NO)2}9 species,57 further corroborating the assignment.
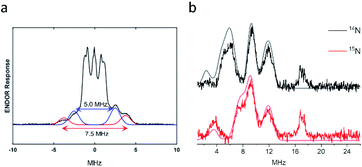
In order to obtain the hyperfine tensors and structural information for the {Fe(NO)2}9 species 2, we employed electron nuclear double resonance (ENDOR) spectroscopy, previously proven to be a powerful tool to resolve EPR interactions of DNICs.57 Q-band ENDOR spectra of the {Fe(NO)2}9 species were recorded at 1206.9 mT by irradiation in the gz direction at 30 K. Two types of resonances were observed due to existence of two distinct nuclei. The resonance centered at 51.4 MHz (set as zero), the Larmor frequency of the 1H nucleus at the Q band, arises from hydrogen nuclei (Fig. 5a). Two pairs of 1H-ENDOR signals were observed with A‖ values of 5.0 and 7.5 MHz, indicating the interactions of two different protons with the electron spin. Based on the structure of the first coordination sphere of the protein scaffold, the signals are attributed to the two β hydrogens of Cys112. The resonances found between 1 and 15 MHz can be attributed to nitrogen hyperfine interactions (Fig. 5b). Since the pattern of 14N resonances is not amenable to analysis by itself because of quadrupolar interactions,58 the ENDOR spectrum of {Fe(15NO)2}9 species was recorded under the same conditions as for the unenriched 14NO sample to differentiate the resonances between NNO and NHis (Fig. 5b). The resonances at 9.2 and 11.9 MHz remained the same in both samples prepared from 14NO or 15NO, indicating that they were due to the hyperfine interactions of His residues in the first coordination sphere. In contrast, the resonances at around 6.0 MHz completely vanished and new bands at 3.6 and 7–8 MHz were observed, suggesting that these signals were from the hyperfine interactions of the NNO nucleus. ENDOR spectra of the {Fe(NO)2}9 species irradiated at different magnetic fields were also collected and simulated (Fig. S13 and Table S2†). Based on the simulation, the averaged N hyperfine interaction from His was 12.0 MHz, significantly larger than the averaged N hyperfine interaction of 6.6 MHz from NO. In other words, the principal value of the hyperfine tensor is smaller than the corresponding linewidth, which explains the minimal change observed in CW-EPR when replacing 14NO with 15NO (Fig. 4c). Our results are in good agreement with the hyperfine coupling constants observed in an Fe(NO)2(adenine)(cysteine methyl ester) complex at room temperature under physiological conditions, with A14N-adenine = 12.3 MHz, A14NO = 5.9 MHz and AβH-cysteine = 5.9 MHz,59 which further supports the assignments of one His, one Cys and two NO in the first coordination sphere of our DNIC.
Vibrational spectroscopic studies of the conversion of {FeNO}7 (1) to {Fe(NO)2}9 (2)
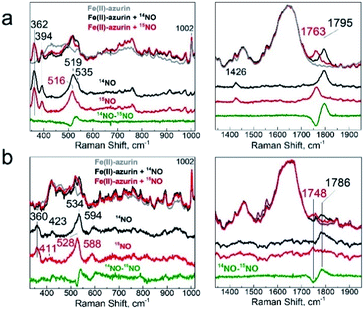
To further explore the structures of the nitrosyl iron species, we utilized resonance Raman (RR) and Fourier transform infrared spectroscopy (FT-IR). RR spectra of the {FeNO}7 adduct obtained with a 457 nm laser excitation showed Fe–NO and N–O stretching modes at 519/535 and 1795 cm−1 that downshifted to 516 and 1763 cm−1, respectively, with 15NO (Fig. 6a), as expected for ν(Fe–NO), δ(Fe–N–O), and ν(N–O) modes (Table S3†).24,60,61 Resonance enhanced bands at 362 and 394 cm−1 were unaffected by the labeling of NO and are assigned to modes dominated by Fe–SCys stretching contributions since these frequencies match prior reports for ν(Fe–Scys) modes in heme-thiolate and nonheme iron proteins with one Cys ligand;60,62,63 in contrast, Fe–NHis modes are typically observed between 190 and 280 cm−1.63,64 Another resonance-enhanced band at 1426 cm−1 that did not shift with NO labeling may correspond to a ring vibration from coordinating His in the {FeNO}7 chromophore. Thus, while the magnetic studies described above identified two {FeNO}7 conformers at cryogenic temperatures, the RR spectra of species 1 showed that a single conformer is present at room temperature since a single set of vibrations is detected for the Fe–N–O unit with retention of a Cys and His ligands within the {FeNO}7 coordination sphere.RR spectra of the {Fe(NO)2}9 species (also obtained with a 457 nm excitation) displayed bands at 423, 534, 594, and 1786 cm−1 that downshifted in {Fe(15NO)2}9 to 417, 528, 588, and 1748 cm−1, respectively (Fig. 6b). The intense 534 cm−1 band is assigned to the νs(NNO–Fe–NNO) and weaker 595 and 423 cm−1 bands to νas(NNO–Fe–NNO) and δ(NNO–Fe–NNO) modes, respectively.57 The only N–O stretching mode observed in the high-frequency region at 1786 cm−1 is assigned to νs(NO). The lack of resonance enhancement of a νas(NO) mode at lower frequency supports a highly symmetric structure of the complex. An additional resonance enhanced band at 360 cm−1 that shows no sensitivity to 15NO-labeling likely corresponds to a ν(Fe–SCys) mode, indicating that the Cys ligand is retained in the {Fe(NO)2}9 cluster, consistent with the 1H-ENDOR result. Overall, these RR frequencies are consistent with the formation of an {Fe(NO)2}9 species (Table S3†).57,61,65
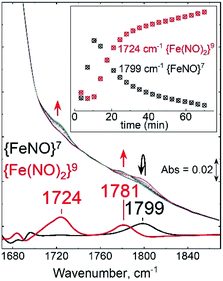
After establishing the RR signatures of the {FeNO}7 and {Fe(NO)2}9 species, room-temperature FT-IR was used to monitor the reaction of Fe(II)-M121H/H46EAz with excess DEA-NONOate. An initial growth at 1799 cm−1 matches the RR frequency of the ν(NO) mode of the {FeNO}7 complex (Fig. 7). As the decay of DEA-NONOate proceeds and the NO concentration increases, the 1799 cm−1 band from the {FeNO}7 species decreased in favor of two new bands at 1724 and 1781 cm−1 assigned to νas(NO) and νs(NO) of the {Fe(NO)2}9 complex. These data clearly identify the {FeNO}7 species as a precursor to the dinitrosyl {Fe(NO)2}9 complex.
Evidence of the nonheme {FeNO}8 species involved in DNIC formation
To understand the inter-conversion of {FeNO}7 and {Fe(NO)2}9 species as a function of NO concentration, we performed a NO titration EPR experiment. A series of EPR samples with a fixed amount of M121H/H46EAz (0.4 mM) and varying amounts of NO (from 0.5 eq. to 5 eq. of NO relative to the protein) were frozen at t = 5 min for measurement. Spin quantification of the titration samples revealed partial conversion of both {FeNO}7 species to the {Fe(NO)2}9 species and accumulation of the {Fe(NO)2}9 species up to ∼40% in the sample treated with 5 eq. of NO (Fig. S14 and Table S4†). Further data analysis revealed that at >1 eq. of NO, {FeNO}7 not only converted to {Fe(NO)2}9, but also to a new EPR silent species (3) accounting for ∼10% of total Fe (based on the difference between the total spin concentration of the EPR active species and the initial concentration of Fe(II)-M121H/H46EAz used in the titration experiment).Compared to EPR, Mössbauer spectroscopy is a general method for quantitatively determining the different iron species regardless of their spin states. The Mössbauer spectrum of the NO treated Fe(II)-M121H/H46EAz displayed mixed features from axial and rhombic {FeNO}7 species, and the EPR silent species 3 (Fig. 3). Subtracting the first two species revealed a quadrupole doublet (∼10% of the total iron) under low field conditions with spectral features of δ = 0.66 mm s−1 and |ΔEQ| = 1.82 mm s−1 determined under a zero-field measurement (Fig. 8 and S15†), which are significantly different from the parameters of both the high-spin Fe(II) starting material and the reported {Fe(NO)2}10 species with small positive isomer shifts.66 Although variable-field Mössbauer measurements cannot be applied to reveal the exact spin state of this unique iron species due to its low percentage, it is clear that species 3 has an integer spin ground state, as evidenced by the characteristic magnetization behavior even at an applied magnetic field of 0.5 T (see the broadening of the high energy line of this quadruple doublet measured at 0.5 T compared with the same spectral feature measured at 45 mT shown in Fig. 3). Thus, based on the Mössbauer behavior, we tentatively assigned species 3 to an {FeNO}8 (S = 1) species.
To test the hypothesis of {FeNO}8 species, we employed cryogenic radiolytic reduction at 77 K (or cryoreduction) to perform controlled one-electron reduction from {FeNO}7.52 After cryoreduction, ∼5% of the axial {FeNO}7 species was converted to a new species exhibiting a quadruple doublet having δ = 0.77 mm s−1 and |ΔEQ| = 2.20 mm s−1 (species 3′, Fig. 8). Interestingly, the Mössbauer parameters of species 3′ are different from those of the original {FeNO}8 (species 3, δ = 0.66 mm s−1 and |ΔEQ| = 1.82 mm s−1) observed in the NO-treated samples. This suggests that the structure of the original {FeNO}8 may be subtly different from those of the {FeNO}7 species.
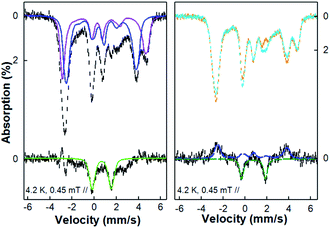 | ||
| Fig. 8 4.2 K 45 mT Mössbauer spectra of the NO treated Fe(II)-M121H/H46EAz complex before and after cryoreduction. Left panel: top, the spectrum measured on NO treated Fe(II)-M121H/H46EAz before (black dashed line) cryoreduction and the spectral components of the axial (blue line) and the rhombic (purple line) {FeNO}7 species; bottom, the difference spectrum (black dashed line) after subtracting the {FeNO}7 species simulations from the experimental spectrum and the spectral simulation of the {FeNO}8 (species 3, green line). Right panel: top, the spectrum of the same sample shown in the left panel measured before (orange dashed line) and after (cyan line) cryoreduction; bottom, the difference spectrum obtained by subtracting the after-cryoreduction spectrum from the before-cryoreduction spectrum (black dashed line) and the simulations for the decreased axial (blue dashed line) {FeNO}7 species and the increased new {FeNO}8 species, species 3′ (green dashed line). The sample was prepared by anaerobically adding 1 eq. of Proli NONOate (from 50 mM Proli NONOate stock solution in 10 mM NaOH) into 600 μl 2 mM 57Fe(II)-M121H/H46EAz solution under stirring and then freezing in liquid nitrogen for 5 min. See the main text and the ESI† for the simulation parameters. | ||
To investigate whether the {FeNO}8 species is an intermediate or an off-sequence byproduct of the reaction, we analyzed the time-dependent optical absorption spectra shown in Fig. 2 using the singular value decomposition (SVD) method. Specifically, by using a kinetic model that includes {FeNO}8 species as an intermediate (Model 1) and comparing with the experimental data, we can readily identify that three out of the four spectra are from Fe(II)-Az, {FeNO}7 and {Fe(NO)2}9 (Fig. S16A†). The fourth reconstructed spectrum can then be assigned to {FeNO}8. Based on this kinetic model and simulated rate constants, we found that the formation rate of {FeNO}8 is significantly slower than its decay rate, leading to a maximum accumulation of the {FeNO}8 species of ∼10% at ∼500 s in the presence of excess NO. This predicated level of accumulation is consistent with the amount of integer spin species observed in the quantitative EPR and Mössbauer analysis. In contrast, if we don't include {FeNO}8 species as an intermediate (Model 2), the fit to the experimental data is worse than for Model 1, especially in the time range between 100 s and 1000 s where the presumed {FeNO}8 accumulates the most (Fig. S16B†), indicating that the presumed {FeNO}8 species is an intermediate in the stepwise nitrosylation of the engineered nonheme iron site.
Calculation of Mössbauer properties
DFT calculations have been successfully applied in investigating Mössbauer parameters of nonheme Fe proteins and models.24,29,31,67–72 Here, we extended such kind of investigation to consolidate the spin states and determine the coordination environments of all three nitrosyl iron complexes, especially the {FeNO}8 species.As shown in Table 1, using the crystal structure of Cu(II)-M121H/H46EAz (Fig. 1) as the starting point and replacing Cu(II) with Fe(II), our DFT calculation method is able to predict δ of the NO-free, four-coordinate Fe(His)2(Cys)(Glu) (A in Fig. 9), showing excellent agreement with the experimentally observed parameters of the major species, with an error of 0.05 mm s−1. This result confirms our assumption that the structure of Fe(II)-M121H/H46EAz is very similar to that of Cu(II)-M121H/H46EAz. The Mulliken spin density (ρFeαβ) of ∼4 unpaired electrons clearly showed the Fe(II) high spin nature. From the starting Fe(His)2(Cys)(Glu) model, three four-coordinate {FeNO}7 could be built by replacing His, Glu or Cys with the incoming NO one at a time (C–E in Fig. 9). For the rhombic {Fe(NO)}7 species, the Fe(NO)(His)2(Glu) (E) model has only 0.01 mm s−1 error for δ calculation and 0.00 mm s−1 error for ΔEQ prediction. For the axial {Fe(NO)}7 species, both Fe(NO)(His)(Cys)(Glu) (C) and Fe(NO)(His)2(Cys) (D) models have excellent isomer shift predictions (0.03 mm s−1 error), but the prediction error of the absolute value of ΔEQ for C is only half of that for D, although both errors are small (<∼0.30 mm s−1, Table 1). Additional calculations showed that five- and six-coordinate {FeNO}7 models become effectively the four-coordinate species after geometry optimization (see the ESI† for more details). These results suggest that the {FeNO}7 complexes shall be four-coordinate, and Fe(NO)(His)(Cys)(Glu) (C) and Fe(NO)(His)2(Glu) (E) may be the axial and rhombic {FeNO}7 species, as detected experimentally (species C might be more likely than D to be the axial species, because species C and its corresponding reduction product in the next step have slightly better agreement with experimental Mössbauer data (vide infra), and its formation is thermodynamically more favorable by ΔG of 19.74 kcal mol−1 than model D; see Table S5†). For model C, the predicted NO vibrational frequency of 1777 cm−1 is also in good agreement with that from the experiment: 1799 cm−1. Using Fe(NO)2(His)(Cys) (F) as a model, both the experimental δ and absolute value of ΔEQ were well reproduced in the calculations (Table 1), consistent with the inferences from ENDOR studies which point to the possible {Fe(NO)2}9 coordination by one His and one Cys (Fig. 5). The two NO moieties are bent toward each other (F in Fig. 9), which is similar to the NO orientations observed in X-ray structures of small dinitrosyl iron complexes.54 The spin density analysis indicates an antiferromagnetic coupling of Fe(I) (S = 3/2) with two NO radicals (Table 1). Additional calculations of five- and six-coordinate {Fe(NO)2}9 models all ended up with effectively four-coordinate systems. These results, together with the spectroscopic studies described above, demonstrate that this protein environment strongly prefers four-coordination for iron, and the best model for the {Fe(NO)2}9 system is Fe(NO)2(His)(Cys) (F), consistent with the experimental results. For this model, the average error of the predicted two NO vibrational frequencies is 23 cm−1, ∼1% of the experimental data (see Table 1), which again shows that this is a reasonably good model.
| Model | System | S | δ Fe (mm s−1) | ΔEQ (mm s−1) | ν NO (cm−1)a | ρ Feαβ (e) | ρ NO1αβ (e) | ρ NO2αβ (e) | |
|---|---|---|---|---|---|---|---|---|---|
| a The νNO values measured by room-temperature FT-IR are used here. b Its asymmetry parameter is ∼1.0, so the sign is uncertain. c Different NO orientations (two linear NO, two NO bent toward each other, two NO bent away from each other, and side-on NO) and Fe/NO spin coupling patterns (Fe (S = 2) anti-ferromagnetically coupled to NO− (S = 1) and NO+ (S = 0); Fe(S = 2) anti-ferromagnetically coupled to two NO (S = 1/2)) were examined and yielded the same results here. d Here, the two NO bend toward the same side. The first two NO bent toward each other and side-on conformations yielded the same results. Different initial Fe/NO spin coupling patterns (Fe (S = 2) anti-ferromagnetically coupled to NO− (S = 1) and NO+ (S = 0); Fe (S = 2) anti-ferromagnetically coupled to two NO (S = 1/2); Fe (S = 3/2) anti-ferromagnetically coupled to NO (S = 1/2) and NO− (S = 0); Fe (S = 5/2) anti-ferromagnetically coupled to NO− (S = 1) and NO (S = 1/2)) also yielded the same result after geometry optimization. e Two NO bent away from each other. | |||||||||
| Fe( II )-Az | 2 | Expt. (86%) | 0.94 | 2.66 | |||||
| 2 | Expt. (14%) | 1.23 | 3.55 | ||||||
| A | Fe(His)2(Cys)(Glu) | 2 | Calc. | 0.89 | 3.17 | 3.682 | |||
| B | Fe(His)2(Cys)(Glu) (H2O) | 2 | Calc. | 1.05 | 2.97 | 3.700 | |||
| {FeNO} 7 | 3/2 | Expt. (30%) | 0.47 | −1.00b | |||||
| 3/2 | Expt. (40%) | 0.60 | −1.60 | 1799 | |||||
| C | Fe(NO)(His)(Cys)(Glu) | 3/2 | Calc. | 0.44 | 1.16 | 1777 | 3.487 | −1.035 | |
| D | Fe(NO)(His)2(Cys) | 3/2 | Calc. | 0.44 | 0.68 | 1820 | 3.426 | −0.946 | |
| E | Fe(NO)(His)2(Glu) | 3/2 | Calc. | 0.61 | −1.60 | 1820 | 3.661 | −0.992 | |
| {Fe(NO) 2 } 9 | 1/2 | Expt. | 0.26 | 0.83b | 1724/1781 | ||||
| F | Fe(NO)2(His)(Cys) | 1/2 | Calc. | 0.20 | 0.95 | 1757/1794 | 2.723 | −0.977 | −1.013 |
| Expt. | 0.66 | 1.82 | |||||||
| Expt′. | 0.77 | 2.20 | |||||||
| {Fe(NO) 2 } 8 | |||||||||
| G | Fe(NO)2(His)(Cys) | 1 | Calc.c | 0.26 | 0.53 | 2.732 | −0.799 | −0.734 | |
| H | Fe(NO)2(His)(Cys) | 0 | Calc. | 0.01 | 1.08 | 0.000 | 0.000 | 0.000 | |
| I | Fe(NO)2(His)(Cys)(Glu) | 1 | Calc.d | 0.37 | 0.82 | 2.134 | −0.857 | 0.550 | |
| J | Fe(NO)2(His)(Cys)(Glu) | 1 | Calc.e | 0.45 | −0.84 | 2.265 | −0.548 | 0.323 | |
| {FeNO} 8 | |||||||||
| K | Fe(NO)(His)(Cys)(Glu) | 1 | Calc. | 0.72 | 2.35 | 3.063 | −1.240 | ||
| L | Fe(NO)(His)2(Cys) | 1 | Calc. | 0.64 | 2.15 | 3.026 | −1.191 | ||
| M | Fe(NO)(His)2(Glu) | 1 | Calc. | 0.80 | 1.69 | 3.124 | −1.232 | ||
| N | Fe(NO)(His)2(Cys) | 0 | Calc. | 0.38 | 2.48 | 0.000 | 0.000 | ||
| O | Fe(NO)(His)2(Glu) | 0 | Calc. | 0.35 | −3.10 | 0.000 | 0.000 | ||
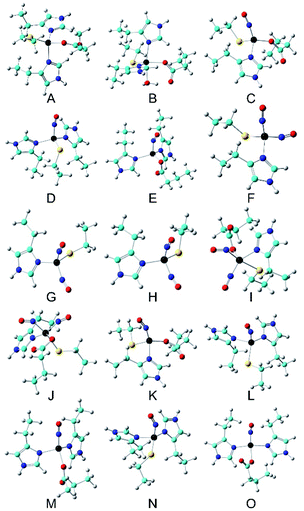 | ||
| Fig. 9 Optimized active site structures (A–O). Color scheme: C – cyan, Fe – black, N – blue, O – red, S – yellow, H – grey. | ||
We then investigated the possible {FeNO}8 models (additional calculations in the ESI† indicate that the alternative {Fe(NO)2}8 based models G–J are unlikely the intermediates toward the {Fe(NO)2}9 system in our experiments). Because this motif differs from the four-coordinate {FeNO}7 precursor by one electron, we evaluated three four-coordinate {FeNO}8 models (K–M) from three four-coordinate {FeNO}7 precursors (C–E) to provide a comprehensive comparison. Interestingly, Fe(NO)(His)(Cys)(Glu) (K in Fig. 9), which could be a precursor of the {Fe(NO)2}9 species of Fe(NO)2(His)(Cys) (F) and is a product of the axial {FeNO}7 species C, produced only 0.05 mm s−1 error in the δ prediction for the experimentally observed species 3′; the {FeNO}8 species was observed only in the cryoreduced sample (Table 1), which has better agreement with the experiment compared with the 0.13 mm s−1 error for Fe(NO)(His)2(Cys) (L), another likely precursor for the subsequent {Fe(NO)2}9 species F. While ΔEQ predictions for both possible precursors are in good agreement with the experiment, the formation of K is thermodynamically more favorable than L by ΔG of 10.20 kcal mol−1 (Table S5†). The other S = 1 {FeNO}8 species (M) with a ligand set from the rhombic {FeNO}7 precursor (E) has δ and ΔEQ predictions close to the experimental data for species 3 (see Table 1). Because of the ligand set difference, this species is not involved in the formation of the subsequent {Fe(NO)2}9 species Fe(NO)2(His)(Cys). Since the experimental Mössbauer experiment alone cannot firmly determine its spin state, a few S = 0 four-coordinate {FeNO}8 complexes (N–O) were also investigated. However, they have much worse predictions for both δ and ΔEQ (Table 1), and higher electronic energies (see the ESI†).
Based on the above results, we propose the following reaction pathway (Fig. 10): the reaction starts with the four-coordinate S = 2 Fe(His)2(Cys)(Glu) as shown in the X-ray structure (Fig. 1), then becomes the S = 3/2 {FeNO}7 four-coordinate Fe(NO)(His)(Cys)(Glu) or Fe(NO)(His)2(Glu) upon NO addition for axial and rhombic species, which then are reduced to the corresponding S = 1 {FeNO}8 four-coordinate systems, and finally Fe(NO)(His)(Cys)(Glu) is further reduced to S = 1/2 {Fe(NO)2}9 Fe(NO)2(His)(Cys). The coordination of His and Cys ligands in {Fe(NO)2}9 is suggested by 1H and 15N ENDOR spectroscopies (Fig. 5). Overall, the average computational errors of all the experimental isomer shifts and quadrupole splitting measured here are only 0.06 and 0.18 mm s−1, respectively.
 | ||
| Fig. 10 Proposed reaction pathway for {Fe(NO)2}9 formation. Color scheme: C – cyan, Fe – black, N – blue, O – red, S – yellow, H – grey. | ||
Previous studies show that the quantitative effect may be small for Mössbauer parameters even with a strong hydrogen bond, like the one between O2 and the second sphere distal His residue in myoglobin with a calculated energy of ∼7 kcal mol−1: it only improves the calculated Mössbauer isomer shift and quadrupole splitting by 0.03 and 0.11 mm s−1, respectively,73 which are about half of the average computational errors here. Since there are three residues (M13, N47, and F114) with distances close to hydrogen bonding interactions with the first sphere coordination ligands (H121 and C112, see Fig. 1b), we chose the model (D) that retains both H121 and C112 and thus could potentially have all these three second-sphere interactions, as an example, to evaluate their potential effects on Mössbauer property predictions. As shown in Table S6,† the calculated Mössbauer isomer shift and quadrupole splitting from D′ which has all these three residues in addition to model D are affected by only 0.02 and 0.11 mm s−1, respectively, basically the same level of small effect as mentioned above. The influence on the predicted NO frequency is 0.4% and the calculated spin densities are changed by ∼1%. Due to the small DFT structural models used here and small differences between some experimental data and computational models, the structural predictions here are tentative and this work does not exclude other structural possibilities or pathways.
In a previous report, we have demonstrated S-nitrosylation in a Cu-bound M121H/H46EAz. In the Fe-bound M121H/H46EAz in the current study, we observed two sets of 1H signals, suggesting the coordination of Cys in {Fe(NO)2}9 in the 1H-ENDOR studies (Fig. 5a). In addition, the resonance enhanced band at 360 cm−1 that shows no sensitivity to 15NO-labeling likely corresponds to a ν(Fe–SCys) mode, indicating that the Cys ligand is retained in the {Fe(NO)2}9 cluster. Therefore, we found no evidence of S-nitrosylation in the Fe system. Since S-nitrosylation is a one-electron oxidation process, where the Cys coordinated metal iron is reduced, the reduction potential Fe(II)/Fe(I) might be too low for S-nitrosylation to proceed compared to Cu(II)/Cu(I). In addition, DFT calculations have revealed that the most plausible pathway for S-nitrosylation is the direct radical reaction of NO with S(Cys) enabled by a highly covalent Cu–S interaction. The Fe–S covalency in the current study may not be as strong to promote S-nitrosylation.
Conclusions
In summary, we have successfully captured three nitrosyl-iron species at the same nonheme iron center in an engineered azurin scaffold: {FeNO}7 with the S = 3/2 ground state, {FeNO}8 with the S = 1 ground state and {Fe(NO)2}9 with the S = 1/2 ground state. Electronic and structural information of the three species has been elucidated by a combination of spectroscopic techniques including UV-Vis, EPR, ENDOR, RR, FT-IR, Mössbauer, and DFT calculations. To the best of our knowledge, this is the first time that stepwise nitrosylation from the Fe(II) starting material to {FeNO}7, {FeNO}8 and then to {Fe(NO)2}9 was observed in the same protein scaffold and the first coordination spheres of the nitrosyl-iron centers were positively identified during each step of NO binding. Stepwise nitrosylation requires the dissociation of a His ligand. Ligand dissociation triggered by conformational changes upon NO binding has been proposed as a mechanism of NO sensing by nonheme iron-containing transcription regulators,3,6,13,74 but a stepwise description of the changes in iron coordination spheres is still absent. Our results with the Az scaffold provide a molecular basis for the formation of dinitrosyl iron complexes and how nitric oxide sensing and signal transduction can proceed in biology.Author contributions
S. T., H. G. and K. A. H. purified the protein. S. T. performed Fe(II) titration, collected the reaction kinetic data, and prepared the EPR and Mössbauer samples. S. T. and M. J. N. collected the CW and pulsed EPR data. R. F. and Y. G. collected the spin counting EPR and Mössbauer data. T. A. and P. M.-L. collected the RR and FT-IR data. R. L. K. and Y. Z. performed the DFT calculations. S. T., R. F., T. A., P. M.-L., Y. G., and Y. L. analysed and discussed all the data. S. T., R. F., T. A., R. L. K., Y. Z., P. M.-L., Y. G., and Y. L. wrote the paper, and all authors discussed the results and commented on the manuscript.Conflicts of interest
The authors declare no competing financial interest.Acknowledgements
We thank the U.S. National Science Foundation (CHE-1710241 to Y. L. and CHE-1654060 to Y. G.) and the U.S. National Institutes of Health (R01GM074785 to P. M.-L. and R15GM085774 to Y. Z.) for financial support. Some EPR data were collected using an X-band EPR spectrometer purchased with funds from the U.S. National Science Foundation under CHE-1726244. We acknowledge Professor Michael Hendrich and Saborni Biswas (Carnegie Mellon University) for helping us with the freeze-quench setup. We also acknowledge the support from Ms. Candace Davison (Radiation Science & Engineering Center, Penn State University, State College) for conducting the Co-60 cryoreduction treatment on our NO treated samples.Notes and references
- L. J. Ignarro and B. A. Freeman, Nitric Oxide: Biology and Pathobiology, Elsevier Academic Press, 3rd edn, 2017 Search PubMed.
- A. R. Butler and I. L. Megson, Chem. Rev., 2002, 102, 1155–1166 CrossRef CAS PubMed.
- I. M. Wasser, S. de Vries, P. Moënne-Loccoz, I. Schröder and K. D. Karlin, Chem. Rev., 2002, 102, 1201–1234 CrossRef CAS PubMed.
- S. L. Wardrop, R. N. Watts and D. R. Richardson, Biochemistry, 2000, 39, 2748–2758 CrossRef CAS PubMed.
- B. D'Autréaux, D. Touati, B. Bersch, J.-M. Latour and I. Michaud-Soret, Proc. Natl. Acad. Sci. U. S. A., 2002, 99, 16619–16624 CrossRef.
- B. D'Autreaux, N. P. Tucker, R. Dixon and S. Spiro, Nature, 2005, 437, 769–772 CrossRef.
- M. Lepoivre, F. Fieschi, J. Coves, L. Thelander and M. Fontecave, Biochem. Biophys. Res. Commun., 1991, 179, 442–448 CrossRef CAS.
- C. J. Haskin, N. Ravi, J. B. Lynch, E. Munck and L. Que, Biochemistry, 1995, 34, 11090–11098 CrossRef CAS PubMed.
- M. Lee, P. Arosio, A. Cozzi and N. D. Chasteen, Biochemistry, 1994, 33, 3679–3687 CrossRef CAS PubMed.
- B. Ren, N. Zhang, J. Yang and H. Ding, Mol. Microbiol., 2008, 70, 953–964 CAS.
- C. E. Tinberg, Z. J. Tonzetich, H. Wang, L. H. Do, Y. Yoda, S. P. Cramer and S. J. Lippard, J. Am. Chem. Soc., 2010, 132, 18168–18176 CrossRef CAS PubMed.
- Y.-M. Kim, H. A. Bergonia, C. Müller, B. R. Pitt, W. D. Watkins and J. R. Lancaster, J. Biol. Chem., 1995, 270, 5710–5713 CrossRef CAS PubMed.
- E. T. Yukl, M. A. Elbaz, M. M. Nakano and P. Moënne-Loccoz, Biochemistry, 2008, 47, 13084–13092 CrossRef CAS.
- D. R. Richardson and H. C. Lok, Biochim. Biophys. Acta, 2008, 1780, 638–651 CrossRef CAS PubMed.
- A. F. Vanin, Nitric Oxide, 2009, 21, 1–13 CrossRef CAS PubMed.
- J. H. Enemark and R. D. Feltham, Coord. Chem. Rev., 1974, 13, 339–406 CrossRef CAS.
- Z. J. Tonzetich, L. E. McQuade and S. J. Lippard, Inorg. Chem., 2010, 49, 6338–6348 CrossRef CAS.
- H. Lewandowska, M. Kalinowska, K. Brzóska, K. Wójciuk, G. Wójciuk and M. Kruszewski, Dalton Trans., 2011, 40, 8273–8289 RSC.
- M.-L. Tsai, C.-C. Tsou and W.-F. Liaw, Acc. Chem. Res., 2015, 48, 1184–1193 CrossRef CAS PubMed.
- R. Pulukkody and M. Y. Darensbourg, Acc. Chem. Res., 2015, 48, 2049–2058 CrossRef CAS PubMed.
- A. F. Vanin, N. A. Sanina, V. A. Serezhenkov, D. S. Burbaev, V. I. Lozinsky and S. M. Aldoshin, Nitric Oxide, 2007, 16, 82–93 CrossRef CAS PubMed.
- N. Lehnert, K. Fujisawa, S. Camarena, H. T. Dong and C. J. White, ACS Catal., 2019, 9, 10499–10518 CrossRef CAS.
- C. Hauser, T. Glaser, E. Bill, T. Weyhermüller and K. Wieghardt, J. Am. Chem. Soc., 2000, 122, 4352–4365 CrossRef CAS.
- C. Kupper, J. A. Rees, S. Dechert, S. DeBeer and F. Meyer, J. Am. Chem. Soc., 2016, 138, 7888–7898 CrossRef CAS PubMed.
- M. J. Chalkley and J. C. Peters, Angew. Chem., Int. Ed., 2016, 55, 11995–11998 CrossRef CAS PubMed.
- A. Dey, A. M. Confer, A. C. Vilbert, P. Moënne-Loccoz, K. M. Lancaster and D. P. Goldberg, Angew. Chem., Int. Ed., 2018, 57, 13465–13469 CrossRef CAS PubMed.
- H. T. Dong, M. J. Chalkley, P. H. Oyala, J. Zhao, E. E. Alp, M. Y. Hu, J. C. Peters and N. Lehnert, Inorg. Chem., 2020, 59, 14967–14982 CrossRef CAS PubMed.
- A. L. Speelman, C. J. White, B. Zhang, E. E. Alp, J. Zhao, M. Hu, C. Krebs, J. Penner-Hahn and N. Lehnert, J. Am. Chem. Soc., 2018, 140, 11341–11359 CrossRef CAS PubMed.
- M. Keilwerth, J. Hohenberger, F. W. Heinemann, J. Sutter, A. Scheurer, H. Fang, E. Bill, F. Neese, S. Ye and K. Meyer, J. Am. Chem. Soc., 2019, 141, 17217–17235 CrossRef CAS PubMed.
- J. C. M. Pereira, A. V. Iretskii, R.-M. Han and P. C. Ford, J. Am. Chem. Soc., 2015, 137, 328–336 CrossRef CAS.
- A. L. Speelman, B. Zhang, A. Silakov, K. M. Skodje, E. E. Alp, J. Zhao, M. Y. Hu, E. Kim, C. Krebs and N. Lehnert, Inorg. Chem., 2016, 55, 5485–5501 CrossRef CAS PubMed.
- Y. Lu, S. M. Berry and T. D. Pfister, Chem. Rev., 2001, 101, 3047–3080 CrossRef CAS PubMed.
- A. G. Tebo and V. L. Pecoraro, Curr. Opin. Chem. Biol., 2015, 25, 65–70 CrossRef CAS PubMed.
- F. Schwizer, Y. Okamoto, T. Heinisch, Y. Gu, M. M. Pellizzoni, V. Lebrun, R. Reuter, V. Köhler, J. C. Lewis and T. R. Ward, Chem. Rev., 2018, 118, 142–231 CrossRef CAS PubMed.
- H. J. Davis and T. R. Ward, ACS Cent. Sci., 2019, 5, 1120–1136 CrossRef CAS PubMed.
- M. T. Reetz, Acc. Chem. Res., 2019, 52, 336–344 CrossRef CAS PubMed.
- A. D. Liang, J. Serrano-Plana, R. L. Peterson and T. R. Ward, Acc. Chem. Res., 2019, 52, 585–595 CrossRef CAS PubMed.
- S. N. Natoli and J. F. Hartwig, Acc. Chem. Res., 2019, 52, 326–335 CrossRef CAS PubMed.
- A. Lombardi, F. Pirro, O. Maglio, M. Chino and W. F. DeGrado, Acc. Chem. Res., 2019, 52, 1148–1159 CAS.
- T. B. J. Pinter, K. J. Koebke and V. L. Pecoraro, Angew. Chem., Int. Ed., 2020, 59, 7678–7699 CrossRef CAS PubMed.
- A. Espinoza-Cara, U. Zitare, D. Alvarez-Paggi, S. Klinke, L. H. Otero, D. H. Murgida and A. J. Vila, Chem. Sci., 2018, 9, 6692–6702 RSC.
- K. M. Lancaster, S. D. George, K. Yokoyama, J. H. Richards and H. B. Gray, Nat. Chem., 2009, 1, 711–715 CrossRef CAS PubMed.
- M. P. McLaughlin, M. Retegan, E. Bill, T. M. Payne, H. S. Shafaat, S. Peña, J. Sudhamsu, A. A. Ensign, B. R. Crane, F. Neese and P. L. Holland, J. Am. Chem. Soc., 2012, 134, 19746–19757 CrossRef CAS PubMed.
- J. Liu, K. K. Meier, S. Tian, J.-l. Zhang, H. Guo, C. E. Schulz, H. Robinson, M. J. Nilges, E. Münck and Y. Lu, J. Am. Chem. Soc., 2014, 136, 12337–12344 CrossRef CAS PubMed.
- A. C. Manesis and H. S. Shafaat, Inorg. Chem., 2015, 54, 7959–7967 CrossRef CAS PubMed.
- A. C. Manesis, M. J. O'Connor, C. R. Schneider and H. S. Shafaat, J. Am. Chem. Soc., 2017, 139, 10328–10338 CrossRef CAS PubMed.
- S. Tian, J. Liu, R. E. Cowley, P. Hosseinzadeh, N. M. Marshall, Y. Yu, H. Robinson, M. J. Nilges, N. J. Blackburn, E. I. Solomon and Y. Lu, Nat. Chem., 2016, 8, 670–677 CrossRef CAS PubMed.
- D. M. Arciero, A. M. Orville and J. D. Lipscomb, J. Biol. Chem., 1985, 260, 14035–14044 CrossRef CAS.
- A. M. Rocklin, D. L. Tierney, V. Kofman, N. M. W. Brunhuber, B. M. Hoffman, R. E. Christoffersen, N. O. Reich, J. D. Lipscomb and L. Que, Proc. Natl. Acad. Sci. U. S. A., 1999, 96, 7905–7909 CrossRef CAS PubMed.
- A. M. Orville, V. J. Chen, A. Kriauciunas, M. R. Harpel, B. G. Fox, E. Münck and J. D. Lipscomb, Biochemistry, 1992, 31, 4602–4612 CrossRef CAS PubMed.
- A. L. Speelman, B. Zhang, C. Krebs and N. Lehnert, Angew. Chem., Int. Ed., 2016, 55, 6685–6688 CrossRef CAS PubMed.
- S. Ye, J. C. Price, E. W. Barr, M. T. Green, J. M. Bollinger, C. Krebs and F. Neese, J. Am. Chem. Soc., 2010, 132, 4739–4751 CrossRef CAS PubMed.
- S. Chakraborty, J. Reed, M. Ross, M. J. Nilges, I. D. Petrik, S. Ghosh, S. Hammes-Schiffer, J. T. Sage, Y. Zhang, C. E. Schulz and Y. Lu, Angew. Chem., Int. Ed., 2014, 53, 2417–2421 CrossRef CAS PubMed.
- Z. J. Tonzetich, L. H. Do and S. J. Lippard, J. Am. Chem. Soc., 2009, 131, 7964–7965 CrossRef CAS PubMed.
- A. B. Tomter, G. Zoppellaro, C. B. Bell III, A.-L. Barra, N. H. Andersen, E. I. Solomon and K. K. Andersson, PLoS One, 2012, 7, e33436 CrossRef CAS.
- B. S. Pierce, J. D. Gardner, L. J. Bailey, T. C. Brunold and B. G. Fox, Biochemistry, 2007, 46, 8569–8578 CrossRef CAS PubMed.
- B. D'Autréaux, O. Horner, J.-L. Oddou, C. Jeandey, S. Gambarelli, C. Berthomieu, J.-M. Latour and I. Michaud-Soret, J. Am. Chem. Soc., 2004, 126, 6005–6016 CrossRef PubMed.
- B. M. Hoffman, Acc. Chem. Res., 1991, 24, 164–170 CrossRef CAS.
- R. Basosi, F. Laschi and C. Rossi, J. Chem. Soc., Perkin Trans. 2, 1978, 875–880, 10.1039/P29780000875.
- M. D. Clay, C. A. Cosper, F. E. Jenney, M. W. W. Adams and M. K. Johnson, Proc. Natl. Acad. Sci. U. S. A., 2003, 100, 3796–3801 CrossRef CAS PubMed.
- S. Lu, E. Libby, L. Saleh, G. Xing, J. M. Bollinger and P. Moënne-Loccoz, J. Biol. Inorg Chem., 2004, 9, 818–827 CrossRef CAS PubMed.
- A. T. Smith, S. Pazicni, K. A. Marvin, D. J. Stevens, K. M. Paulsen and J. N. Burstyn, Chem. Rev., 2015, 115, 2532–2558 CrossRef CAS PubMed.
- M. D. Clay, F. E. Jenney, H. J. Noh, P. L. Hagedoorn, M. W. W. Adams and M. K. Johnson, Biochemistry, 2002, 41, 9833–9841 CrossRef CAS PubMed.
- T. G. Spiro, G. Smulevich and C. Su, Biochemistry, 1990, 29, 4497–4508 CrossRef CAS PubMed.
- R. J. Dai and S. C. Ke, J. Phys. Chem. B, 2007, 111, 2335–2346 CrossRef CAS PubMed.
- J. L. Hess, C.-H. Hsieh, S. M. Brothers, M. B. Hall and M. Y. Darensbourg, J. Am. Chem. Soc., 2011, 133, 20426–20434 CrossRef CAS PubMed.
- W.-G. Han, T. Liu, T. Lovell and L. Noodleman, J. Comput. Chem., 2006, 27, 1292–1306 CrossRef CAS PubMed.
- L. T. Haahr, K. P. Jensen, J. Boesen and H. E. M. Christensen, J. Inorg. Biochem., 2010, 104, 136–145 CrossRef CAS.
- J. Katigbak and Y. Zhang, J. Phys. Chem. Lett., 2012, 3, 3503–3508 CrossRef CAS.
- G. M. Sandala, K. H. Hopmann, A. Ghosh and L. Noodleman, J. Chem. Theory Comput., 2011, 7, 3232–3247 CrossRef CAS PubMed.
- C. V. Popescu, S. Ding, P. Ghosh, M. B. Hall and M. Cohara, Inorg. Chem., 2019, 58, 7069–7077 CrossRef CAS PubMed.
- S. Ye and F. Neese, J. Am. Chem. Soc., 2010, 132, 3646–3647 CrossRef CAS.
- Y. Ling and Y. Zhang, Annu. Rep. Comput. Chem., 2010, 6, 64–77 Search PubMed.
- J. C. Crack and N. E. Le Brun, Chem.–Eur. J., 2019, 25, 3675–3684 CrossRef CAS PubMed.
Footnotes |
| † Electronic supplementary information (ESI) available. See DOI: 10.1039/d1sc00364j |
| ‡ These authors contributed equally to this work. |
| This journal is © The Royal Society of Chemistry 2021 |

