 Open Access Article
Rapid amplitude-modulation of a diarylethene photoswitch: en route to contrast-enhanced fluorescence imaging†
Gaowa
Naren‡
 a,
Wera
Larsson‡
 a,
Carlos
Benitez-Martin
 bc,
Shiming
Li
 a,
Ezequiel
Pérez-Inestrosa
 bc,
Bo
Albinsson
 *a and
Joakim
Andréasson
 *a
*a
aChemistry and Chemical Engineering, Chemistry and Biochemistry, Chalmers University of Technology, 41296 Göteborg, Sweden. E-mail: a-son@chalmers.se; balb@chalmers.se
bUniversidad de Málaga-IBIMA, Departamento de Química Orgánica, E-29071 Málaga, Spain
cCentro Andaluz de Nanomedicina y Biotecnología (BIONAND), Parque Tecnológico de Andalucía, E-29590 Málaga, Spain
First published on 15th April 2021
Abstract
A water soluble diarylethene (DAE) derivative that displays exceptionally intense fluorescence from the colorless open form has been synthesized and characterized using UV/vis spectroscopy and fluorescence microscopy. We show that the bright emission from the open form can be rapidly switched using amplitude modulated red light, that is, by light at wavelengths longer than those absorbed by the fluorescent species. This is highly appealing in any context where undesired background fluorescence disturbs the measurement, e.g., the autofluorescence commonly observed in fluorescence microscopy. We show that this scheme is conveniently applicable using lock-in detection, and that robust amplitude modulation of the probe fluorescence is indeed possible also in cell studies using fluorescence microscopy.
Introduction
Fluorescence microscopy is an indispensable tool for imaging applications in bio- and material sciences.1–6 Visualization of cellular components and the related processes is typically achieved using synthetic fluorescent probes that can be tagged to organelles/biomolecules with a high degree of specificity. While this approach allows for discrimination between fluorescent and non-fluorescent material, undesired autofluorescence from endogenous fluorophores inside the cells limits the signal-to-background ratio, which in turn decreases the contrast. When conventional fluorescent probes are used, amplitude modulation of the excitation light together with lock-in detection is of no use, as the background autofluorescence will oscillate with the same modulation frequency. Instead a tool is needed that enables amplitude modulation of the probe emission only, while keeping the autofluorescence intensity at a constant non-modulated level. The use of photochromic probes has been suggested for this purpose. Typically, the previously reported examples are demonstrated in bulk solution in organic solvents7,8 and with modulation frequencies of 1 Hz or lower.9–13 Limited bio-relevance and unpractically long acquisition times follows. Moreover, the function of many of these molecular constructs relies on photo-controlled FRET reactions in multi-chromophoric constructs, implying extensive (synthetic) sample preparations.7–9,11–13 Additional attempts by Marriott and co-workers toward the realization of this scheme in a cellular environment utilizes a spiropyran photoswitch as the sole probe,10,14 implying a very low fluorescence quantum yield (around 0.01)15 and poor photostability. Also, the spiropyran is fluorescent in its colored isomeric form rather than in the colorless form. This situation presents several downsides in these contexts as the background fluorescence is much harder to separate from the probe fluorescence, requiring extensive data processing.Instead, the optimal photoswitch for these purposes should be fluorescent in the colorless isomeric form. A high fluorescence quantum yield is, of course, also a requirement as is good photostability and water solubility. Here, we present the first example of a molecule that possesses all these features. We also show that lock-in detection is conveniently done at frequencies up to 200 Hz, and that the method is applicable in cell studies using fluorescence microscopy.
Results and discussion
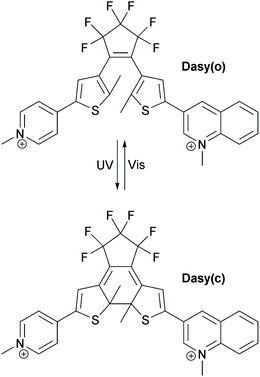
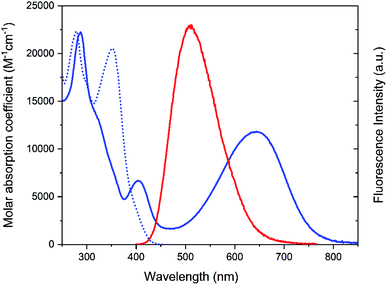
The structure and the isomerization scheme for the asymmetric diarylethene16,17 (DAE asymmetric, Dasy) derivative used in this study are shown in Fig. 1.The photoswitch exists in an open and a closed form referred to as Dasy(o) and Dasy(c), respectively. Dasy(o) absorbs almost exclusively in the UV region with its most redshifted absorption band centered at 351 nm in aqueous solution (see Fig. 2). Exposing Dasy(o) to UV light, here 365 nm, triggers isomerization to yield virtually 100% Dasy(c) at the photostationary state (PSS) with an isomerization quantum yield of 0.44. Dasy(c) displays absorption also in the visible region, manifested by a band with wavelength maximum at 644 nm. Dasy(c) is isomerized to yield 100% Dasy(o) by exposure to visible light, here 523 nm, with a quantum yield of 0.0033.
Left for 43 hours in the dark, Dasy(c) experiences ca. 15% decrease in absorption. We ascribe this change to the irreversible formation of a by-product rather than to the reversible isomerization to Dasy(o) (see Thermal stability and Fig. S1 in the ESI†).18
Dasy(c) is non-fluorescent, whereas Dasy(o) displays fluorescence emission centered around 511 nm in aqueous solution with a fluorescence quantum yield and lifetime of 0.21 and 5.3 ns, respectively. A fluorescence quantum yield of 0.21 is extremely high for the open isomer of a DAE derivative. The one reported example with a higher number comes with the downside that it is only poorly enriched in the closed isomer upon UV isomerization, implying that ‘‘on–off’’ switching of the emission cannot be achieved.19 Considering also that there is currently no other class of photochromic molecules with intrinsically high fluorescence quantum yield in the colorless form, it is obvious that Dasy is a “par excellence” fluorescent photoswitch.
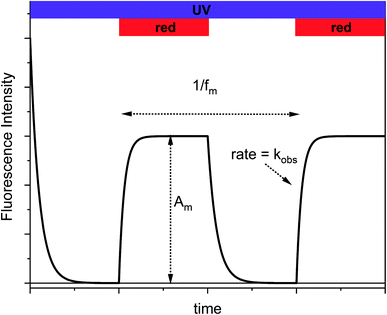
Typically, fluorescence modulation using photoswitches implies light-induced toggling between the two PSS induced by exposure to UV and visible light, respectively.20–32 The fluorescence intensities are recorded after isomerization to each state. Most often, this approach results in binary “on–off” switching of the fluorescence. This scheme is, of course, applicable to Dasy too and the resulting fluorescence changes are shown in Fig. S2 in the ESI.† Fluorescence switching is by no means restricted to this binary situation as the two extreme points do not have to be defined by the two pure PSS that result after UV and visible light exposure, respectively. In our approach, Dasy is initially in the fluorescent open Dasy(o) isomeric form. Exposure to continuous UV light at 365 nm results in emission of intense fluorescence as well as UV-induced isomerization to the closed non-fluorescent isomer Dasy(c). If this process continues until the PSS is reached, the sample is converted to virtually 100% Dasy(c) and no fluorescence is observed. If the sample at this point is exposed also to red light (triggering isomerization from Dasy(c) to Dasy(o)) the fluorescence will recover with the same rate as the establishment of the new PSS induced by simultaneous exposure to UV and red light, referred to as kobs. Switching off the red light leads again to a gradual decrease of the fluorescence intensity, reflecting the UV-induced isomerization to non-fluorescent Dasy(c). This switching scheme is schematically shown in Fig. 3 and illustrates the appealing idea that the fluorescence intensity of a fluorophore can be controlled by exposure to light at wavelengths much longer than those covered by the absorption spectrum of the fluorescent species.
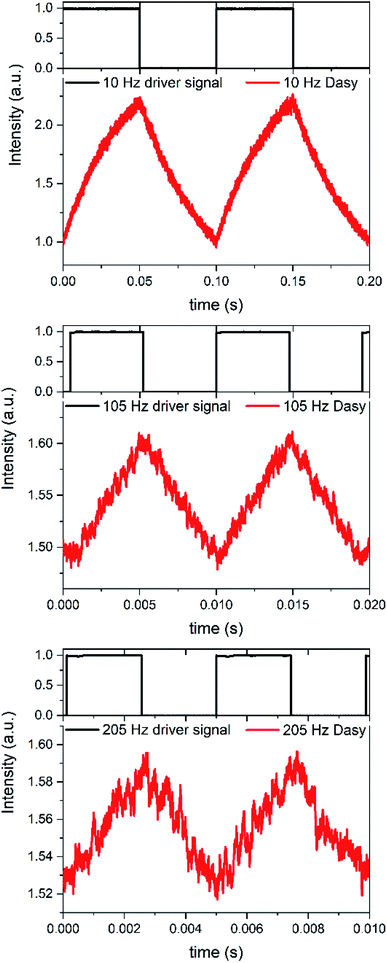
If the on–off toggling of the red light occurs faster, equivalent to increasing the modulation frequency fm, there is not time for the sample to fully isomerize between the two PSS. This applies when fm > kobs and implies that the difference between the maximum and the minimum fluorescence intensities, referred to as the modulation amplitude Am, will decrease. This is experimentally illustrated in Fig. 4 for an aqueous solution of Dasy at ca. 20 μM, continuous UV ligt at 365 nm (∼30 mW) and square-wave modulated red light at 660 nm (∼40 mW) at different frequencies.
It is clearly observed that Am decreases with increasing fm. Although estimation of Am is possible from the crude signal up to fm = 205 Hz, lock-in detection facilitates the separation of the ac-component Am from the underlying dc-component substantially. Am was plotted vs. fm at 18 frequencies in the interval between 0.1 Hz and 205 Hz and it is very encouraging to note that the resulting plot is well described using a theoretical model for this situation, based on single exponential relaxation to the PSS (see Modulation amplitude Amvs. modulation frequency fm, and Fig. S3 and S4 in the ESI†).
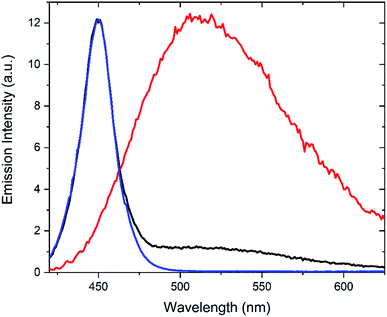
As indicated above, lock-in detection allows for facile separation of an ac-component from an underlying dc-component. This is particularly appealing in situations where the probe fluorescence is obscured by undesired background fluorescence, e.g., in fluorescence microscopy and cell studies. This procedure is referred to as optical lock-in detection (OLID).10 To investigate if the Dasy fluorescence could be filtered out from an intense background emission, the following experiment was undertaken: an aqueous solution of Dasy(o) was prepared at ca. 20 μM. The sample was excited continuously at 365 nm and the emission spectrum was recorded while the detector was simultaneously irradiated with a 450 nm light source (the spectral distribution of the light source is shown in Fig. 5, blue line) to represent the background. The resulting spectrum is shown in black in Fig. 5. It is clear that the dominating emission is the 450 nm light source. Please note that in this experiment, the red light at 660 nm was off at all times, and the detector signal was not filtered using lock-in detection. Next, the experiment was repeated, but this time the 660 nm red light was modulated at 10 Hz, and the detector signal was filtered by a lock-in amplifier set to the same frequency. The red line in Fig. 5 resulted. Here, the spectral signature from the 450 nm light source is entirely suppressed, and the recorded spectrum is instead in perfect agreement with that of Dasy(o) alone (cf.Fig. 2). This clearly shows that amplitude modulation using a red light-source and lock-in detection enables the total suppression of a dominating undesired background emission. The underlying explanation is that the only emission that is phase modulated and picked up by the lock-in amplifier is the fluorescence from Dasy(o). This corresponds to the very common situation of a background fluorescence from endogenous fluorophores absorbing the UV light (365 nm) but not the modulated red light at 660 nm.
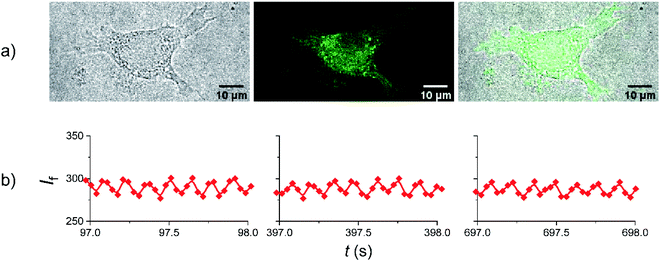
Having established that amplitude modulated fluorescence from Dasy is achievable “in the cuvette” using conventional spectroscopic equipment, we opted for experiments to prove that the switching scheme can be applied also in fluorescence imaging inside cells. L929 cells were treated overnight with a complete medium solution containing Dasy(o) at a concentration of 100 μM and fixed before the microscopy experiments (see Materials and methods in the ESI† for full description of the cell culture and cell treatment). Judging by the fluorescence distribution from inside the cell shown in Fig. 6a it is apparent that Dasy(o) does not display a specific subcellular localization. Instead, the fluorescence is spread throughout the cytoplasm. This observation is not unexpected due to the absence of targeting groups in the Dasy structure. It is also seen that Dasy does not seem to accumulate in the cellular nucleus, as further illustrated in Fig. S6 in the ESI.†
Please note that the images shown in Fig. 6a were recorded using conventional fluorescence imaging. In the subsequent amplitude modulation experiment the 405 nm and 633 nm laser lines were used to trigger the closing and the opening reactions, respectively. The 405 nm laser line also served as excitation for emission readout. A sequential scan program that yields an apparent modulation frequency of 7.4 Hz for the 633 nm light was employed, containing four scans or images per frame. The first two scans were acquired with simultaneous irradiation at 405 nm and 633 nm, whereas in the last two scans only 405 nm irradiation was employed. The results are displayed in Fig. 6b. Further details are described in the ESI (Materials and methods, Amplitude modulation of Dasy in fixed cells using fluorescence microscopy, and Fig. S5†). Zoom-ins of selected time widows spaced by 300 s are shown to emphasize the 7.4 Hz amplitude modulation (ac component) and the excellent photostability. Thus, the ability of Dasy to display amplitude modulated fluorescence within a biological environment is not only proved but is also ensured through the demonstrated fatigue resistance. Note that the extensive monitoring period of around 700 s is not required for the overall collection of amplitude modulated Dasy fluorescence, which would have implied unpractically long acquisition times. Instead, the chosen irradiation scheme serves as a control to the said photostability.
Conclusions
Judging from the fluorescence experiments performed both in the cuvette and in a cellular milieu using a microscope, we conclude that Dasy is a prime candidate for contrast-enhanced fluorescence imaging. We base this notion on the outstanding properties that this photoswitch presents, such as the water solubility, exceptionally high fluorescence quantum yield, virtually 100% enrichment in both photostationary states (UV- and visible light induced), excellent photo- and thermal stability, redshifted absorption spectra, and rapid switching capabilities. For the demonstrated function per se, the key observation is that the photoswitch is highly fluorescent in the colorless open isomer. This should be contrasted to derivatives from other classes of photochromic compounds where the only emission originates from the weakly fluorescent colored forms, and also to other diarylethene structures (sulfone derivatives) with high brightness that fluoresces mainly in the closed colored isomer.31 A fluorescent colorless form implies that light at longer wavelengths than those absorbed by the fluorescent species can be used to influence the emission intensity in a controlled manner. Specifically, here we use light at 633 nm or 660 nm to induce amplitude modulation of the fluorescence centered at 511 nm. All endogenous material in the cell that contributes to undesired background fluorescence in the visible region, as well as scattered light, are totally unaffected by light at these wavelengths. This is why we efficiently can filter out the amplitude modulated Dasy-fluorescence from the constant background. Note that this scheme is not applicable using other frequently employed photoswitches that almost exclusively presents fluorescence in the colored isomeric form, such as the spiropyrans used in the previously reported cell studies.10,14 We would also like to emphasize that the absorption band of the fluorescent form Dasy(o) extends beyond 400 nm as opposed to most other photochromic switches where the colorization reaction has to be triggered at 365 nm or shorter. This implies conveniently that the line at 405 nm can be used in the microscopy experiments and also a reduced phototoxicity.Not only do we demonstrate amplitude modulation, but we also do it at frequencies that are orders of magnitude higher compared to the typical previous demonstrations (205 Hz vs. < 1 Hz) while maintaining amplitude modulation sufficiently large to be detected from the crude signal and, of course, also conveniently using lock-in detection. Thus, the acquisition times are dramatically shortened compared to approaches requiring modulation frequencies of 1 Hz or lower. In addition to the typical benefits of shorter acquisition times, it also enables live cell studies that would be impossible at lower frequencies.
Finally, the ultimate performance of Dasy in fluorescence imaging cannot be shown without lock-in interfaced detection in the microscope as no contrast-enhanced images can be recorded in its absence. This is, however, a matter of technical nature and does not devaluate the excellent performance of Dasy demonstrated in the amplitude modulated proof-of-principle studies described above. Although the examples are very scarce,14 fluorescence imaging using OLID at modulation frequencies higher than 100 Hz has been demonstrated using a spiropyran photoswitch, clearly showing the potential of this technique. Considering the outstanding photophysical properties of Dasy discussed above, we believe that this novel photoswitch will substantially enhance the performance of OLID high-contrast imaging,33 and may open up new research avenues that have not been available before.
Author contributions
J. A. conceptualization, formal analysis, funding acquisition, methodology, project administration, supervision, writing – original draft. B. A. conceptualization, formal analysis, funding acquisition, methodology, project administration, supervision. G. N. and W. L. formal analysis, investigation, methodology, visualization, writing – original draft. S.-M. L. investigation, methodology. C. B.-M. and E. P.-I. formal analysis, investigation, methodology, visualization. G. N. and W. L. contributed equally to this study.Conflicts of interest
There are no conflicts of interest to declare.Acknowledgements
J. A. and B. A. acknowledge financial support from the Swedish Research Council VR (Grant # 2016-0360 and Grant # 2018-03998, respectively). E. P.-I. acknowledges the Spanish Ministry for Science, Innovation, and Universities (RD16/0006/0012, PCI2019-111825-2, and PID2019-104293GB-I00), Universidad de Málaga-Junta de Andalucía (UMA18-FEDERJA-007), and FEDER. C. B.-M. is grateful for a FPU fellowship (FPU16/02516). The authors thank Dr Tamara Pace and Dr Vilhelm Müller for participating in the initial studies of Dasy.Notes and references
- B. C. Chen, W. R. Legant, K. Wang, L. Shao, D. E. Milkie, M. W. Davidson, C. Janetopoulos, X. F. S. Wu, J. A. Hammer, Z. Liu, B. P. English, Y. Mimori-Kiyosue, D. P. Romero, A. T. Ritter, J. Lippincott-Schwartz, L. Fritz-Laylin, R. D. Mullins, D. M. Mitchell, J. N. Bembenek, A. C. Reymann, R. Bohme, S. W. Grill, J. T. Wang, G. Seydoux, U. S. Tulu, D. P. Kiehart and E. Betzig, Science, 2014, 346, 1257998 CrossRef PubMed.
- F. Helmchen and W. Denk, Nat. Methods, 2005, 2, 932–940 CrossRef CAS PubMed.
- B. Huang, M. Bates and X. W. Zhuang, Annu. Rev. Biochem., 2009, 78, 993–1016 CrossRef CAS PubMed.
- J. W. Lichtman and J. A. Conchello, Nat. Methods, 2005, 2, 910–919 CrossRef CAS PubMed.
- R. M. Power and J. Huisken, Nat. Methods, 2017, 14, 360–373 CrossRef CAS PubMed.
- S. J. Sahl, S. W. Hell and S. Jakobs, Nat. Rev. Mol. Cell Biol., 2017, 18, 685–701 CrossRef CAS.
- G. Copley, J. G. Gillmore, J. Crisman, G. Kodis, C. L. Gray, B. R. Cherry, B. D. Sherman, P. A. Liddell, M. M. Paquette, L. Kelbauskas, N. L. Frank, A. L. Moore, T. A. Moore and D. Gust, J. Am. Chem. Soc., 2014, 136, 11994–12003 CrossRef CAS PubMed.
- A. E. Keirstead, J. W. Bridgewater, Y. Terazono, G. Kodis, S. Straight, P. A. Liddell, A. L. Moore, T. A. Moore and D. Gust, J. Am. Chem. Soc., 2010, 132, 6588–6595 CrossRef CAS PubMed.
- S. Mao, R. K. P. Benninger, Y. L. Yan, C. Petchprayoon, D. Jackson, C. J. Easley, D. W. Piston and G. Marriott, Biophys. J., 2008, 94, 4515–4524 CrossRef CAS PubMed.
- G. Marriott, S. Mao, T. Sakata, J. Ran, D. K. Jackson, C. Petchprayoon, T. J. Gomez, E. Warp, O. Tulyathan, H. L. Aaron, E. Y. Isacoff and Y. L. Yan, Proc. Natl. Acad. Sci. U. S. A., 2008, 105, 17789–17794 CrossRef CAS PubMed.
- C. Petchprayoon, Y. L. Yan, S. Mao and G. Marriott, Bioorg. Med. Chem., 2011, 19, 1030–1040 CrossRef CAS PubMed.
- Z. Y. Tian, W. W. Wu, W. Wan and A. D. Q. Li, J. Am. Chem. Soc., 2011, 133, 16092–16100 CrossRef CAS PubMed.
- Y. L. Yan, C. Petchprayoon, S. Mao and G. Marriott, Philos. Trans. R. Soc., B, 2013, 368 CAS.
- L. X. Wu, Y. R. Dai, X. L. Jiang, C. Petchprayoon, J. E. Lee, T. Jiang, Y. L. Yan and G. Marriott, Plos One, 2013, 8, e64738 CrossRef CAS PubMed.
- J. R. Nilsson, S. M. Li, B. Önfelt and J. Andréasson, Chem. Commun., 2011, 47, 11020–11022 RSC.
- M. Irie, Chem. Rev., 2000, 100, 1685–1716 CrossRef CAS PubMed.
- M. Irie, T. Fukaminato, K. Matsuda and S. Kobatake, Chem. Rev., 2014, 114, 12174–12277 CrossRef CAS PubMed.
- M. Irie, T. Lifka, K. Uchida, S. Kobatake and Y. Shindo, Chem. Commun., 1999, 747–748, 10.1039/a809410a.
- K. Shibata, L. Kuroki, T. Fukaminato and M. Irie, Chem. Lett., 2008, 37, 832–833 CrossRef CAS.
- J. Andréasson, U. Pischel, S. D. Straight, T. A. Moore, A. L. Moore and D. Gust, J. Am. Chem. Soc., 2011, 133, 11641–11648 CrossRef PubMed.
- J. Andréasson, S. D. Straight, T. A. Moore, A. L. Moore and D. Gust, J. Am. Chem. Soc., 2008, 130, 11122–11128 CrossRef PubMed.
- C. Benitez-Martin, S. M. Li, A. Dominguez-Alfaro, F. Najera, E. Perez-Inestrosa, U. Pischel and J. Andréasson, J. Am. Chem. Soc., 2020, 142, 14854–14858 CrossRef CAS PubMed.
- L. Giordano, T. M. Jovin, M. Irie and E. A. Jares-Erijman, J. Am. Chem. Soc., 2002, 124, 7481–7489 CrossRef CAS PubMed.
- A. J. Myles, B. Gorodetsky and N. R. Branda, Adv. Mater., 2004, 16, 922–925 CrossRef CAS.
- F. M. Raymo and M. Tomasulo, Chem. Soc. Rev., 2005, 34, 327–336 RSC.
- F. M. Raymo and M. Tomasulo, J. Phys. Chem. A, 2005, 109, 7343–7352 CrossRef CAS PubMed.
- P. Remon, M. Bälter, S. M. Li, J. Andréasson and U. Pischel, J. Am. Chem. Soc., 2011, 133, 20742–20745 CrossRef CAS PubMed.
- L. Song, E. A. Jares-Erijman and T. M. Jovin, J. Photochem. Photobiol., A, 2002, 150, 177–185 CrossRef CAS.
- L. W. Song, Y. H. Yang, Q. Zhang, H. Tian and W. H. Zhu, J. Phys. Chem. B, 2011, 115, 14648–14658 CrossRef CAS PubMed.
- S. D. Straight, J. Andréasson, G. Kodis, S. Bandyopadhyay, R. H. Mitchell, T. A. Moore, A. L. Moore and D. Gust, J. Am. Chem. Soc., 2005, 127, 9403–9409 CrossRef CAS PubMed.
- K. Uno, H. Niikura, M. Morimoto, Y. Ishibashi, H. Miyasaka and M. Irie, J. Am. Chem. Soc., 2011, 133, 13558–13564 CrossRef CAS PubMed.
- H. Zhao, U. Al-Atar, T. C. S. Pace, C. Bohne and N. R. Branda, J. Photochem. Photobiol., A, 2008, 200, 74–82 CrossRef CAS.
- Y. L. Yan, M. E. Marriott, C. Petchprayoon and G. Marriott, Biochem. J., 2011, 433, 411–422 CrossRef CAS PubMed.
Footnotes |
| † Electronic supplementary information (ESI) available. See DOI: 10.1039/d1sc01071a |
| ‡ Both authors contributed equally to the study. |
| This journal is © The Royal Society of Chemistry 2021 |

