
 Open Access Article
 This Open Access Article is licensed under a Creative Commons Attribution-Non Commercial 3.0 Unported Licence
Temperature artifacts in protein structures bias ligand-binding predictions†
Shanshan Y. C.
Bradford‡
 a,
Léa
El Khoury‡
b,
Yunhui
Ge
b,
Meghan
Osato
b,
David L.
Mobley
bc and
Marcus
Fischer
*ad
a,
Léa
El Khoury‡
b,
Yunhui
Ge
b,
Meghan
Osato
b,
David L.
Mobley
bc and
Marcus
Fischer
*ad
aDepartment of Chemical Biology & Therapeutics, St. Jude Children's Research Hospital, Memphis, TN 38105, USA. E-mail: marcus.fischer@stjude.org
bDepartment of Pharmaceutical Sciences, University of California, Irvine, CA 92697, USA
cDepartment of Chemistry, University of California, Irvine, CA 92697, USA
dDepartment of Structural Biology, St. Jude Children's Research Hospital, Memphis, TN 38105, USA
First published on 13th July 2021
Abstract
X-ray crystallography is the gold standard to resolve conformational ensembles that are significant for protein function, ligand discovery, and computational methods development. However, relevant conformational states may be missed at common cryogenic (cryo) data-collection temperatures but can be populated at room temperature. To assess the impact of temperature on making structural and computational discoveries, we systematically investigated protein conformational changes in response to temperature and ligand binding in a structural and computational workhorse, the T4 lysozyme L99A cavity. Despite decades of work on this protein, shifting to RT reveals new global and local structural changes. These include uncovering an apo helix conformation that is hidden at cryo but relevant for ligand binding, and altered side chain and ligand conformations. To evaluate the impact of temperature-induced protein and ligand changes on the utility of structural information in computation, we evaluated how temperature can mislead computational methods that employ cryo structures for validation. We find that when comparing simulated structures just to experimental cryo structures, hidden successes and failures often go unnoticed. When using structural information in ligand binding predictions, both coarse docking and rigorous binding free energy calculations are influenced by temperature effects. The trend that cryo artifacts limit the utility of structures for computation holds across five distinct protein classes. Our results suggest caution when consulting cryogenic structural data alone, as temperature artifacts can conceal errors and prevent successful computational predictions, which can mislead the development and application of computational methods in discovering bioactive molecules.
Introduction
Rational drug discovery relies on structural data to find molecules that treat disease. The success of drug discovery hinges on the quality of the input structure. Often, crystallographic resolution is the main criterion to judge the quality of a structure, given that the confidence in the position of the atomic coordinates increases with resolution. The underlying assumption is that the chosen structure captures relevant functional conformations that are useful for molecular discoveries.With structural information in hand, investigators then use computational methods to guide structure-based screening and design. Depending on the application, the choice of computational approach is a deliberate balance of speed and precision. High-throughput methods like docking rapidly rank pre-existing small-molecule libraries to help guide experimental screening of selected compounds,1 while low-throughput methods like molecular simulations and free-energy calculations help prioritize new compounds for synthesis.2,3 Despite their differences, computational approaches on both ends of the speed-vs.-precision continuum rely heavily on the quality of the input structure. Fast docking methods that place flexible ligands in typically rigid or nearly rigid protein structures are especially vulnerable to the choice of the input structure.4,5 Slower simulation-based approaches allow receptors to relax and change conformation.6,7 When timescales of the relevant motions are fast, adding a layer of computation may mend flaws of experimental input structures. Such experimental blemishes originate from the misinterpretation of electron density maps, steric clashes, or, in the pursuit of finding a new chemotype, from a co-crystallized ligand imprinting its bias upon the chosen protein structure. To capture long timescale collective motions of larger domains, simulations have to be either lengthy or efficient.7–10 In the best-case scenario, this can lead to insights into the dynamics of how proteins transition from one functional state to another. In the worst-case scenario, insufficient sampling results in unequilibrated states that are trapped in local energy minima.
For better or worse, computation generally leads the structure further away from the experimental input. Still, when successful, computational methods can provide valuable insights for pharmaceutical discovery and design. Docking methods have been widely used for library-screening campaigns, yielding different bioactive compounds than those from experimental high-throughput screening.11 Recent large-scale tests have substantially advanced the discovery of new bioactive compounds, compared to picking compounds randomly,1 even on challenging targets.12 Binding free energy methods13 have shown promise for guiding lead optimization efforts2,14 and are beginning to be widely used in industry.15,16
Despite their successes, these computational approaches have undeniable liabilities that need addressing. For instance, docking is valuable for filtering libraries, but it is unreliable at predicting if and how tightly individual compounds are likely to bind;12 free energy calculations need to overcome errors in the underlying force fields (FFs) to more reliably reproduce experimental energies.17 Typically, method development goes through feedback cycles of computational predictions and experimental validation and benchmarking. Clearly, the ability to improve a computational method hinges on the quality of the experimental data against which it is tested.18,19 In turn, computational methods may inherit errors from crystallographic artifacts. Ultimately, the value of a structure will be measured by how well it advances our understanding of biology or informs ligand discovery, not solely by its resolution. Although well-resolved atoms are precisely defined, they may not be accurate. By the same token, poorly resolved features in high-resolution datasets may not be unimportant for function. Along various timescales, the mobility of such flexible structural elements varies from disordered side chains, to loops, to intrinsically disordered proteins.20–22
Currently, nearly all crystallographic datasets are collected at cryogenic temperatures (cryo).23 Cryocooling enables convenient collection of datasets to high resolution and completeness without detrimental effects of radiation damage.24 However, some important structural states may be missed due to the cryogenic cooling process.25 Recently, we and others have shown that by changing to room temperature (RT), we can populate higher energy conformational states that are hidden under routine cryogenic conditions.23,25–31 As contributions from enthalpy versus entropy change with temperature, distinct conformational ensembles are being trapped, depending on the speed of cooling.32–34
The realization that data collected 200 K below RT may not be representative of the ensemble of biologically relevant states has sparked an interest in interrogating crystallographic electron density maps for signs of alternate side chain,35 backbone,36 and ligand37 conformations in orthosteric and allosteric sites.38 Recently, we showed that RT crystallography (RTX) can provide information about flexibility and conformational energy penalties in ligand discovery.27 Although this pioneering study pragmatically supports the notion that drug discovery may benefit from structures solved at RT, a systematic study linking the effects of temperature on protein structures to drug discovery is still missing.
To systematically probe the bias of temperature on the utility of structural data for ligand discovery and computational methods development, we collected crystallographic data of 9 structure pairs, i.e. the same protein–ligand complex at 2 temperatures. This is the most expansive temperature series to date that was deliberately assembled for a set of congeneric ligands. Such similar ligands are typically encountered in medicinal chemistry campaigns around a hit series. The matched datasets of similar ligands at 2 temperatures also enable us to disentangle whether ligand binding or temperature is the main contributor to the observed protein response.
We chose the uncollapsed cavity created by the L99A mutation in T4 lysozyme (T4L) as a suitable system to investigate the impact of temperature on protein–ligand structures by using crystallography and computation for the following reasons: many related ligands are available, loops and side chains respond to the binding of different ligands, and crystals diffract to high resolution. For several decades, T4L–L99A has served as a workhorse39 for understanding protein stability,40 rigidity and hydration,41,42 ligand-binding thermodynamics,43,44 and crystal forms.45 It has also been used to assist membrane protein crystallization46 and computational methods development.47 One might assume that not much novelty is left to be discovered about a system that has been studied so exhaustively, with more than 700 T4L structures deposited to the PDB and more than 130 structures for the L99A cavity alone with different ligands bound. Here, we collect crystallographic data on 9 matched dataset pairs collected at 2 temperatures (cryo and RT) to high resolution (<1.5 Å on average). Despite abundant previous studies, our datasets provided surprising structural insights into how T4L structure and ligand binding changes with temperature.
To evaluate the impact of these temperature-induced changes on the utility of structural information in computation we focused on two aspects. First, to understand how temperature bias affects computational methods development that employs cryogenic structures for calibration and validation, we compared simulated structures to experimental structures solved at low and high temperature. Second, to understand how temperature affects coarse docking and rigorous binding free energy calculations, we used different low and high temperature structures as computational starting points and monitored performance metrics such as docking enrichment and RMSD, and errors in calculated absolute binding free energies.
To test the generality of our observations we further expanded our computational approach to examine another 4 distinct protein classes for which RT and cryo data are already available in the PDB. Again, temperature-induced structural changes are common among all proteins and lead to errors in validating the success of computational models; when using only cryo structures, one would miss both failures and successes of the computational predictions.
This work addresses 3 fundamental issues that arise when structural models are used for ligand discovery. First, what impact does temperature have on the conformations and occupancies of proteins and their ligands? Second, do these temperature artifacts affect the accuracy and improvement of computational methods? Third, do temperature artifacts mislead structure-based drug discovery and design?
Results
Crystal cryocooling induces global idiosyncratic structural changes
To systematically study the impact of temperature on protein structure in the presence of similar ligands, we collected pairs of crystallographic datasets of the same protein–ligand complex at 2 temperatures (cryo and RT). We obtained 14 new high-resolution datasets: 9 at RT and 5 at cryo. Combined with 5 cryo PDB-deposited datasets, this yielded a total of 9 matched pairs of the T4L–L99A cavity: the apo structure and 8 ligand complexes, 3 of which were previously unknown (3-iodotoluene, 4-iodotoluene, benzylacetate). For chemical structures, see Fig. 1E. The 9 structure pairs were solved in the same space group, P3221, to an average resolution of 1.42 Å at cryo and 1.39 Å at RT. Hence, observed structural differences are unlikely due to differences in the perceived quality of the data. Despite higher average resolutions of 1.19 Å for the 5 cryo structures solved here, final Rfree values of our 9 RTX structures were lower by 0.8% on average (Table S1†). This suggests a better fit of the model refined against the RTX data than against the cryo data. As expected, the crystal unit cell (UC) volumes shrank upon cooling, on average by 4% (Fig. 1A). The o-xylene complex at RT was closest to its cryo equivalent with a 2% difference; the apo UC volume was most dissimilar at nearly 6%. For average UC volumes of 3.50 ± 0.04 × 10⁵ Å3 at cryo and 3.65 ± 0.02 × 10⁵ Å3 at RT, the standard deviation at cryo was twice as high as at RT. Contrary to the expectation that thermal mobility increases diversity at RT48 and despite higher average Wilson B-factors of 16.9 ± 1.7 Å2 at RT (n = 9) vs. 13.6 ± 2.9 Å2 at cryo (n = 5), the cryogenic datasets were more variable than the RT datasets.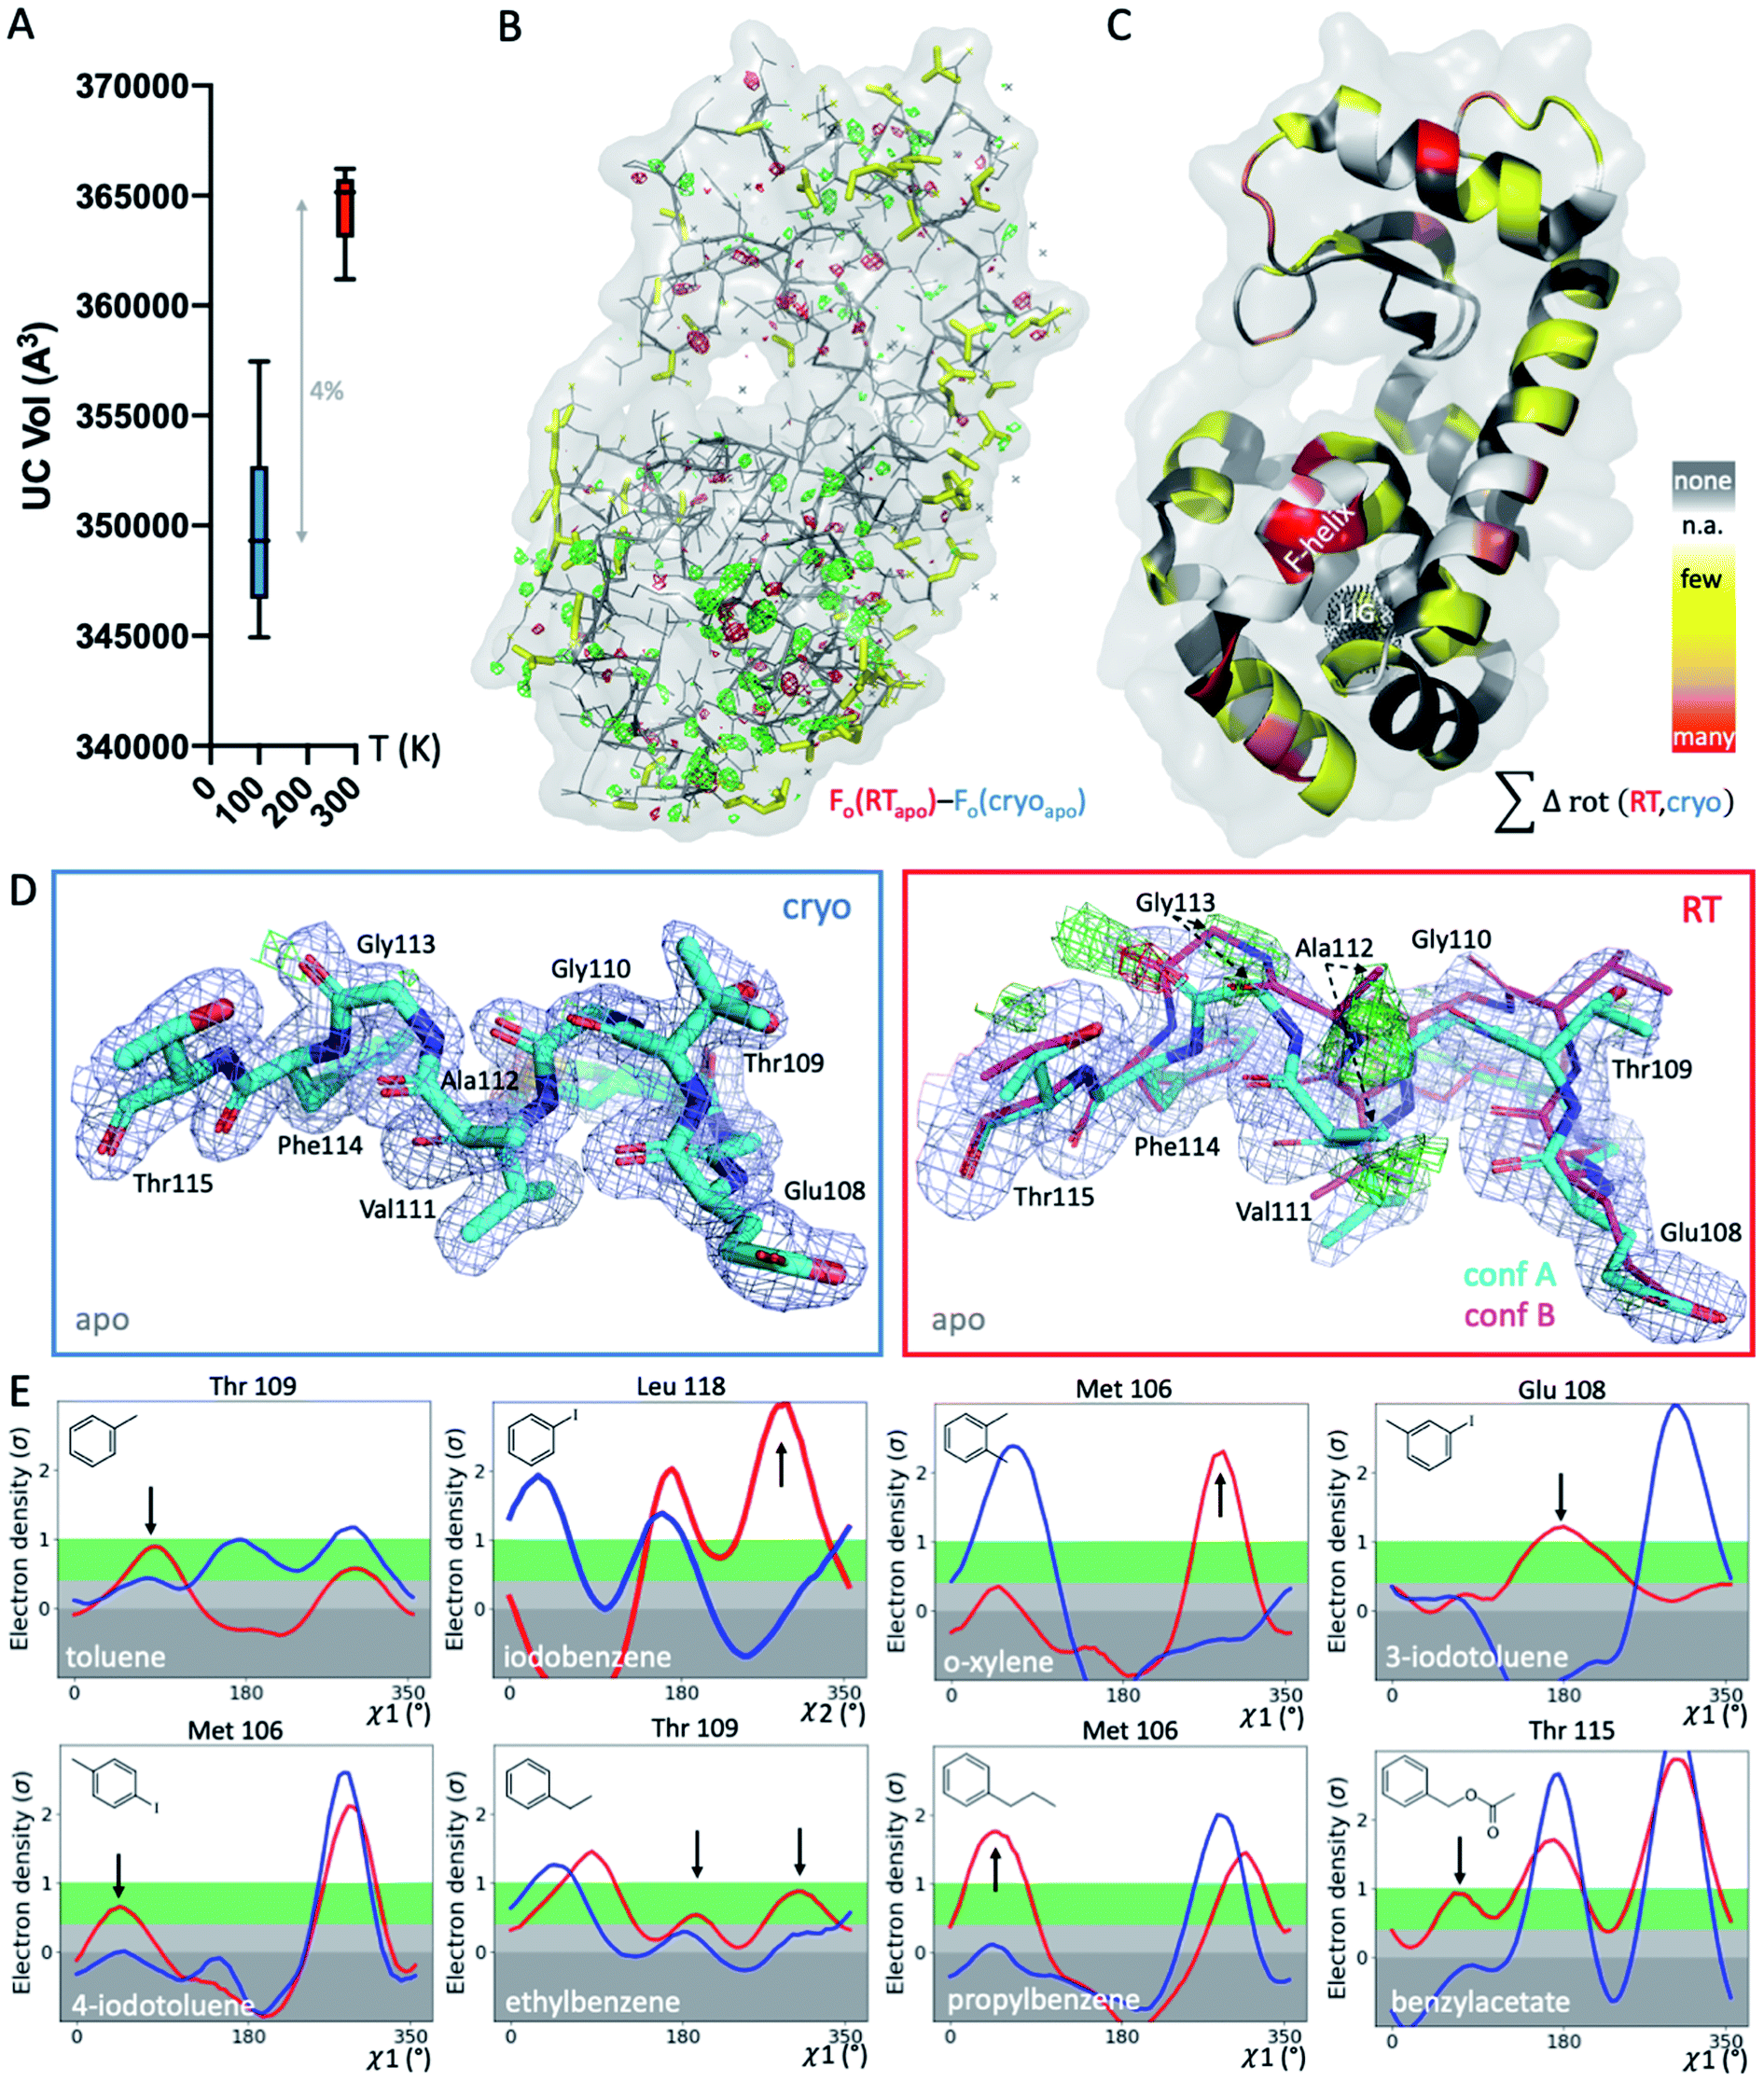 | ||
| Fig. 1 Global and local structural responses to temperature. (A) Globally, structures at cryogenic temperatures (cryo; blue plot) are more variable and more compact than their room temperature (RT; red plot) equivalents, as shown by average unit cell (UC) volumes across 9 matched structures collected at both temperatures. (B) The isomorphous Fo − Fo map of the apo structure collected at cryo versus RT shows differences in the electron density (green mesh, positive difference electron density; red mesh, negative difference electron density) that indicate idiosyncratic temperature effects, especially around the ligand-binding site in the bottom lobe, indicated by the black dotted mesh in panel C (labeled LIG). (C) Occurrence of temperature-dependent rotamer differences across all 9 structures are projected onto the respective residues in the T4L apo structure; colored by temperature sensitivity of each residue across all 9 structure pairs: yellow for few structures, orange for several structures, and red for most structures showing temperature differences of the residue; white patches are Gly and Ala that do not have Chi angles; and grey patches show no rotamer change with temperature. (D) Locally, RT data of the L99A apo cavity reveal an alternative F-helix conformation (conf. B) in the Fo − Fc difference electron density maps (green and red mesh for positive and negative density, respectively; only cyan conformation A was included in refinement) that is not visible at cryo; 2mFo − DFc map shown as blue mesh; stick thickness represents relative occupancy. (E) All 8 ligand complexes show a shift in preferred orientation in response to temperature rather than due to ligand binding for at least 1 residue rotamer in the F-helix near the ligand-binding site. Ringer plots for selected residues, with rotamer differences at RT (red) versus cryo (blue) indicated by arrows. | ||
To locate temperature-induced changes in the electron density maps, we calculated isomorphous difference maps by subtracting the apo cryo map from the RTX map (Fo − Fo). There were significant differences in the peaks of both positive and negative signs across the entire structures, many of which were near the ligand-binding site (Fig. 1B and S1†). To reveal areas that were most affected by temperature across all 9 matched pairs, we mapped any residue that changed its rotameric state in response to temperature onto the T4L structure (Fig. 1C). To provide a conservative estimate, we monitored only those residues that showed a change in the Chi1 angle of their side chain in the crystallographic electron density maps. Note that Gly, Ala and Pro that make up ∼20% of residues in T4L do not have a Chi1 angle. Overall, more than a third of the 164 residues in the protein responded to temperature in at least 1 of the 9 structure pairs. This value is similar to the 35% of residues that were found to be remodeled upon cryocooling across 30 deposited structures (9). Residues affected by changes in temperature were distributed across the entire structure and covered all types of amino acids; bulky aromatic residues (e.g., Trp, Phe, and His) were underrepresented most likely due to steric constraints. Notably, the residues that were most responsive to temperature change in several structures were located near the ligand-binding site (Fig. 1B and C). This suggests that residues critical for accommodating ligand binding are most affected by temperature changes.
To exclude changes in crystal packing as a major source of observed structural changes, we compared crystal contacts of the apo structures that showed the largest UC volume shrinkage upon cryocooling; mostly, the same residues were involved in crystal contacts at RT and cryo (ESI Fig. S2†). Although we expected more residues at the crystal-packing interface to be systematically affected by the UC compression, only a few surface residues responded to temperature in several datasets (Fig. 1C and S2†). On average, all pairwise root-mean-square deviations (RMSDs) were below 0.3 Å. A residue-resolved RMSD plot showed no clear trend of temperature changes of any structure pair (ESI Fig. S3†). Very few residues had RMSD values larger than 0.5 Å; the only residue exceeding 1 Å RMSD was Thr109 in the binding site adjacent to the “F-helix”39 of the 3-iodotoluene complex. To understand if areas of higher positional variability (RMSDs) coincide with higher mobility (B-factors), we plotted B-factors of the main chain and side chains for all residues in each structure (ESI Fig. S4†). Main-chain values were slightly elevated in 4 areas: 2 distal loops, 1 helix patch close to the binding site, and the ligand-responsive F-helix, especially for the o-xylene complex solved at cryo (in 1995![[thin space (1/6-em)]](https://www.rsc.org/images/entities/char_2009.gif) 43 (ESI Fig. S4A†). Apart from the F-helix, these regions did not coincide with the “hotspots” (identified in red in Fig. 1C). Side chain B-factors followed neither the pattern shown in Fig. 1C nor that in ESI Fig. S4A.† Rather, longer side chains, like those in Lys, Arg, and Asn, dominated the peaks in the plot, as expected for flexible residues that are often on the protein surface and point into solvent (ESI Fig. S4B†). Hence, neither B-factors nor RMSDs, as proxies for increased movement, consistently coincided with protein regions where rotamers most frequently responded to temperature changes. Although global indicators of temperature sensitivity illustrate the magnitude of structural differences upon changing data-collection temperature, we were especially interested in local differences. During drug discovery, local conformational states of binding pockets are consulted to screen virtual libraries, optimize hits, and design compounds de novo.
43 (ESI Fig. S4A†). Apart from the F-helix, these regions did not coincide with the “hotspots” (identified in red in Fig. 1C). Side chain B-factors followed neither the pattern shown in Fig. 1C nor that in ESI Fig. S4A.† Rather, longer side chains, like those in Lys, Arg, and Asn, dominated the peaks in the plot, as expected for flexible residues that are often on the protein surface and point into solvent (ESI Fig. S4B†). Hence, neither B-factors nor RMSDs, as proxies for increased movement, consistently coincided with protein regions where rotamers most frequently responded to temperature changes. Although global indicators of temperature sensitivity illustrate the magnitude of structural differences upon changing data-collection temperature, we were especially interested in local differences. During drug discovery, local conformational states of binding pockets are consulted to screen virtual libraries, optimize hits, and design compounds de novo.
RTX reveals hidden F-helix conformation in apo structure that is key for ligand binding
To gain insight into local temperature sensitivities, we interrogated electron density maps, especially around the ligand-binding site. Within the T4L–L99A site, ligands were enclosed by the dynamic F-helix.49 Despite decades of research on the T4L model system, only 1 state, the closed conformation, has thus far been observed for the apo structure. However, at RT, the difference electron density map of our apo dataset showed clear evidence of a second F-helix conformation (Fig. 1D). The second conformation was equivalent to the “intermediate” state that has been observed in several ligand complexes,49 in agreement with the selection of preexisting conformational states upon ligand binding.50–52 Occupancy refinement of the apo structure in the presence of both F-helix states led to approximately 40% presence of the second conformation. To confirm that this conformation had not been missed previously, we inspected the electron density map of cryo apo PDB structure 4W51 but found no evidence for an alternate F-helix conformation (ESI Fig. S5†). To further ensure that the second conformation was not populated due to changes in our experimental setup other than temperature, we recollected the cryo apo structure to 1.3 Å with the same conditions we used for RTX. Again, we observed no difference in the electron density for the second state at cryo, indicating that indeed temperature allowed this alternate state to be partially populated at RT. Revealing this alternate conformation only at RT is striking, given that this alternate state becomes relevant, even at cryo temperatures, for the binding of several ligands.47,49,53,54Cryogenic cooling distorts the local environment of the ligand-binding site
Beyond revealing a hidden conformation of the entire F-helix, we sought to understand the temperature impact on individual side-chain rotamers that line the binding site. Analysis of Chi angles in the apo structure using Ringer55 showed temperature-dependent remodeling of several binding-site residues normally associated with ligand binding. Only at RT did an alternate conformation of Ser90 appear, and in the closed state of the F-helix, residues Met106, Glu108, Thr109, and Thr115 occupied new rotameric positions (ESI Fig. S6†). Nearly all residues of the F-helix with Chi angles were affected to some degree.To look for temperature-induced rotamer changes in the presence of a ligand, we next turned to our 8 pairs of individual ligand complexes. All structures were affected by idiosyncratic structural remodeling upon cooling, especially in the flexible ligand-binding site (Fig. 1C). First, in each structure, at least 1 binding-site residue responded to temperature change in addition to ligand binding (Fig. 1E). Second, across all 8 structure pairs, each F-helix residue changed idiosyncratically upon cooling in at least 1 ligand complex. The extent of temperature-induced artifacts was alarming, given that most studies use only cryogenic data. In the context of a typical medicinal chemistry campaign, idiosyncratic structural changes introduced by cryocooling would be mistaken for genuine responses to ligand binding and unequivocally considered in ligand design instead of being flagged as artifacts. The fact that highly similar ligand complexes were affected to different degrees complicated the derivation of structure/activity relationships. For instance, at cryo, Met106 appeared to change orientation when o-xylene bound, relative to the propylbenzene-bound structure (Fig. 1E). However, the major RT conformation of Met106 was absent in the respective cryo dataset, both for o-xylene and propylbenzene. Ironically, the main RT rotamer of o-xylene matched the cryo rotamer of propylbenzene and vice versa. Of the 2 Met106 conformations visible for propylbenzene, only the minor one was captured at cryo. Similar temperature sensitivities were observed for Glu108 in 3-iodotoluene, Thr109 in ethylbenzene, and Thr115 in benzylacetate, to name a few. We paid especially close attention to the changes in Val111 due to the importance of this residue in complicating ligand-binding predictions.47,56,57 Ringer plots documented temperature differences of Val111 for about half of our complexes, including toluene, iodobenzene, o-xylene, ethylbenzene, and benzylacetate (ESI Fig. S7†). For instance, Val111 in the iodobenzene and o-xylene structures occupied different conformations at cryo, whereas the RTX conformations were identical (ESI Fig. S7†).
To illustrate the problems of using cryo data alone for medicinal chemistry, we focused on 2 neighboring F-helix residues (Glu108 and Thr109) across 3 structures—apo and 2 ligands (toluene and iodobenzene) (Fig. 2A)—that by Tanimoto coefficient standards would be considered essentially identical (Table S2†). In the apo structure, the rotamers for Glu108 and Thr109 changed upon cryocooling. The main rotamer of Thr109 at RT was the one that stabilized when ligands like toluene or iodobenzene were bound. At RT, the Chi1 distribution of Thr109 agreed across the 3 structures (apo, toluene, and iodobenzene), whereas at cryo, it did not. Also, while the preferred Thr109 rotamers matched between RT and cryo in the iodobenzene structure, they differed between the 2 temperatures in the presence of the congeneric ligand toluene and in the absence of a ligand. At both temperatures, the rotamer distribution was more similar between toluene and apo than between toluene and iodobenzene. Glu108 rotamers agreed for toluene and iodobenzene at both temperatures, but they shifted with temperature in the apo structure. Hence, a difference was seen in the preferred Glu108 rotamer upon binding toluene versus iodobenzene at either temperature, whereas the apo structure responded both to ligand binding and temperature. This makes it impossible to deduce from cryo data alone whether residues respond to ligand binding rather than temperature, even for related ligands or neighboring residues. Thus, RT data can help distinguish genuine protein conformational responses to ligand binding from temperature artifacts.
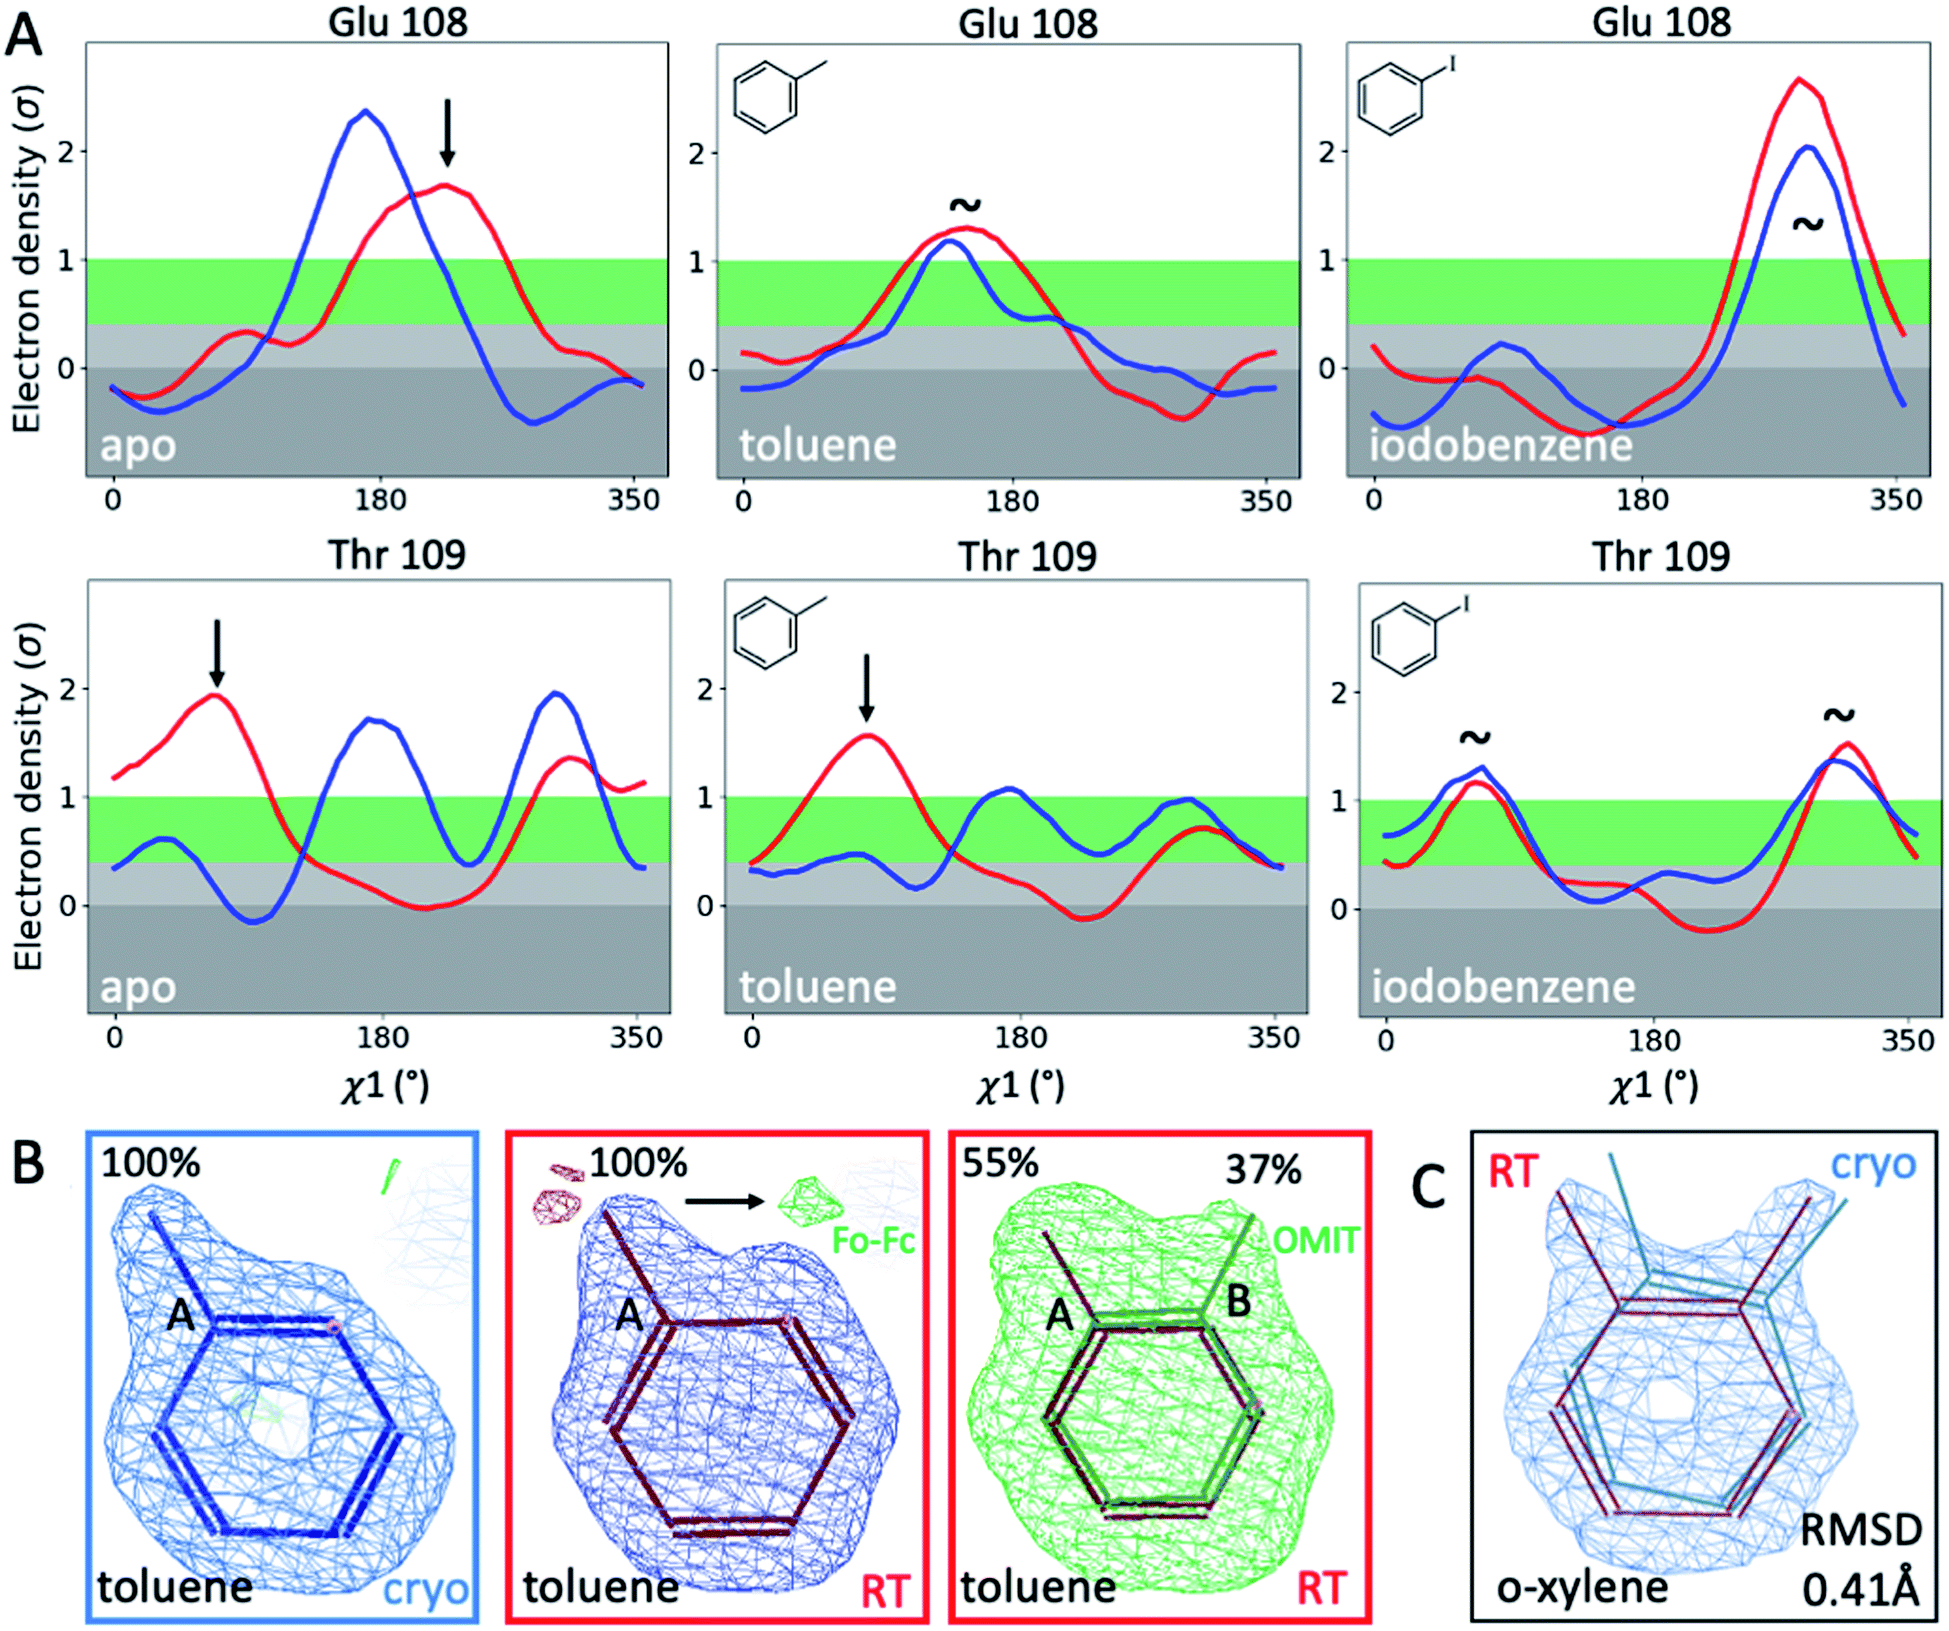 | ||
| Fig. 2 Temperature sensitivity of binding congeneric ligands. (A) Ringer plots compare rotamers for 2 proximal F-helix residues, Glu108 and Thr109, across 3 congeneric structures (apo, bound to toluene, and bound to iodobenzene) in response to temperature (cryo in blue, RT in red). Arrows indicate temperature-sensitive rotamers, and tildes indicate no major rotamer change. (B) Toluene's alternative ligand conformation at RT is indicated by the presence of green Fo − Fc difference density when only the major conformer is included in refinement and confirmed by an unbiased Polder OMIT map that excludes all ligands (here superimposed onto the map for clarity). (C) o-Xylene experiences a 0.41 Å RMSD shift upon changing temperature, while the overall protein structure differs by only 0.2 Å. | ||
Cryogenic cooling changes ligand-binding poses and occupancies
To fathom the impact of temperature on ligand binding, we looked for temperature-induced changes in ligand poses and occupancies. During this project, we collected hundreds of datasets to optimize ligand occupancy. In general, ligand occupancies were lower at RT under similar soaking conditions. This observation agreed with more favorable thermodynamics of ligand binding at lower temperatures, which we previously derived.27 Nonetheless, we observed new ligand-binding poses at RT that were not reported previously. For instance, toluene is modeled as a single conformer in the cryogenic PDB structure 4W53.49 At RT, we noted the presence of significant difference electron density, indicating a second ligand conformation (Fig. 2B). An unbiased Polder-OMIT map confirmed the presence of a second toluene conformation that is rotated by 60°, which is equivalent to the ortho position. When included in refinement, the second conformer converged to 37% occupancy (Fig. 2B), supported by electron density below the conventional 1 sigma cutoff. The co-existence of a second toluene conformer is consistent with the observed binding mode for other ligands, such as o-xylene (Fig. 2C). The o-xylene-binding mode placed methyl groups simultaneously into both positions occupied by the 2 binding modes of toluene (Fig. 2B). A protein-based superposition of the cryo versus RT o-xylene structures showed that the ligand was rotated by as much as 30°, leading to a ligand RMSD of 0.41 Å; the protein RMSD was only 0.21 Å. Given that the o-xylene cryo structure accommodated both methyl groups, we redetermined the cryo structure of toluene to atomic resolution of 1.1 Å. Indeed, we also found the second conformation of toluene in the cryo Fo − Fc maps (ESI Fig. S8†), where it refined to 43% occupancy. While the major conformer observed in the deposited structure 4W53 agrees closely, the RMSD of the minor conformer in our new cryo versus our RTX structure was 0.22 Å. Even in cases that showed no or insufficient electron density to model the ligand, RTX data helped increase confidence in cross-modeling minor states explicitly.58Next, we compared ligand occupancies of the iodobenzene complex, as it showed 2 ligand conformations at RT and cryo, and the high map peaks of the electron-rich iodine increased our confidence in determining occupancies. Automatic occupancy refinement revealed substantial temperature differences (Fig. S9†); relative occupancies changed from 50:49 for conformers A:B in the deposited cryo structure 3dn4 (ref. 59) to 32:19 at RT. The shift in ratio from roughly 1:1 to almost 2:1 corresponds to a shift in relative free binding energy ΔΔGA,B from 0.01 kcal mol−1 to 0.31 kcal mol−1. Together, RMSD and occupancy differences indicated that temperature induces nonsystematic structural changes that affect ligand binding. Alarmingly, the residues that enable and respond to ligand binding appeared to be the ones most affected by cryocooling artifacts. To understand how detrimental such temperature effects are on structure-based ligand discovery, we next examined the impact of such differences on computational predictions of ligand binding. First, we compared experimental protein conformations to simulated ones. Then we compared their performance in ligand docking and free energy calculations.
Cryogenic structures mislead the validation of computational methods
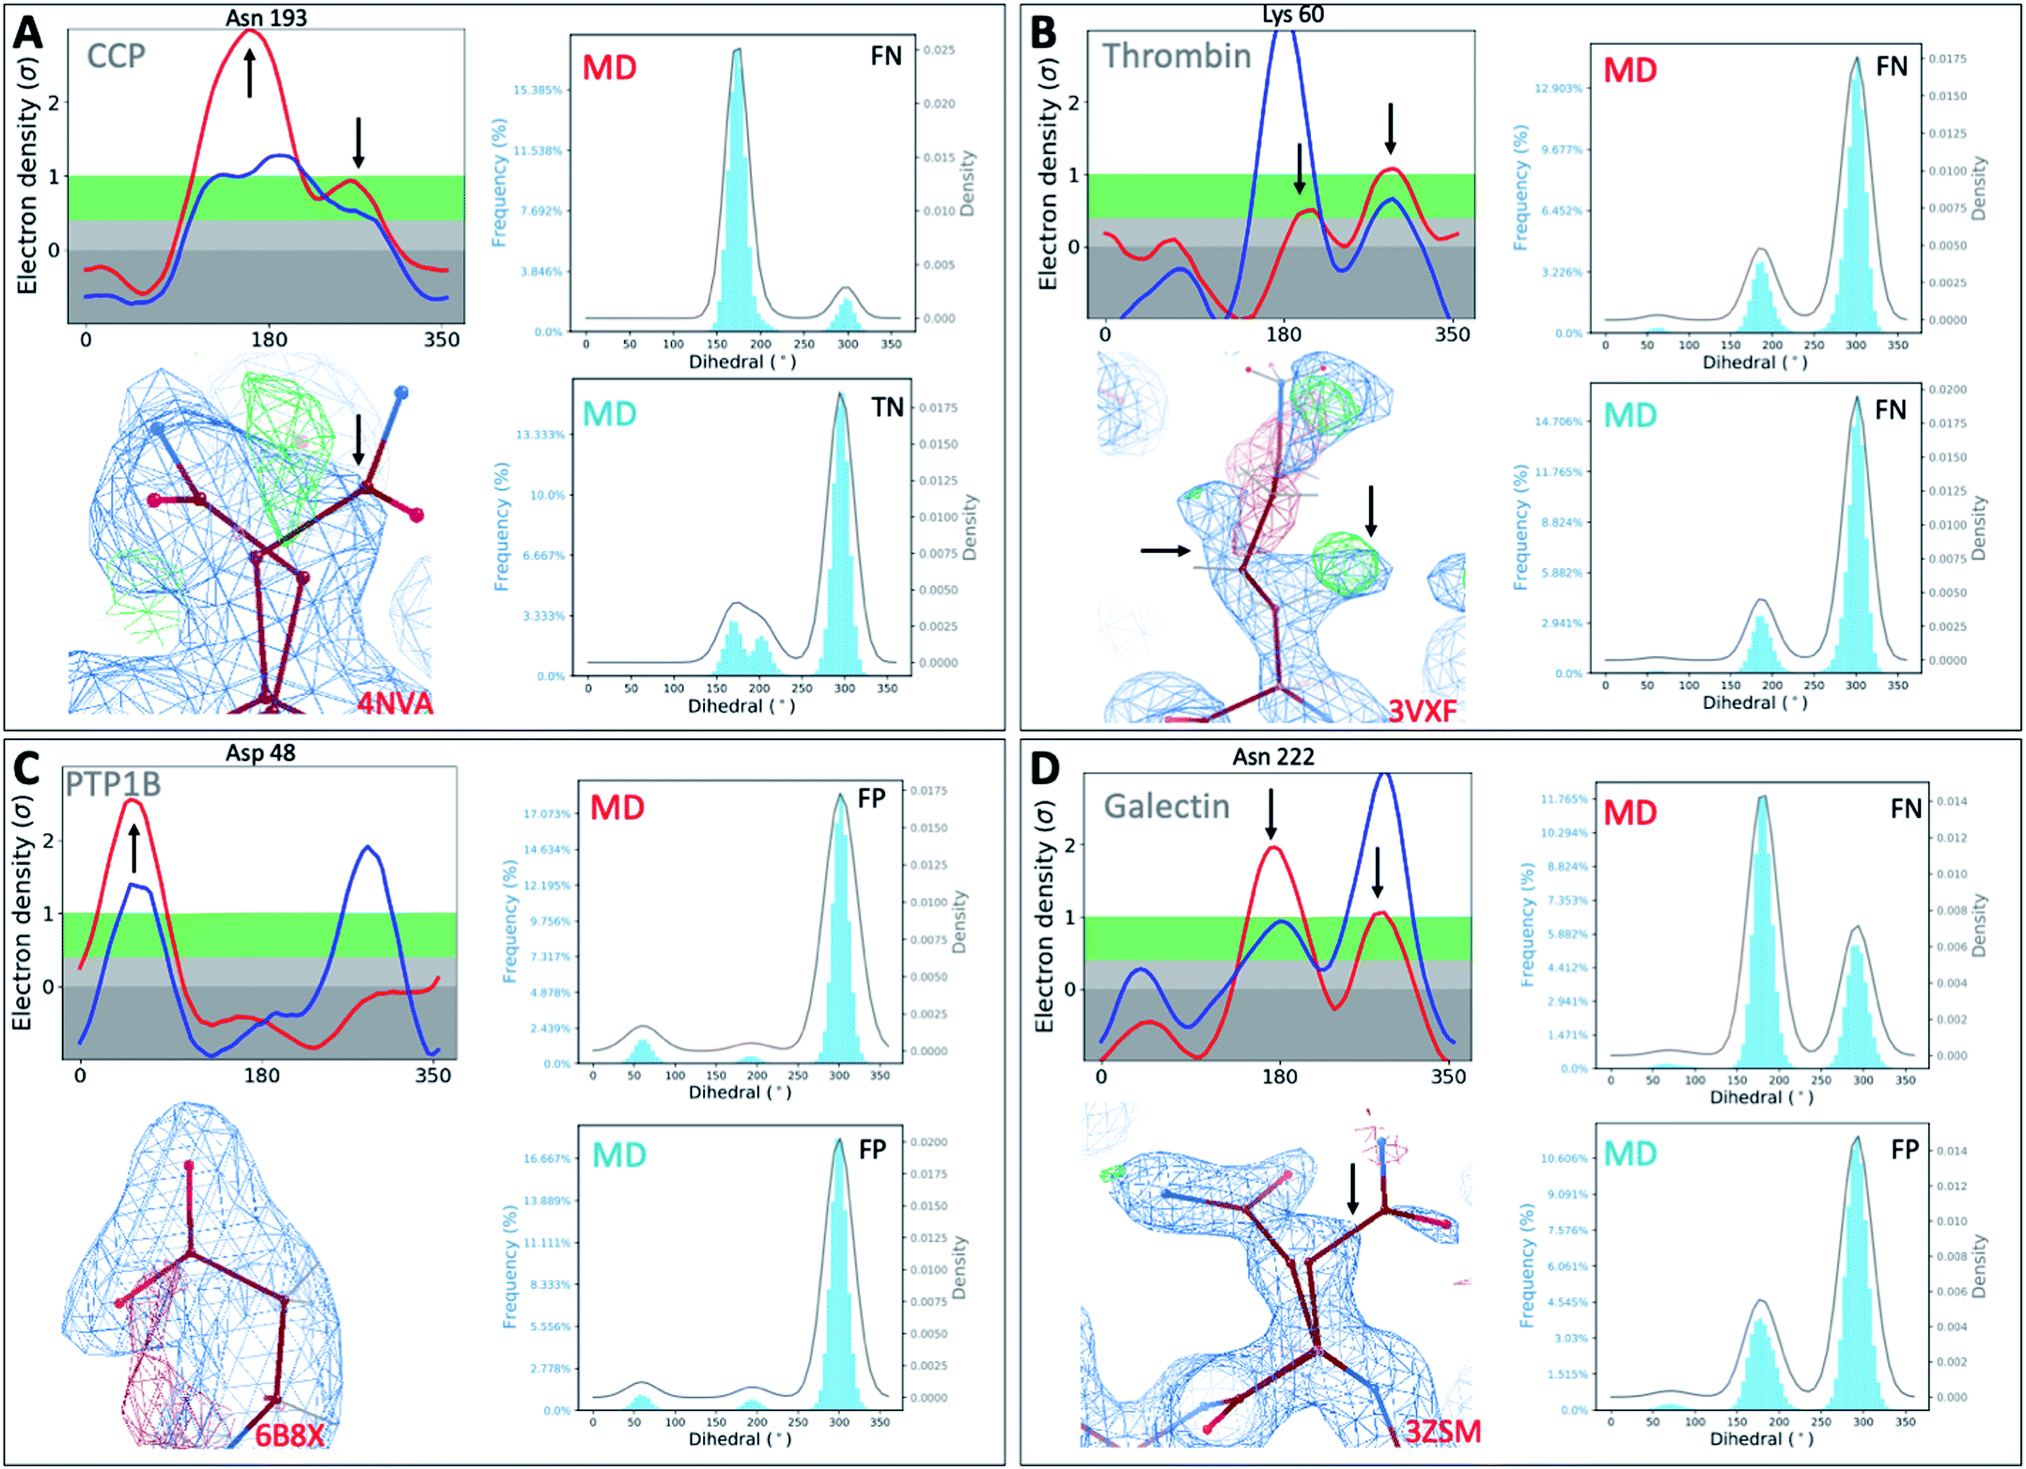
We first set out to address the following question: are apparently wrong simulations really wrong? Because ∼95% of all structures have been collected under cryogenic conditions,23 our results raise the concern that cooling artifacts may misinform computational methods development. Success or failure of computational predictions is typically validated against cryo structures, which in turn, inform methods development. To determine whether the current gold standard of validating against cryo structures misleads computational analyses and method development, we compared structures from molecular dynamics (MD) simulations to the matched RT/cryo temperature pairs of our 9 T4L–ligand and apo structures.To reveal differences between computational and experimental data, we developed an analysis tool that facilitates comparing Ringer plots to MD populations, which we call “Cringer” (available on GitHub, see Methods for details). Briefly, we used Cringer to plot the side-chain rotameric states and the respective frequencies for each residue visited during our MD trajectories using a Gaussian kernel-density estimation (Fig. 3). For simplicity, we focused only on residues that differed with temperature. Results fit into 4 categories: true positives, true negatives, false positives, and false negatives (Fig. 3). Specifically, a true positive is when computation and experiment agree, and a true negative is when they disagree. When comparing computational results to experimental results, it is typically assumed that the experiment is accurate and thus all comparisons of computational to experimental results lead to true positives and true negatives, which can be used to assess computational performance. Furthermore, it is typically assumed that all observed structural changes are responses to ligand binding. In reality, however, experimental biases due to temperature effects may lead to false positives and false negatives, which would invalidate this assumption and make it impossible to distinguish real computational success from failure if only cryo data were available.
 | ||
| Fig. 3 Cryo artifacts misinform computational method validation. Computational Cringer plots derive histograms of rotamer populations of each residue, plotted as a frequency across residual dihedral angles iterated over all frames of an MD simulation. Cringer plots enable comparison to experimental Ringer plots to identify true positives (MD rotamers agree with both RT and cryo), true negatives (MD disagrees with both RT and cryo, which may agree or not), false positives (MD agrees with cryo, both differ from RT) and false negatives (MD agrees with RT, both differ from cryo). Shown here are selected examples of all 4 categories; more examples of false negatives and false positives are provided in the ESI (Fig. S10 and S11†). | ||
Here we focus on 2 categories, false positives and false negatives, which mislead computational methods development. Using Cringer, we found numerous examples in both categories across the protein and in the binding site (ESI Fig. S10 and S11†). For false positives, computational data agreed with cryo data but disagreed with RTX data, meaning that agreement of simulation with cryo was present but artifactual. For instance, MD simulations match the major Met106 rotamer of the o-xylene-bound structure at cryo, but it differed from the rotamer at RT (Fig. 3). Although unsuccessful in recapitulating the RT distribution of this F-helix residue, the cryo comparison would flag this prediction as a success, which would be a false positive. The false-negative category contains cases in which MD simulations disagreed with cryo data but agreed with RTX data. In other words, false negatives are successful cases for RTX and MD that are mistakenly flagged as failures in comparison to cryo. This is exemplified by the simulated Asp72 rotamer distribution in the benzylacetate complex, which captured both the major and minor rotamers at RT but only the minor conformation at cryo (Fig. 3).
Overall, none of our 9 temperature pairs were spared from misleading comparisons. Cringer detected25 false positives and false negatives across all ligand complexes and apo that would misinform methods calibration and validation if only cryo structures were used (ESI Fig. S10 and S11†).
Furthermore, to test the dependence of sampling relevant conformations on the input structure, we started simulations from 3 F-helix states—“closed”, “intermediate”, and “open”49 (ESI Fig. S15, S16 and S42–S44†). As expected for sufficiently converged simulations, differences in Cringer plots were mostly negligible, with a high agreement in the major conformation (ESI Fig. S15†). In some cases, changing the input structure revealed minor rotamers (ESI Fig. S16†). Although sampling minor, high-energy conformers was encouraging, we did not count these as successes; instead, we focused on correctly sampling the major conformation. In some cases, simulations that started from different input structures accessed rare higher-energy conformers otherwise seen only at RT, probably because some starting structures are more prone to trapping than others. For instance, Val111 is known to cause problems in computational sampling by getting “stuck” in local energy minima.56
In the 4-iodotoluene complex, Val111 populated the major conformation present in both RT and cryo data (i.e., a true positive) when the sampling was started from the closed F-helix state to which the ligand preferentially binds. This conformation faded when the intermediate structure was the starting point and was not sampled at all when the open structure was the starting point (ESI Fig. S12†), indicating that high-energy barriers separating these conformations require extended MD sampling. Use of enhanced sampling methods like BLUES60,61 can help accelerate crossings of such energy barriers and sample rotamer transitions. We used BLUES to enhance the side chain sampling of Val 111 in the L99A:iodobenzene complex and apo L99A (ESI Fig. S17,† panel D). Our results showed sampling of rotamer transitions for Val 111 in L99A:iodobenzene. Also, we used BLUES to enhance the binding mode sampling of iodobenzene, ethylbenzene, propylbenzene, butylbenzene, benzylacetate, o-xylene, and p-xylene and found that the dominant binding mode of each BLUES simulations reflected the corresponding crystallographic binding mode (ESI Fig. S30–S36†).
Differences in sampling put the focus on another ingredient of computational success besides the input structure: force fields (FFs). Notably, protein FF parameters are optimized to fit quantum chemistry data but then are improved and validated based on cryogenic structural information. Thus, protein FF parameters are most likely biased by temperature effects. To gauge the impact of the FF on conformational sampling, we compared our primary FF, AMBER ff14SB,62 by testing 2 other AMBER FFs, ff15ipg63 and Force Balance-15 (FB-15).64 The ff14SB FF is widely used in all-atom simulations of protein–ligand complexes in water. The parameters of ff15ipq differ from those of ff14SB; the ff15ipq FF was developed with a self-consistent physical model and rebuilds charges, angles, torsions, and some van der Waals parameters for proteins. The FB-15 FF was developed by refitting the intramolecular bond, angle, and dihedral parameters using the same functional from and parameter set used in the original AMBER FF model (ff94) and its subsequent iterations (ff99sb, ff14SB, etc.).
As part of this test of FFs, we compared Cringer plots corresponding to the residues in and near the binding cavity, which were obtained during the simulations on apo L99A using ff14SB, ff15ipq, and FB-15. Overall, this comparison showed that the 3 FFs captured the same rotamers in almost all cases, but the population of these rotamers (and their relative free energy by extension) depended on the FF (ESI Fig. S37–S40†). Interestingly, our computational results showed that ff14SB captured the correct dominant rotamer population observed in cryo and RTX structures in some cases where ff15SB and FB-15 failed to do so (ESI Fig. S13 and S14†). In turn, the apparent sensitivity to similar FFs raises the possibility that if cryo structures are used for FF validation, FFs might be tuned incorrectly to reproduce differences in cryo structures. At this point, we can only speculate what impact using curated RTX data will have on improving FFs. However, in our simulations subtle differences in the FFs influenced rotamer populations enough to alter agreement with experimental data, suggesting that such data may be useful for FF validation and improvement, especially if it becomes more commonly available.
Temperature-induced structural differences affect docking performance
The choice of structural input affects the quality of computational predictions. To understand the impact of temperature-induced structural differences on computation, we looked at 2 types of methods: rapid, coarse docking methods that are used to prioritize virtual compounds, and slow, rigorous free energy of binding calculations that are used to obtain affinity estimates.To gauge the impact of temperature artifacts on docking performance, we used OEdock65 to dock 63 experimentally confirmed T4L–L99A binders [https://github.com/MobleyLab/lysozyme_binding, from the work of ref. 66], 35 ZINC compounds described as binders,67 and 3152 property-matched DUD-E “decoys”68 (i.e., assumed nonbinders) into different protein structures. We compared the performance of docking to the apo structures at cryo (closed F-helix) and at RT (closed and intermediate F-helix) and to their equilibrated state after a 50 ns MD simulation. To evaluate performance, we looked at 2 metrics that do not necessarily show the same trends:27 enrichment and pose fidelity. Enrichment measures our ability to pick binders from a large library of molecules. The enrichment plots of all 6 input structures showed improved performance over randomly selected molecules (Fig. 4). The equilibrated RTX apo structure in the closed state outperformed all other input structures by using the area-under-the-curve (AUC) and adjusted logAUC metrics (Fig. 4 and ESI Fig. S19†). The experimental closed structures at cryo and RT showed similar logAUC/AUC values, and the intermediate RT structure performed worse in the unequilibrated batch. Adding a step of MD-equilibration improved only the closed state at RT, whereas AUC performance declined by 5% for the other 2 states. The improved logAUC performance of the closed RTX structures, both experimental and equilibrated, emphasized the ability to enrich binders among top-ranked molecules, which are typically the ones prioritized in large docking campaigns. We also examined how well docking scores were correlated across different potentially selected reference structures and found that scores were correlated fairly well across all possible choices (ESI Fig. S18†).
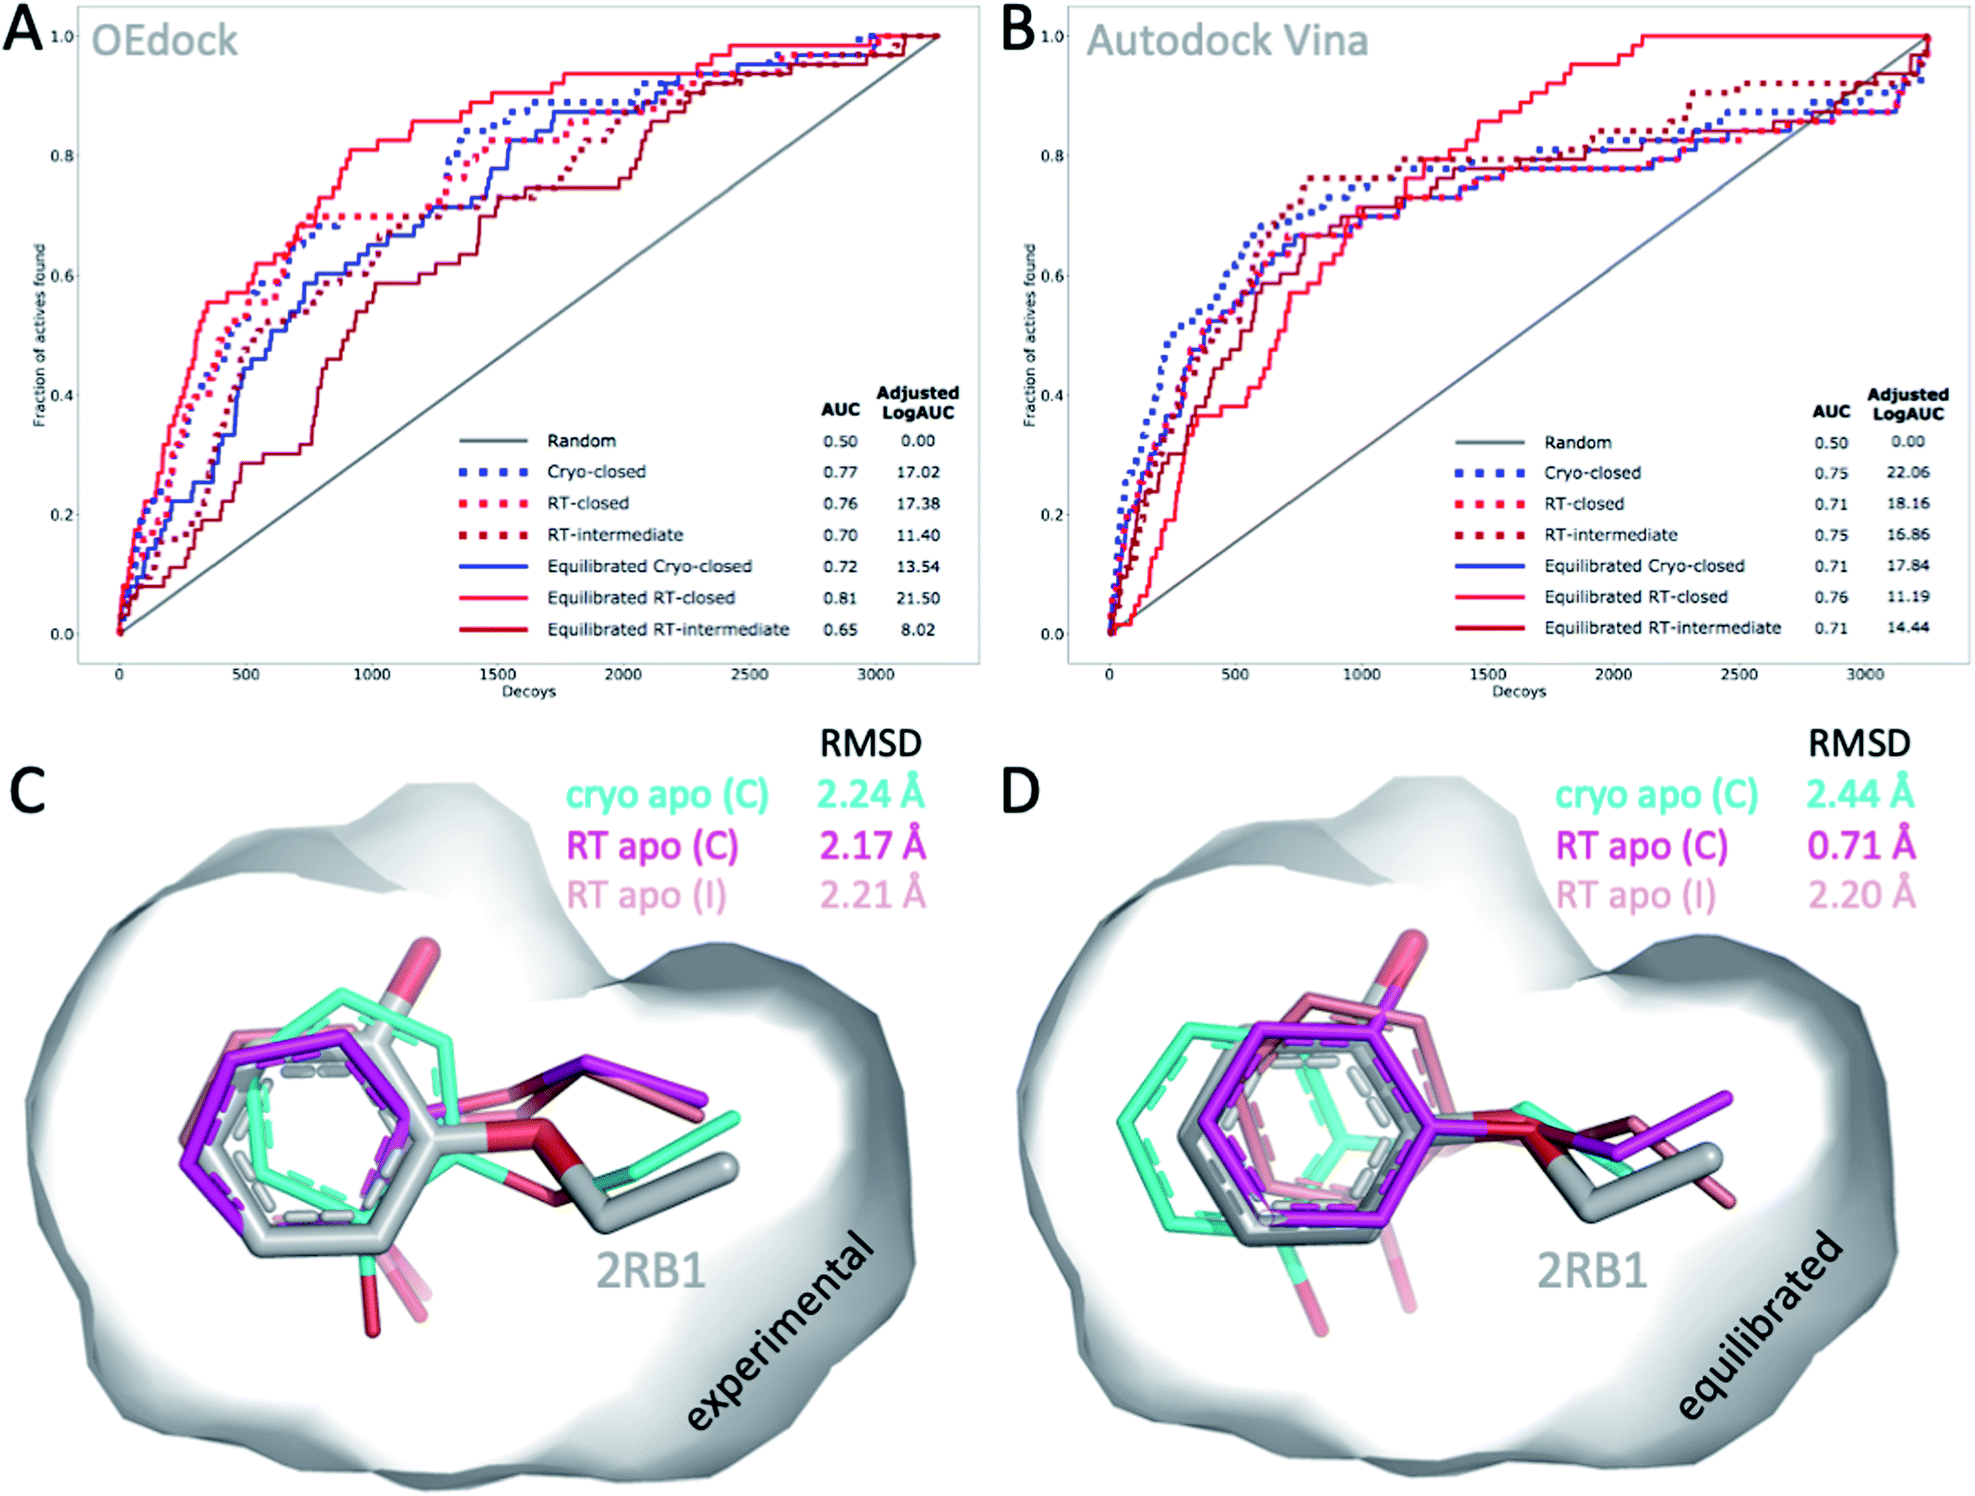 | ||
| Fig. 4 Temperature-induced structural differences affect docking performance. (A) AUC (shown as fractions) and (B) adjusted logAUC (%) enrichment plots from docking 98 known T4L–L99A binders against 3152 property-matched DUD-E decoys using (A) OEdock or (B) Autodock Vina and input structures with a closed and intermediate F-helix conformation; equilibrated structures were generated after 50 ns of MD simulations. (C and D) Docking poses of 2-ethoxyphenol (colored sticks) docked against (C) experimental and (D) equilibrated cryo and RT apo structures (as in A–B) are compared to PDB structure 2RB1 with RMSDs indicated. | ||
With several cryo L99A–ligand structures available, we were able to assess pose fidelity by calculating the RMSDs of predicted ligand poses and comparing those values to the RMSDs of 22 deposited PDB structures (ESI Table S3A†). Comparing the best-ranking docked ligand poses to those observed in the experimental crystal structures, we found that the input structure influenced docking performance, though the effect was highly context-dependent. Typically, several structures generate reasonable RMSDs, but well-performing structures may differ across ligands. There are 2 examples where 1 structure performed much better than the rest. In both cases, the equilibrated closed RTX structure had the best AUC performance. For instance, although the equilibrated closed RTX structure docked 2-ethoxyphenol with an RMSD of 0.7 Å, all other structures struggled to recapitulate this pose and had RMSDs exceeding 2.1 Å, particularly with considerable misplacement of the key phenol OH-group (Fig. 4C). The structure also found the best alternative ligand pose of iodobenzene in what was otherwise the worst ligand in the set, in terms of pose prediction quality (all other RMSDs exceeded 3.6 Å). Nonetheless, this structure produced the 2 worst RMSDs overall for 4-methylthionitrobenzene and 3-methylbenzylazide. MD equilibration compromised the docking performance of propylbenzene, compared to the respective experimental structure. For p-xylene, the situation was reversed, i.e., all equilibrated structures generated ligand poses closer to the experimental reference (ESI Table S3A†). For benzene, the experimental cryo structure performed best before equilibration and worst thereafter. Overall, this dependence of docking results on the choice of structure is not surprising, given that the protein is held rigid while docking. Therefore, the chosen structure partially dictates the outcomes. This is a known limitation of docking methods and the motivation for developing methods like flexible docking or ensemble docking.
In practice, this context-dependence complicates the choice of input structure, especially when a wide variety of chemotypes are being docked that prefer distinct conformational states. However, disentangling RMSD performance based on ligand preference for F-helix conformations helps gain some clarity. Of the 22 structures, 10 ligands stabilized the intermediate F-helix state, 10 bound to the closed state, and 2 bound to the open state. This helps explain why pentyl- and hexyl-benzene rank in the bottom 3 overall: they cannot be properly accommodated because they prefer the open state. Overall, structures that achieved the most cases of lowest RMSDs per ligand were the experimental closed cryo structure, the equilibrated intermediate RTX structure, followed by the experimental intermediate RTX state, which was revealed in the RTX apo structure, and the equilibrated closed RTX structure; the equilibrated cryo structure placed last overall. As exemplified above, comparing predictions to cryo structures may compromise RMSD evaluations when temperature artifacts hide or shift ligand conformations (Fig. 2B). For instance, pose RMSDs of o-xylene docked into cryo or RT structures improved by as much as 0.4 Å (average increase, 0.2 Å), when compared to RTX experimental poses (ESI Table S3B†).
To account for differences between docking algorithms, we repeated the docking experiment using Autodock Vina. Changing the docking algorithm had some notable effects on the 2 performance metrics. For instance, while the equilibrated closed structure at RT performed best, as it did for OEdock by AUC, it surprisingly ranked last, in terms of early enrichment (logAUC) (ESI Fig. S20†). This result stresses the impact of the choice of metric and ultimately the selection of structures for docking. Note also how different curves can lead to the same AUC values (Fig. 4B). Although we observed trends similar to those we saw with OEdock, overall, the experimental closed and intermediate RT structures ranked second by logAUC and AUC analysis, respectively (Fig. 4B and ESI Fig. S20†). Overall, RMSD trends for Autodock (ESI Tables S4 and S5†) were similar to those for OEdock (ESI Table S3†), in terms of which structures produced the best RMSDs. Across all combinations of ligands and structures, both methods achieved RMSD values less than 2 Å for more than half of all docked ligands (59% for OEdock and 66% for Autodock), which is usually considered a successful pose prediction.69 One notable difference was the pose fidelity using harsher RMSD criteria: Autodock achieved 3-fold better pose fidelity than OEdock: 36% and 8% of all docking poses achieved RMSDs below 1 Å and 0.5 Å, respectively, versus 12% and 3% for OEdock. However, given the results of prior studies, these performance differences may be target specific. Although overall similar trends emerged when using OEdock versus Autodock Vina, detailed analysis of docking metrics highlighted the choice of docking software as another considerable variable for drug discovery.
Absolute free energy of binding predictions improve with RTX data
To understand how susceptible rigorous calculations of absolute free energy of binding are to changes in temperature during crystal data collection, we compared calculated free energies of binding (ΔGcalc) to experimental free energies of binding (ΔGexp) for 7 ligands (Table 1).43,59 Using the cryo structures as a starting point to predict ΔGcalc,cryo, we used state-of-the-art calculations in explicit solvent with 20 ns per thermodynamic state using a thermodynamic cycle of 29 states. Overall, the calculations appeared sufficiently converged (ESI Fig. S21–S25†) and showed uncertainties (δcalc) that were comparable to their experimental equivalents (Table 1). The median difference between the predicted ΔGcalc and ΔGexp (ΔΔG) was 0.95 kcal mol−1, with the best prediction for ethylbenzene having a ΔΔG of 0.33 kcal mol−1. For 3 complexes (toluene, iodobenzene, and o-xylene), the difference between ΔGcalc,cryo and ΔGexp exceeded 1 kcal mol−1 (Table 1). To assess whether RTX data can rescue the suboptimal results of these 3 complexes, we repeated the calculations using our new RTX structures in complex with their respective ligands instead of the cryogenic input structures (Table 1 and Fig. S23–S25†). Using the RTX data improved the calculations, on average, by 0.34 kcal mol−1. Although we consider the improvement for toluene negligible, that for o-xylene was 0.65 kcal mol−1 closer to the experimental value, just by changing the temperature during experimental data collection of otherwise identical structures. To put these values into perspective, the temperature-induced error of predicting o-xylene binding was larger than the computational error of predicting the binding of p-xylene and ethylbenzene.| Ligand | Protein | Temp. | ΔGcalc (kcal mol−1) | δ calc (kcal mol−1) | ΔGexp (kcal mol−1) | δ exp (kcal mol−1) | ΔΔG (exp.–calc.) (kcal mol−1) |
|---|---|---|---|---|---|---|---|
| p-Xylene | Holo | Cryo | −4.13 | 0.03 | −4.67 | 0.06 | −0.54 |
| Ethylbenzene | Holo | Cryo | −5.43 | 0.03 | −5.76 | 0.07 | −0.33 |
| Propylbenzene | Holo | Cryo | −5.60 | 0.04 | −6.55 | 0.02 | −0.95 |
| n-Butylbenzene | Holo | Cryo | −5.90 | 0.05 | −6.70 | 0.02 | −0.8 |
| 3-Iodotoluene | Holo | Cryo | −5.56 | 0.04 | n.a. | n.a. | n.a. |
| 4-Iodotoluene | Holo | Cryo | −5.81 | 0.04 | n.a. | n.a. | n.a. |
| Benzylacetate | Holo | Cryo | −3.63 | 0.05 | n.a. | n.a. | n.a. |
| Toluene | Holo | Cryo | −4.1 | 0.03 | −5.52 | 0.04 | −1.42 |
| Toluene | Holo | RT | −4.16 | 0.03 | −5.52 | 0.04 | −1.36 |
| Toluene | Apo | RT | −4.34 | 0.03 | −5.52 | 0.04 | −1.18 |
| o-Xylene | Holo | Cryo | −2.54 | 0.04 | −4.6 | 0.06 | −2.06 |
| o-Xylene | Holo | RT | −3.19 | 0.04 | −4.6 | 0.06 | −1.41 |
| o-Xylene | Apo | RT | −4.18 | 0.05 | −4.6 | 0.06 | −0.42 |
| Iodobenzene | Holo | Cryo | −4.51 | 0.04 | −5.95 | n.a. | −1.44 |
| Iodobenzene | Holo | RT | −4.82 | 0.03 | −5.95 | n.a. | −1.13 |
| Iodobenzene | Apo | RT | −4.54 | 0.03 | −5.95 | n.a. | −1.41 |
Finally, we explored whether our new apo RTX structure would shake off both the temperature and ligand bias imprinted on cryogenic holo protein structures. We found that the simulation trajectories fluctuated much less, and convergence was achieved much earlier across our 3 most problematic cases (toluene, iodobenzene and o-xylene) (Table 1, ESI Fig. S23–S25†). This result suggested that the apo RTX structure is a better starting point for absolute binding free energy calculations that sample both the unbound and bound states. Reaching convergence in one-tenth the time in the absence of a ligand (∼2 ns vs. ∼20 ns) saves valuable computational resources. In addition, if this structure proves superior in general, generating only 1 apo RTX structure instead of multiple ligand-bound structures would ease both RTX data collection and computational setup. Using the apo structure at RT as a starting point for all 3 ligands further improved the agreement with experimental data, on average by 0.64 kcal mol−1. In the best-case scenario for o-xylene, we saw an improvement of 1.65 kcal mol−1 using the RT structure versus the cryo structure (Table 1); this value corresponds to a change in KD by more than 1 order of magnitude. Notably, the improvement was better than the average difference of our 3 most challenging cases from the experimental values, which makes the ΔGcalc,RT,apo of o-xylene the second-best prediction overall. Although RTX data consistently improved the prediction of our 3 most problematic cases with ΔΔGcalc > 1 kcal mol−1, overall the calculated absolute free energies of binding consistently provided less favorable free energies than did those determined by isothermal titration calorimetry (ITC).
Temperature artifacts affect computational methods across protein classes
To investigate whether our observations were limited to T4L, we extended our analysis to 4 other protein classes: an oxidoreductase model system (Cytochrome C Peroxidase – gateless mutant), a protease (Thrombin), a phosphatase (Protein Tyrosine Phosphatase 1B), and a sugar-binding protein (Galectin) for all of which high-resolution RT-cryo pairs are available in the PDB.Comparison of Ringer–Cringer plots confirms that false positives (FP) and false negatives (FN), which mislead computational methods development, are present in all 4 protein systems. Again, FP and FN are not limited to certain regions of each protein but are distributed throughout; none of the 4 binding sites were spared from misleading comparisons (Fig. 5 and S45†). While generally MD simulations starting from RT vs. cryo structures agreed, there are several examples where both produce different results. For instance, while simulations starting from cryo structures would fail for Asn222 in Galectin and Asn193 in CCP, using the RT structure recapitulates the experimental results (Fig. 5). Overall, we see a higher proportion of missed failures (FP) over missed successes (FN). The combined percentage of failures (FP + FN) ranges from 4% for CCP and galectin, to 12% for PTP1B and 18% for thrombin (Table S5†). Consequently, high FP rates of up to 12% (for thrombin) indicate that disagreement with experimental data often goes unnoticed when using only cryo structures. Likewise, many successful predictions (up to 6% across our protein systems) are discarded as failures.
 | ||
| Fig. 5 Temperature artifacts mislead computational validation across protein classes. Ringer–Cringer comparisons reveal hidden differences between experimental data collected at RT (red) or cryo and computational predictions. Several binding site residues are highlighted as false negative (FN), true negatives (TN) and false positives (FP) across four protein systems cytochrome C peroxidase (A), thrombin (B), protein tyrosine phosphatase 1B (C), galectin (D). Respective 2Fo − Fc electron density maps are shown at 1 sigma. See Fig. S45† for more examples. | ||
To test the impact of those temperature induced binding site differences on docking, we docked known ligands and DUDE decoys against unequilibrated (PDB) vs. equilibrated (MD) at either cryo or RT. Our prior work had already established the impact of crystallographic temperature on docking performance for CCP.27 Temperature differences are also born out in differences in docking performance for thrombin and PTP1B. While all input structures showed improved performance over randomly selected molecules, results vary with input structure as expected (Fig. S46 and S47†). With an adjusted logAUC value of 28.5 (where 0 is random), the equilibrated RTX thrombin apo structure outperforms all other input structures (Fig. S46A†) by a significant margin of at least 9% compared to unequilibrated cryo and up to 20% for unequilibrated RTX. Notably, equilibrating the cryo structure lowers AUC performance by 3% compared to the experimental cryo structure. In contrast, the equilibrated cryo structure performs best for PTP1B, where all other structures perform similarly poorly (Fig. S47†).
In our analysis of relative binding free energy results (Tables S6 and S7†), we observe several important issues. First, if we focus on the subset of binding free energy calculations which had smaller errors relative to the originally reported data70 (perturbation 1–3 in Tables S6 and S7†), we find that our results have relatively little dependence on the choice of starting protein structure. For thrombin, the errors for these perturbations are 0.61 ± 0.21 kcal mol−1 for RT structures and 0.40 ± 0.07 kcal mol−1 for cryo structures. For PTP1B, the errors are 0.60 ± 0.16 kcal mol−1 for RT structures and 0.41 ± 0.06 kcal mol−1 for cryo structures. These differences are not statistically significant. However, for those perturbations with relatively larger errors relative to the original experiments (perturbation 4–9 in Tables S6 and S7†), above 1 kcal mol−1, we find that the dependence on the choice of starting structure is larger. Computed relative binding free energies vary by up to 1 kcal mol−1 for thrombin and 4.6 kcal mol−1 for PTP1B kcal mol−1 depending on the choice of starting structure. This effect is hidden when considering that the average differences of those perturbations appear similar at 0.41 ± 0.16 kcal mol−1 and 0.49 ± 0.27 kcal mol−1 for RT and cryo structures of thrombin, and 2.23 ± 1.23 kcal mol−1 and 2.20 ± 1.44 for RT and cryo structures of PTP1B, respectively.
This tells us that, first, poorly predicted relative binding free energies are partly due to poor sampling and convergence of protein motions and, second, these slow protein motions are related to those observed in the differences between RT and cryo structures. For these targets, while we do not observe that RT or cryo structures result in dramatically better predictive performance, this analysis indicates that the differences between these structures are important for binding and that if we neglect the relevant protein motions this will mislead any comparison with experiment. For example, a comparison only with results from cryo structures would yield the conclusion that perturbations 2,3,4,6,8 of thrombin are treated accurately by the force field and model, whereas a comparison with only RT structures would indicate that perturbations 1,5,6,8,9 are treated accurately (Tables S6 and S7;† using a cutoff of 0.5 kcal mol−1); these issues would confound validation of the computational approach. It is also interesting to note that, here, several perturbations which showed relatively large errors in the original work70 had significantly lower error here, despite use of the cryo structure in both cases and an otherwise similar protocol—further suggesting slow protein motions and sampling problems. In summary, we find that differences between RT and cryo structures correspond to slow protein motions which can adversely impact the convergence and accuracy of relative binding free energy calculations, and these differences are particularly common for transformations which had high errors initially.
Discussion
Current rational ligand discovery operates under the assumption that a representative conformational ensemble is trapped upon cryocooling, which enables ligand-binding predictions and validation. However, we and others have shown that RTX, at synchrotron and free electron laser sources, provides novel insights into hidden conformational states of functional importance that may be missed otherwise. Here we have examined the extent to which these assumptions hold true in the widely used T4L–L99A model binding site as well as 4 other protein classes. The T4L system has been studied exhaustively for decades, with hundreds of PDB structures available. Still, our RTX provides novel insights that could not be gained otherwise. Our systematic study raises concerns that temperature artifacts in cryo structures compromise computational structure-based drug design by interfering with calibration, validation, and application of these methods to discover bioactive molecules. Three important implications for structure-based ligand discovery emerge. First, temperature artifacts compromise our global and local understanding of protein–ligand structures. Second, validating against cooled structures misinforms the development of computational methods. Third, cryo artifacts affect the docking performance and free energy of binding calculations.Cryogenic structures are less homogeneous than those collected at RT, though an increase in thermal mobility with temperature would suggest otherwise.25,29 Pairwise comparisons of electron density maps revealed temperature-induced conformational changes across the entire protein structure not just at compacted crystal-packing interfaces. For ligand discovery, ligand-binding sites appear most sensitive to cryogenic cooling practices. By nature's design, binding-site malleability enables proteins to accommodate diverse ligands and tailor their conformational response to changes in the environment, such as pH, pressure, mutation and temperature. In turn, changing these variables, intentional or not, enables one to probe the protein's conformational landscape. Matthews et al. reported that T4L mutations are accommodated mainly by backbone shifts and rarely by rotamer changes;39 however, we observed wide-spread rotamer differences when we changed the temperature. Protein motions span a wide range of timescales, from millisecond motions of large domains, to nanosecond rotamer changes, and picosecond water dynamics. These timescales do not align with the rate of cooling. In addition, high variability originates from experimental inconsistencies, such as plunging speed through changing LN2 gas layers when cooling crystals of different sizes. This leads to the trapping of a nonequilibrated mix of conformational states at cryo that complicates the analysis and use of these structures. Analogously, in computation we would not expect to obtain millisecond domain motions from a microsecond MD simulation, nor would we expect a simulation started from an unfolded or misfolded protein to rapidly reveal the true folded state if the simulation timescale is far less than the folding time. Indeed, RTX data showed that idiosyncratic changes due to temperature are common. In fact, none of the binding sites of our 8 ligand structure pairs were spared temperature-induced rotamer changes. We saw differences in Val111 for more than half of the ligand complexes. This residue causes problems in computation due to high-energy barriers that prevent it from reorienting on simulation timescales. The increase in temperature appeared to lower such energy barriers and enable the residue to populate the high-energy, rare states in the crystallographic experiment. RTX may help overcome kinetic trapping and MD dependence on starting conformation. Different conformations of neighboring residues binding to nearly identical ligands could be mistaken for genuine responses to ligand binding if cryo structures were used alone, as is common in drug discovery.
Given these observations, we recommend caution when interpreting cryo structural data on ligand binding. In the best-case scenario, cryo structures may provide drug design guidance, despite their high likelihood of harboring hidden distortions, as seen for some of the docking. In the worst-case scenario, idiosyncratic temperature effects may result in costly medicinal chemistry detours misled by erroneous structure/activity relationships – despite the availability of what appears to be the gold standard cryo structures at high-resolution. When only cryo data are examined, there is no telling if the observed changes are legitimate or artifactual. Also, computational errors caused by temperature artifacts and algorithmic imperfections may amplify changes or cancel them out. Again, precision of atomic resolution does not imply real-life accuracy.
Beyond the protein, ligands also shift positions, change occupancy, or disappear upon cooling. For instance, the o-xylene ligand in the RT versus cryo structure had an RMSD of 0.41 Å, whereas the protein RMSD was only 0.2 Å. Although an RMSD of 0.41 Å would be judged a success for a computational docking prediction, this is a considerable difference in the observed binding mode caused by the cooling process alone. Re-determining the cryo toluene dataset to atomic resolution supports the idea of using RTX datasets to look for features that may lie dormant in cryogenic datasets and vice versa.58
It is no secret that the computational search for bioactive molecules makes crude assumptions. In contrast, experimental data are often assumed to be the only reliable “truth” against which computational results are validated and methods are improved. While errors associated with experimental methods, such as ITC, have been acknowledged,71 structural data are still widely trusted without consulting the primary experimental evidence—the electron density map. At any temperature, electron density maps often hold clues of missing or fictitious features,72 especially below the conservative 1 sigma threshold.55 These can be subtle but informative. We introduced our analysis tool, Cringer, to help identify genuine discrepancies in RT, cryo, and simulated structures; and made this tool openly accessible to aid computational benchmarking. Finding many false-positive and/or false-negative results across every matched temperature pair and across protein classes suggested that computational flaws frequently go unnoticed, and successes may be discarded. The wide-spread occurrence of such results also suggests that it is unlikely that any cryo structure will be spared from deceptive temperature effects. In terms of methods development, such experimental flaws may get incorporated into computational methods, at least to the extent that protein FFs are tuned, in part, to ensure that proteins are stable in experimental cryo structures.
Given the differences between similar FFs used in this study (e.g., differences in dominant rotamers in MD simulations as we varied the protein FF), it may be very interesting in the long term to use RT structures, including rotamer occupancy data like that examined here, to help test and improve protein FFs. Other approaches may likewise be affected, such as integrative structural biology,73 which aims to combine experiments and simulation into a useable framework to better understand biology.18,19 Again, understanding the limitations of nonequilibrium experimental data and their associated errors is key to leveraging the synergy of experiments and simulations to their full potential.
Along these same lines, this work has potential implications for testing FFs used in molecular simulations. If our models and FFs are tested against cryo data, their performance would appear worse (at least in terms of side-chain rotamer populations and ligand binding modes), whereas computational results would better agree with those from RT. Additionally, different FFs give different rotamer populations in some cases, and using cryo structures to evaluate which FF performed best, would lead to incorrect conclusions. For slow side-chain motions, adequate rotamer sampling can be achieved, in some cases, using enhanced sampling methods like BLUES.
Finally, the exquisite temperature sensitivity of the binding site affects the utility of cryo structures. Consulting artifactual conformations can mislead ligand discovery, design, and/or protein evolution. Hence, we expected computational performance to follow the “garbage-in/garbage-out” philosophy. Our findings show that a “blunt” tool like docking can appear relatively unaffected by cryogenic imperfections, at least in terms of overall enrichment. However, RTX and equilibrated data can provide alternative inputs. For instance, revealing the hidden intermediate F-helix in the T4L apo structure by RTX provides opportunities to find molecules that specifically stabilize alternative high-energy conformational states. Despite all the convolution, critically considering docking metrics can provide some guidance. For instance, the equilibrated intermediate RTX structure performed worst by AUC measures but ranked second by RMSD, an observation consistent with the fact that most ligands bind to the latter state. Previously, we showed that using alternative loop states to assign Boltzmann-weighted energy penalties can improve docking performance.27 A 40% change in occupancy of the major conformation corresponded to a Boltzmann energy of the major closed state of around 0.3 kcal mol−1, which is about 2-fold higher than the penalty for the major loop of cytochrome C peroxidase that reshuffled the docking ranks and led to the discovery of ligands that would not have been found otherwise.27 One of the take-aways from expanding docking to other protein classes is that an RTX structure, when available or obtainable,23 appears to provide a more “even-keeled” docking template than a cryo structure. Interestingly, the best docking improvement was seen for MD-equilibrated RTX structure of thrombin, which also happened to show the largest rate of false positives and false negatives of any system studied here. While cryo structures may outperform other input data despite their structural pathologies due to the crudeness of the calculation, they may also surrender to those artifacts and perform worse. A Boltzmann docking approach that uses either experimental27 or computational74 energy weights, may provide an alternative route. Finally, the fact that empirical scoring functions used in most docking algorithms are derived from cryogenic structures might suggest a deeper problem of cryo artifacts being “baked” into current empirical scoring functions.
Rigorous free-energy calculations appear to benefit more from RTX input structures for T4L. MD-based free energy calculations starting from apo RTX structures converged faster and gave more accurate results. At least for this target, we found that using the apo RTX structure saved both computational and experimental resources because we needed only 1 RTX structure. Alternatively, with increasing MD simulation time, cryogenic and RTX structures became increasingly indistinguishable, as simulations begun at the cryo structure relaxed to something more like the RTX structure. By extending to 4 other protein classes we find that differences between cryo and RT structures correspond to slow protein motions which sometimes adversely impact the convergence and accuracy of relative binding free energy calculations, and these differences are particularly common for transformations which had high errors initially.
Several caveats of this study merit mentioning. First, very long simulations may lead to the same converged state independent of the starting structure; however, a state that differs from the experimental input structure may not be more useful for ligand discovery, in spite of costly computation. Advances in making longer timescales that are important for many biologically relevant processes accessible to simulation has recently been exemplified by exascale SARS-CoV-2 simulations.10 Leveraging such computational power could provide an additional avenue to remedy some of the issues our work has revealed. Also, the discussed benefits of apo structure may not hold for all targets, i.e., if the apo structure does not populate conformations relevant to ligand binding, representative holo or simulated structures are needed. Both alternatives add bias: ligands imprint features onto the protein surface, and calculations lead further away from experimental observations. If not collected carefully, RT data will contain another source of error, radiation damage, that may change molecular structure.75,76 With measures to prevent damage in place, conformational variation in proteins is observed, despite radiation damage not as a consequence of it.77
To reflect common computational practices, we ran simple docking implementations to gauge whether changes in the major state would change the results. However, the presence of experimental minor or alternate states and conformational ensembles most likely also affect the results of the computation. These are typically ignored, however, as scripts that “prepare” a structure for docking typically discard minor states. Thus, a sea change is needed in the modeling approach to such structures, to retain these carefully modeled and informative alternate features. An often overlooked inadequacy of evaluating docking results is the difference between scoring and sampling failures. Typically, only the single top-ranking pose per compound is reported, hiding whether the correct pose was overlooked or not sampled at all; a lower ranking, equi-energetic alternative pose may agree with RTX data. Finally, weak, promiscuous ligands, such as fragments, are likely more affected by alternative poses than a nanomolar drug candidate. Because such fragments are often the starting point that guides drug-discovery efforts, RTX may prove especially useful for fragment-based ligand discovery.78
These caveats should not distract from the main result of this paper—RTX data can provide instructive guidance to ligand discovery and design, methods improvement and integration, and protein evolution. It can also provide novel insights into the conformational energy landscape of protein–ligand complexes, even for exhaustively studied targets like T4L. Ongoing improvements in automation, refinement, and analysis tools will help us detect and model rare conformational states confidently.49 Given the nonsystematic impact of cryocooling, a cryo structure alone cannot clarify 2 important questions: which conformations are temperature artifacts, and which missing conformations could be revealed at RT? Ultimately, all structures are measured by their value in advancing our understanding of protein function and our ability to modulate malfunction in disease. The data presented here suggest that RT structures can provide key insights that are not apparent in cryo structures.
Experimental
Crystallography
000×g for 1 hour and then purified on a Ni-NTA column (GE Healthcare Life Sciences) at 4 °C, with a buffer of 50 mM sodium phosphate (pH 7), 0.2 M NaCl, and 5 mM 2-mercaptoethanol. The Ni-NTA column was then eluted with imidazole gradients in the same buffer, and the elution was concentrated to 10 mg mL−1 and dialyzed overnight in 50 mM sodium phosphate (pH 6.6), 0.2 M KCl, 5 mM 2-mercaptoethanol. The dialyzed elution was further concentrated the next day and loaded onto an SD75 26/60 column (GE Healthcare Life Sciences) for size-exclusion chromatography (SEC) within freshly prepared dialysis buffer. The SEC fractions were concentrated to 10 mg mL−1, aliquoted, flash-cooled in liquid-nitrogen, and stored at −80 °C until needed. Protein purity exceeded 95% by SDS-PAGE.
:1 drop ratio of protein to solution and over a well solution of 0.1 M tris-hydrochloride (pH 8), 20–26% (w/v) PEG 4000, 70–170 mM lithium citrate, 8–18% 2-propanol, 50 mM 2-mercaptoethanol, and 50 mM 2-hydroxyethyl disulfide. Diamond-shaped crystals grew within a month. Fresh well solution containing an additional 30% (w/v) ethylene glycol served as the cryo solution. Ligands were soaked overnight into the crystals in the cryo solution containing 50–100 mM ligands at cryo (100 K) or RT (278 K). Hundreds of datasets were collected at the APS beamline ID-24 during the course of this project and were prioritized based on data, electron density map quality, and ligand occupancy. Halogenated compounds were chosen for clearer visibility in electron density maps and higher confidence in the assignment of occupancies and poses.
Computational approach and methods
To avoid bias in the interpretation of results, all experiments and computations were conducted double-blind at the 2 sites (St. Jude and UCI), and experimental and computational data were compared and assessed only at the point of writing this manuscript.System setup. Crystallographic structures of T4 lysozyme (L99A) complexes were downloaded from the RCSB Protein Data Bank (rcsb.org).82 For iodobenzene, toluene, and o-xylene, we also used the L99A RT co-crystal structures to set up additional binding free energy calculations. Furthermore, we added iodobenzene, toluene, and o-xylene to the new apo RT structure of L99A to form 3 complexes (apo RT with iodobenzene, toluene, or o-xylene) on which we performed binding free energy calculations. For each system, we first used pdbfixer 1.4 (ref. 83) to remove the ligands and water molecules from the PDB structures and to add the missing heavy atoms to the receptors. Then, we used PDB2PQR web server84 to protonate the protein's residues at pH 7 and to rename the residues/atom according to the AMBER naming scheme. The resulting pqr files were converted to PDB files using ParmEd 2.7.4 (https://github.com/ParmEd/ParmEd). All the studied ligands were considered neutral and were protonated using Chimera 1.12.85 Lastly, we converted the PDB files of the ligands to mol2 files using OpenEye toolkits (OpenEye Scientific Software). The receptors and ligands were modeled using AMBER ff14SB86 and GAFF version 2 (ref. 62) FFs, respectively. We solvated the protein–ligand systems by using the TIP3P water model87 in a cubic box with 12 Å padding. Na+ and Cl− counter ions were then added to neutralize the system and achieve a buffer concentration of 50 mM. Further details on the system's setup are provided in the ESI Appendix, ESI Methods,† and the GitHub repository linked to this paper.
Absolute binding free energy simulations. All alchemical binding free energy calculations were conducted using YANK 0.17.0 (http://getyank.org/0.17.0). The alchemical pathway included 29 manually selected thermodynamic states in explicit solvent, and all simulations were run in the NPT ensemble at 300 K with a pressure of 1 atmosphere. Long-range electrostatic interactions were calculated using the particle mesh Ewald method,88 with a nonbonded cutoff of 11 Å. Orientational Boresch-style restraints89 were applied to keep the ligand in a single-binding mode during the simulations; a set of 1 bond, 2 angles, and 3 dihedral restraints was used. We used a spring constant of 20 kcal mol−1 Å−2 for the bond restraint, while the angle and dihedral restraints were set at 20 kcal (mol per radians). We gradually turned on these restraints throughout the thermodynamic states using a lambda set of 29 windows. More technical details about the binding free energy calculations are provided in the ESI Appendix, ESI Methods,† and in the GitHub repository linked to this paper.
A reference ligand (toluene extracted from 4W53 and aligned with the 6 different protein structures) was used to localize the binding site. Then the scores were ranked and the metrics (AUC, logAUC, and RMSD) were calculated. The RMSDs were calculated relative to the cryo and the RT crystal structures of each ligand. We used Chimera to align the active site of each L99A complex used for docking to its corresponding crystal structure. The alignment of the active site was done within 5 Å of the ligand. Then we computed the RMSD values with Chimera and accounted for ligand symmetry. The semilog plots and the adjusted logAUC were calculated, as described by Mysinger and Shoichet.68 All the analysis tools used to calculate the docking metrics can be found on GitHub (https://github.com/MobleyLab/T4L-temperature-effects).
For OEdock, we used a combination of 2 scoring functions: Chemgauss365 for the exhaustive search scoring, which was followed by optimization scoring using Chemscore.97 Chemgauss3 accounts for the hydrogen bonds between the ligand and protein, hydrogen-bonding interactions with implicit solvent, and metal–chelator interactions. Furthermore, Chemgauss3 uses Gaussian smoothed potentials to evaluate the shape complementarity of the ligand to the protein's binding site. Chemscore is a sum of the following interaction contributions: lipophilic, hydrogen bonding, metal–chelator, clashes, and rotatable bonds.
Data availability
Crystallographic coordinates and structure factors for all structures have been deposited in the PDB with the following accessing codes: 7L38, 7L37, 7L3A, 7L39, 7L3B, 7L3C, 7L3E, 7L3D, 7L3G, 7L3F, 7L3H, 7L3I, 7L3K, 7L3J. Additional scripts and information are available at GitHub at https://github.com/MobleyLab/T4L-temperature-effects.Author contributions
M. F., and D. L. M. designed research; S. Y. C. B, L. K., Y. G. and M. F. performed research; L. K. and M. O. contributed new reagents/analytic tools; S. Y. C. B, L. K., Y. G., D. L. M. and M. F. analyzed data; M. F. wrote the original draft of the paper; S. Y. C. B, L. K., Y. G., D. L. M. and M. F. edited the paper.Conflicts of interest
D. L. M. serves on the scientific advisory board for OpenEye Scientific Software and is an Open Science Fellow with Silicon Therapeutics.Acknowledgements
We thank Dr A. J. McArthur and C. M. Fischer for critical reading of the manuscript, the Center for Biomolecular X-Ray Crystallography and the Protein Productions Facility at St. Jude for technical assistance, and all APS beamline scientists at SERCAT beamline for uncompromising support. This work was supported by the American Lebanese Syrian Associated Charities (ALSAC) (to MF), grants from the National Institutes of Health (1R01GM108889-01 and 1R01GM124270-01A1) (to DLM), and the UC Multicampus-National Lab Research and Training Program (award #LFR-17-476732) from the UC Office of the President (to DLM). DLM and LEK acknowledge OpenEye Scientific Software for an academic license to the OpenEye software used in this work and NVIDIA Corporation for the donation of hardware on which part of the computational work was conducted. The content of this paper is solely the responsibility of the authors and does not necessarily represent the official views of the National Institutes of Health.References
- J. Lyu, S. Wang, T. E. Balius, I. Singh, A. Levit, Y. S. Moroz, M. J. O'Meara, T. Che, E. Algaa, K. Tolmachova, A. A. Tolmachev, B. K. Shoichet, B. L. Roth and J. J. Irwin, Nature, 2019, 566, 224–229 CrossRef CAS PubMed.
- D. L. Mobley and M. K. Gilson, Annu. Rev. Biophys., 2017, 46, 531–558 CrossRef CAS PubMed.
- R. O. Dror, H. F. Green, C. Valant, D. W. Borhani, J. R. Valcourt, A. C. Pan, D. H. Arlow, M. Canals, J. R. Lane, R. Rahmani, J. B. Baell, P. M. Sexton, A. Christopoulos and D. E. Shaw, Nature, 2013, 503, 295–299 CrossRef CAS PubMed.
- J. A. Erickson, M. Jalaie, D. H. Robertson, R. A. Lewis and M. Vieth, J. Med. Chem., 2004, 47, 45–55 CrossRef CAS PubMed.
- M. Feher and C. I. Williams, J. Chem. Inf. Model., 2009, 49, 1704–1714 CrossRef CAS PubMed.
- M. Karplus and J. A. McCammon, Nat. Struct. Biol., 2002, 9, 646–652 CrossRef CAS PubMed.
- J. L. Klepeis, K. Lindorff-Larsen, R. O. Dror and D. E. Shaw, Curr. Opin. Struct. Biol., 2009, 19, 120–127 CrossRef CAS PubMed.
- C. R. Knoverek, G. K. Amarasinghe and G. R. Bowman, Trends Biochem. Sci., 2019, 44, 351–364 CrossRef CAS PubMed.
- T. J. Lane, G. R. Bowman, K. Beauchamp, V. A. Voelz and V. S. Pande, J. Am. Chem. Soc., 2011, 133, 18413–18419 CrossRef CAS PubMed.
- M. I. Zimmerman, J. R. Porter, M. D. Ward, S. Singh, N. Vithani, A. Meller, U. L. Mallimadugula, C. E. Kuhn, J. H. Borowsky, R. P. Wiewiora, M. F. D. Hurley, A. M. Harbison, C. A. Fogarty, J. E. Coffland, E. Fadda, V. A. Voelz, J. D. Chodera and G. R. Bowman, Nat. Chem., 2021, 13, 651–659 CrossRef CAS PubMed.
- R. M. Stein, H. J. Kang, J. D. McCorvy, G. C. Glatfelter, A. J. Jones, T. Che, S. Slocum, X. P. Huang, O. Savych, Y. S. Moroz, B. Stauch, L. C. Johansson, V. Cherezov, T. Kenakin, J. J. Irwin, B. K. Shoichet, B. L. Roth and M. L. Dubocovich, Nature, 2020, 579, 609–614 CrossRef CAS PubMed.
- J. J. Irwin and B. K. Shoichet, J. Med. Chem., 2016, 59, 4103–4120 CrossRef CAS PubMed.
- J. D. Chodera, D. L. Mobley, M. R. Shirts, R. W. Dixon, K. Branson and V. S. Pande, Curr. Opin. Struct. Biol., 2011, 21, 150–160 CrossRef CAS PubMed.
- L. Wang, Y. Wu, Y. Deng, B. Kim, L. Pierce, G. Krilov, D. Lupyan, S. Robinson, M. K. Dahlgren, J. Greenwood, D. L. Romero, C. Masse, J. L. Knight, T. Steinbrecher, T. Beuming, W. Damm, E. Harder, W. Sherman, M. Brewer, R. Wester, M. Murcko, L. Frye, R. Farid, T. Lin, D. L. Mobley, W. L. Jorgensen, B. J. Berne, R. A. Friesner and R. Abel, J. Am. Chem. Soc., 2015, 137, 2695–2703 CrossRef CAS PubMed.
- B. Sherborne, V. Shanmugasundaram, A. C. Cheng, C. D. Christ, R. L. DesJarlais, J. S. Duca, R. A. Lewis, D. A. Loughney, E. S. Manas, G. B. McGaughey, C. E. Peishoff and H. van Vlijmen, J. Comput.-Aided Mol. Des., 2016, 30, 1139–1141 CrossRef CAS PubMed.
- Z. Cournia, B. Allen and W. Sherman, J. Chem. Inf. Model., 2017, 57, 2911–2937 CrossRef CAS PubMed.
- R. Abel, L. Wang, D. L. Mobley and R. A. Friesner, Curr. Top. Med. Chem., 2017, 17, 2577–2585 CrossRef CAS PubMed.
- S. Orioli, A. H. Larsen, S. Bottaro and K. Lindorff-Larsen, Prog. Mol. Biol. Transl. Sci., 2020, 170, 123–176 CAS.
- S. Bottaro and K. Lindorff-Larsen, Science, 2018, 361, 355–360 CrossRef CAS PubMed.
- K. Henzler-Wildman and D. Kern, Nature, 2007, 450, 964–972 CrossRef CAS PubMed.
- I. Peran and T. Mittag, Curr. Opin. Struct. Biol., 2020, 60, 17–26 CrossRef CAS PubMed.
- K. A. Henzler-Wildman, M. Lei, V. Thai, S. J. Kerns, M. Karplus and D. Kern, Nature, 2007, 450, 913–916 CrossRef CAS PubMed.
- M. Fischer, Q. Rev. Biophys., 2021, 54, e1 CrossRef PubMed.
- E. F. Garman and R. L. Owen, Acta Crystallogr., Sect. D: Biol. Crystallogr., 2006, 62, 32–47 CrossRef PubMed.
- M. Fischer, B. K. Shoichet and J. S. Fraser, ChemBioChem, 2015, 16, 1560–1564 CrossRef CAS PubMed.
- J. F. Darby, A. P. Hopkins, S. Shimizu, S. M. Roberts, J. A. Brannigan, J. P. Turkenburg, G. H. Thomas, R. E. Hubbard and M. Fischer, J. Am. Chem. Soc., 2019, 141, 15818–15826 CrossRef CAS PubMed.
- M. Fischer, R. G. Coleman, J. S. Fraser and B. K. Shoichet, Nat. Chem., 2014, 6, 575–583 CrossRef CAS PubMed.
- J. S. Fraser, M. W. Clarkson, S. C. Degnan, R. Erion, D. Kern and T. Alber, Nature, 2009, 462, 669–673 CrossRef CAS PubMed.
- J. S. Fraser, H. van den Bedem, A. J. Samelson, P. T. Lang, J. M. Holton, N. Echols and T. Alber, Proc. Natl. Acad. Sci. U. S. A., 2011, 108, 16247–16252 CrossRef CAS PubMed.
- D. A. Keedy, L. R. Kenner, M. Warkentin, R. A. Woldeyes, J. B. Hopkins, M. C. Thompson, A. S. Brewster, A. H. Van Benschoten, E. L. Baxter, M. Uervirojnangkoorn, S. E. McPhillips, J. Song, R. Alonso-Mori, J. M. Holton, W. I. Weis, A. T. Brunger, S. M. Soltis, H. Lemke, A. Gonzalez, N. K. Sauter, A. E. Cohen, H. van den Bedem, R. E. Thorne and J. S. Fraser, Elife, 2015, 4, e07574 CrossRef PubMed.
- D. A. Keedy, Z. B. Hill, J. T. Biel, E. Kang, T. J. Rettenmaier, J. Brandão-Neto, N. M. Pearce, F. von Delft, J. A. Wells and J. S. Fraser, Elife, 2018, 7, e36307 CrossRef PubMed.
- M. Warkentin, V. Berejnov, N. S. Husseini and R. E. Thorne, J. Appl. Crystallogr., 2006, 39, 805–811 CrossRef CAS PubMed.
- M. Warkentin and R. E. Thorne, J. Appl. Crystallogr., 2009, 42, 944–952 CrossRef CAS PubMed.
- B. Halle, Proc. Natl. Acad. Sci. U. S. A., 2004, 101, 4793–4798 CrossRef CAS PubMed.
- H. van den Bedem, A. Dhanik, J. C. Latombe and A. M. Deacon, Acta Crystallogr., Sect. D: Biol. Crystallogr., 2009, 65, 1107–1117 CrossRef CAS PubMed.
- D. A. Keedy, J. S. Fraser and H. van den Bedem, PLoS Comput. Biol., 2015, 11, e1004507 CrossRef PubMed.
- G. C. P. van Zundert, B. M. Hudson, S. H. P. de Oliveira, D. A. Keedy, R. Fonseca, A. Heliou, P. Suresh, K. Borrelli, T. Day, J. S. Fraser and H. van den Bedem, J. Med. Chem., 2018, 61, 11183–11198 CrossRef CAS PubMed.
- H. van den Bedem, G. Bhabha, K. Yang, P. E. Wright and J. S. Fraser, Nat. Methods, 2013, 10, 896–902 CrossRef CAS PubMed.
- W. A. Baase, L. Liu, D. E. Tronrud and B. W. Matthews, Protein Sci., 2010, 19, 631–641 CrossRef CAS PubMed.
- B. K. Shoichet, W. A. Baase, R. Kuroki and B. W. Matthews, Proc. Natl. Acad. Sci. U. S. A., 1995, 92, 452–456 CrossRef CAS PubMed.
- M. D. Collins, G. Hummer, M. L. Quillin, B. W. Matthews and S. M. Gruner, Proc. Natl. Acad. Sci. U. S. A., 2005, 102, 16668–16671 CrossRef CAS PubMed.
- L. Liu, M. L. Quillin and B. W. Matthews, Proc. Natl. Acad. Sci. U. S. A., 2008, 105, 14406–14411 CrossRef CAS PubMed.
- A. Morton and B. W. Matthews, Biochemistry, 1995, 34, 8576–8588 CrossRef CAS PubMed.
- Y. Wang, J. M. Martins and K. Lindorff-Larsen, Chem. Sci., 2017, 8, 6466–6473 RSC.
- D. R. Banatao, D. Cascio, C. S. Crowley, M. R. Fleissner, H. L. Tienson and T. O. Yeates, Proc. Natl. Acad. Sci. U. S. A., 2006, 103, 16230–16235 CrossRef CAS PubMed.
- D. M. Rosenbaum, V. Cherezov, M. A. Hanson, S. G. Rasmussen, F. S. Thian, T. S. Kobilka, H. J. Choi, X. J. Yao, W. I. Weis, R. C. Stevens and B. K. Kobilka, Science, 2007, 318, 1266–1273 CrossRef CAS PubMed.
- D. L. Mobley, A. P. Graves, J. D. Chodera, A. C. McReynolds, B. K. Shoichet and K. A. Dill, J. Mol. Biol., 2007, 371, 1118–1134 CrossRef CAS PubMed.
- E. F. Garman and T. R. Schneider, J. Appl. Crystallogr., 1997, 30, 211–237 CrossRef.
- M. Merski, M. Fischer, T. E. Balius, O. Eidam and B. K. Shoichet, Proc. Natl. Acad. Sci. U. S. A., 2015, 112, 5039–5044 CrossRef CAS PubMed.
- C. J. López, Z. Yang, C. Altenbach and W. L. Hubbell, Proc. Natl. Acad. Sci. U. S. A., 2013, 110, E4306–E4315 CrossRef PubMed.
- H. X. Zhou, Biophys. J., 2010, 98, L15–L17 CrossRef CAS PubMed.
- G. G. Hammes, Y. C. Chang and T. G. Oas, Proc. Natl. Acad. Sci. U. S. A., 2009, 106, 13737–13741 CrossRef CAS PubMed.
- H. Lee, M. Fischer, B. K. Shoichet and S. Y. Liu, J. Am. Chem. Soc., 2016, 138, 12021–12024 CrossRef CAS PubMed.
- A. P. Graves, D. M. Shivakumar, S. E. Boyce, M. P. Jacobson, D. A. Case and B. K. Shoichet, J. Mol. Biol., 2008, 377, 914–934 CrossRef CAS PubMed.
- P. T. Lang, H. L. Ng, J. S. Fraser, J. E. Corn, N. Echols, M. Sales, J. M. Holton and T. Alber, Protein Sci., 2010, 19, 1420–1431 CrossRef CAS PubMed.
- D. L. Mobley, J. D. Chodera and K. A. Dill, J. Chem. Theory Comput., 2007, 3, 1231–1235 CrossRef CAS PubMed.
- Y. Deng and B. Roux, J. Chem. Theory Comput., 2006, 2, 1255–1273 CrossRef CAS PubMed.
- D. A. Keedy, Acta Crystallogr., Sect. D: Struct. Biol., 2019, 75, 123–137 CrossRef CAS PubMed.
- L. Liu, W. A. Baase and B. W. Matthews, J. Mol. Biol., 2009, 385, 595–605 CrossRef CAS PubMed.
- K. H. Burley, S. C. Gill, N. M. Lim and D. L. Mobley, J. Chem. Theory Comput., 2019, 15, 1848–1862 CrossRef CAS PubMed.
- S. C. Gill, N. M. Lim, P. B. Grinaway, A. S. Rustenburg, J. Fass, G. A. Ross, J. D. Chodera and D. L. Mobley, J. Phys. Chem. B, 2018, 122, 5579–5598 CrossRef CAS PubMed.
- J. Wang, R. M. Wolf, J. W. Caldwell, P. A. Kollman and D. A. Case, J. Comput. Chem., 2004, 25, 1157–1174 CrossRef CAS PubMed.
- K. T. Debiec, D. S. Cerutti, L. R. Baker, A. M. Gronenborn, D. A. Case and L. T. Chong, J. Chem. Theory Comput., 2016, 12, 3926–3947 CrossRef CAS PubMed.
- L. P. Wang, K. A. McKiernan, J. Gomes, K. A. Beauchamp, T. Head-Gordon, J. E. Rice, W. C. Swope, T. J. Martínez and V. S. Pande, J. Phys. Chem. B, 2017, 121, 4023–4039 CrossRef CAS PubMed.
- M. McGann, J. Chem. Inf. Model., 2011, 51, 578–596 CrossRef CAS PubMed.
- B. Xie, T. H. Nguyen and D. D. L. Minh, J. Chem. Theory Comput., 2017, 13, 2930–2944 CrossRef CAS PubMed.
- T. Sterling and J. J. Irwin, J. Chem. Inf. Model., 2015, 55, 2324–2337 CrossRef CAS PubMed.
- M. M. Mysinger, M. Carchia, J. J. Irwin and B. K. Shoichet, J. Med. Chem., 2012, 55, 6582–6594 CrossRef CAS PubMed.
- G. L. Warren, C. W. Andrews, A. M. Capelli, B. Clarke, J. LaLonde, M. H. Lambert, M. Lindvall, N. Nevins, S. F. Semus, S. Senger, G. Tedesco, I. D. Wall, J. M. Woolven, C. E. Peishoff and M. S. Head, J. Med. Chem., 2006, 49, 5912–5931 CrossRef CAS PubMed.
- D. F. Hahn, G. J. Tresadern and D. L. Mobley, Zenodo, 2021, DOI:10.5281/zenodo.4674371.
- J. D. Chodera and D. L. Mobley, Annu. Rev. Biophys., 2013, 42, 121–142 CrossRef CAS PubMed.
- E. Pozharski, C. X. Weichenberger and B. Rupp, Acta Crystallogr., Sect. D: Biol. Crystallogr., 2013, 69, 150–167 CrossRef CAS PubMed.
- H. van den Bedem and J. S. Fraser, Nat. Methods, 2015, 12, 307–318 CrossRef CAS PubMed.
- K. M. Hart, C. M. Ho, S. Dutta, M. L. Gross and G. R. Bowman, Nat. Commun., 2016, 7, 12965 CrossRef CAS PubMed.
- J. M. Holton, J. Synchrotron Radiat., 2009, 16, 133–142 CrossRef CAS PubMed.
- E. F. Garman and M. Weik, Methods Mol. Biol., 2017, 1607, 467–489 CrossRef CAS PubMed.
- S. Russi, A. González, L. R. Kenner, D. A. Keedy, J. S. Fraser and H. van den Bedem, J. Synchrotron Radiat., 2017, 24, 73–82 CrossRef CAS PubMed.
- M. Fischer and R. E. Hubbard, Mol. Interventions, 2009, 9, 22–30 CrossRef CAS PubMed.
- M. Weik and J. P. Colletier, Acta Crystallogr., Sect. D: Biol. Crystallogr., 2010, 66, 437–446 CrossRef CAS.
- R. B. Ravelli and S. M. McSweeney, Structure, 2000, 8, 315–328 CrossRef CAS.
- N. M. Pearce, T. Krojer and F. von Delft, Acta Crystallogr., Sect. D: Struct. Biol., 2017, 73, 256–266 CrossRef CAS.
- S. K. Burley, H. M. Berman, C. Christie, J. Duarte, Z. Feng, J. Westbrook, J. Young and C. Zardecki, Protein Sci., 2018, 27, 316–330 CrossRef CAS PubMed.
- P. Eastman, M. S. Friedrichs, J. D. Chodera, R. J. Radmer, C. M. Bruns, J. P. Ku, K. A. Beauchamp, T. J. Lane, L. P. Wang, D. Shukla, T. Tye, M. Houston, T. Stich, C. Klein, M. R. Shirts and V. S. Pande, J. Chem. Theory Comput., 2013, 9, 461–469 CrossRef CAS PubMed.
- T. J. Dolinsky, J. E. Nielsen, J. A. McCammon and N. A. Baker, Nucleic Acids Res., 2004, 32, W665–W667 CrossRef CAS PubMed.
- E. F. Pettersen, T. D. Goddard, C. C. Huang, G. S. Couch, D. M. Greenblatt, E. C. Meng and T. E. Ferrin, J. Comput. Chem., 2004, 25, 1605–1612 CrossRef CAS PubMed.
- J. A. Maier, C. Martinez, K. Kasavajhala, L. Wickstrom, K. E. Hauser and C. Simmerling, J. Chem. Theory Comput., 2015, 11, 3696–3713 CrossRef CAS PubMed.
- W. L. Jorgensen, J. Chandrasekhar, J. D. Madura, R. W. Impey and M. L. Klein, J. Chem. Phys., 1983, 79, 926–935 CrossRef CAS.
- T. Darden, D. York and L. Pedersen, J. Chem. Phys., 1993, 98, 10089–10092 CrossRef CAS.
- S. Boresch, F. Tettinger, M. Leitgeb and M. Karplus, J. Phys. Chem. B, 2003, 107, 9535–9551 CrossRef CAS.
- L. Wang, Y. Wu, Y. Deng, B. Kim, L. Pierce, G. Krilov, D. Lupyan, S. Robinson, M. K. Dahlgren, J. Greenwood, D. L. Romero, C. Masse, J. L. Knight, T. Steinbrecher, T. Beuming, W. Damm, E. Harder, W. Sherman, M. Brewer, R. Wester, M. Murcko, L. Frye, R. Farid, T. Lin, D. L. Mobley, W. L. Jorgensen, B. J. Berne, R. A. Friesner and R. Abel, J. Am. Chem. Soc., 2015, 137, 2695–2703 CrossRef CAS PubMed.
- M. Kuhn, S. Firth-Clark, P. Tosco, A. S. J. S. Mey, M. Mackey and J. Michel, J. Chem. Inf. Model., 2020, 60, 3120–3130 CrossRef CAS PubMed.
- L. F. Song, T.-S. Lee, C. Zhu, D. M. York and K. M. Merz, J. Chem. Inf. Model., 2019, 59, 3128–3135 CrossRef CAS PubMed.
- V. Gapsys, L. Pérez-Benito, M. Aldeghi, D. Seeliger, H. van Vlijmen, G. Tresadern and B. L. de Groot, Chem. Sci., 2020, 11, 1140–1152 RSC.
- Y. Ge, D. F. Hahn and D. L. Mobley, J. Chem. Inf. Model., 2021, 61, 1048–1052 CrossRef CAS PubMed.
- P. Eastman, J. Swails, J. D. Chodera, R. T. McGibbon, Y. Zhao, K. A. Beauchamp, L. P. Wang, A. C. Simmonett, M. P. Harrigan, C. D. Stern, R. P. Wiewiora, B. R. Brooks and V. S. Pande, PLoS Comput. Biol., 2017, 13, e1005659 CrossRef PubMed.
- N. M. Lim, M. Osato, G. L. Warren and D. L. Mobley, J Chem Theory Comput., 2020, 16, 2778–2794 CrossRef CAS PubMed.
- M. D. Eldridge, C. W. Murray, T. R. Auton, G. V. Paolini and R. P. Mee, J. Comput.-Aided Mol. Des., 1997, 11, 425–445 CrossRef CAS PubMed.
- P. V. Klimovich, M. R. Shirts and D. L. Mobley, J. Comput.-Aided Mol. Des., 2015, 29, 397–411 CrossRef CAS PubMed.
Footnotes |
| † Electronic supplementary information (ESI) available: Crystallographic data collection and refinement statistics, results and methods pertaining to the following topics are reported in the ESI: (1) T4 lysozyme L99A conformational change upon ligand binding, (2) absolute binding free energy calculations, (3) enhancing binding mode sampling of T4 ligands, and (4) the impact of sampling on MD trajectories. See DOI: 10.1039/d1sc02751d |
| ‡ These authors contributed equally. |
| This journal is © The Royal Society of Chemistry 2021 |