 Open Access Article
Dye-sensitized solar cells based on Fe N-heterocyclic carbene photosensitizers with improved rod-like push-pull functionality†
Linnea
Lindh‡
 ab,
Olga
Gordivska‡
 c,
Samuel
Persson‡
 c,
Hannes
Michaels‡
 de,
Hao
Fan
 c,
Pavel
Chábera
 a,
Nils W.
Rosemann
 ac,
Arvind Kumar
Gupta
 c,
Iacopo
Benesperi
 ce,
Jens
Uhlig
 a,
Om
Prakash
 c,
Esmaeil
Sheibani
 c,
Kasper S.
Kjaer
 a,
Gerrit
Boschloo
 d,
Arkady
Yartsev
 a,
Marina
Freitag
 *de,
Reiner
Lomoth
 *d,
Petter
Persson
 *b and
Kenneth
Wärnmark
 *c
*c
aChemical Physics Division, Department of Chemistry, Lund University, Box 124, SE-22100 Lund, Sweden
bTheoretical Chemistry Division, Department of Chemistry, Lund University, Box 124, SE-22100 Lund, Sweden. E-mail: petter.persson@teokem.lu.se
cCentre for Analysis and Synthesis, Department of Chemistry, Lund University, Box 124, SE-22100 Lund, Sweden. E-mail: kenneth.warnmark@chem.lu.se
dDepartment of Chemistry – Angstrom Laboratory, Uppsala University, Box 523, SE-75120 Uppsala, Sweden. E-mail: reiner.lomoth@kemi.uu.se
eSchool of Natural and Environmental Science, Newcastle University, Bedson Building, NE1 7RU Newcastle upon Tyne, UK. E-mail: marina.Freitag@newcastle.ac.uk
First published on 11th November 2021
Abstract
A new generation of octahedral iron(II)–N-heterocyclic carbene (NHC) complexes, employing different tridentate C^N^C ligands, has been designed and synthesized as earth-abundant photosensitizers for dye sensitized solar cells (DSSCs) and related solar energy conversion applications. This work introduces a linearly aligned push–pull design principle that reaches from the ligand having nitrogen-based electron donors, over the Fe(II) centre, to the ligand having an electron withdrawing carboxylic acid anchor group. A combination of spectroscopy, electrochemistry, and quantum chemical calculations demonstrate the improved molecular excited state properties in terms of a broader absorption spectrum compared to the reference complex, as well as directional charge-transfer displacement of the lowest excited state towards the semiconductor substrate in accordance with the push–pull design. Prototype DSSCs based on one of the new Fe NHC photosensitizers demonstrate a power conversion efficiency exceeding 1% already for a basic DSSC set-up using only the I−/I3− redox mediator and standard operating conditions, outcompeting the corresponding DSSC based on the homoleptic reference complex. Transient photovoltage measurements confirmed that adding the co-sensitizer chenodeoxycholic acid helped in improving the efficiency by increasing the electron lifetime in TiO2. Time-resolved spectroscopy revealed spectral signatures for successful ultrafast (<100 fs) interfacial electron injection from the heteroleptic dyes to TiO2. However, an ultrafast recombination process results in undesirable fast charge recombination from TiO2 back to the oxidized dye, leaving only 5–10% of the initially excited dyes available to contribute to a current in the DSSC. On slower timescales, time-resolved spectroscopy also found that the recombination dynamics (longer than 40 μs) were significantly slower than the regeneration of the oxidized dye by the redox mediator (6–8 μs). Therefore it is the ultrafast recombination down to fs-timescales, between the oxidized dye and the injected electron, that remains as one of the main bottlenecks to be targeted for achieving further improved solar energy conversion efficiencies in future work.
1. Introduction
Solar cells offer one of the most promising approaches to decrease the consumption of fossil fuels and thereby decreasing the anthropogenic emissions of CO2 into the atmosphere.1,2 Dye-sensitized solar cells (DSSCs) constitute a low-cost alternative to Si-based solar cells due to their inexpensive components and simple fabrication.3–8 One of the key components in DSSCs is the photosensitizer (PS) as it absorbs the sunlight and transfers an excited electron into the TiO2 conduction band. PSs are often metal complexes based on the ruthenium polypyridyl scaffold,9,10 and as such these complexes are also interesting for solar fuel applications,11,12 and photoredox catalysis.13,14 However, photosensitizers based on first row transition metals offer promising alternatives for large-scale solar-energy conversion applications due to the higher abundance and lower cost compared to ruthenium.15–17The first DSSC of appreciable efficiency was pioneered in 1991 by O'Regan and Grätzel,3 when incorporating the trimeric ruthenium complex RuL2(μ-(CN)Ru(CN)L′2)2 (L = 2,2′-bipyridine-4,4′-dicarboxylic acid and L′ = 2,2-bipyridine) as the PS. This resulted in a power conversion efficiency (PCE) of 7%. The structure of many of these PSs stem from Ru(2,2′-bipyridine-4,4′-dicarboxylic acid)2(NCS)2 (RuN3) that was shown to achieve an injection yield of 99.9% and a PCE-value of 10%, as reported by Nazeeruddin et al. already in 1993.18 Ever since, ruthenium polypyridyl complexes have been the most common PSs in DSSCs,19 yielding PCEs up to around 11% using TiO2 as photoanode and I−/I3− as the electrolyte.18,20–22 The high PCE-values of the widely used Ru-based PSs derive from their long-excited state lifetime, often on the order of several hundreds of ns or even μs.23 The PSs also feature spatial separation of the lowest unoccupied molecular orbital (LUMO), which is close to the TiO2 surface; and the highest occupied molecular orbital (HOMO),24,25 being close to the photoredox mediator in the electrolyte.
The performance of DSSC systems typically relies critically on controlling the interfacial electron transfer dynamics. This includes both interfacial electron injection from the PS to the TiO2 conduction band, as well as charge recombination processes between the oxidized PS and the injected electron. The initial interfacial electron injection in typical DSSC systems is often characterized by ultrafast dynamics taking place on sub-ps and ps timescales, while recombination often shows multiexponential dynamics over a range of slower picosecond – millisecond timescales.26,27
The disadvantages of Ru-based PSs are the cost of Ru and its scarcity, the low extinction coefficient, the restricted near-infrared absorption,22 instability in water25,28 and photo-instability.29,30 Since the efficiencies of DSSCs have not yet approached the theoretical limit and are not competitive with the more expensive silicon-based solar cells, their main advantage of cost-effectiveness depends on the utilization of cheap and readily available PSs.25 Hence, alternatives to ruthenium based dyes for DSSCs have been sought resulting in organometallic Perovskite quantum dots,31 Zn-porphyrins,32 organic materials33 and Cu(I) polypyridine complexes34,35 as PSs; yielding a record PCE to this date of 14.3% from an organic PS.36
Simply replacing ruthenium with its first row congener, iron, has turned out to be challenging,17,37–40 even though iron is very appealing due to its high abundance,17 low cost,41 and environmental sustainability. However, the lifetime of the photochemically relevant triplet metal-to-ligand charge-transfer (3MLCT) state for typical iron polypyridyl complexes is limited to the sub-ps timescale.42–44 Nevertheless, Ferrere and Gregg used cis-FeII(2,2′bipyridine-4,4′dicarboxylic acid)(CN)2 to demonstrate a proof-of-principle of electron injection from an iron-based PS into TiO2.45 The solar cell performance of these cells were though very low.45,46 In fact, iron polypyridyl complexes show significantly different photophysics compared to their ruthenium analogues due to the small d-orbital ligand field (LF) splitting, characteristic for first-row transition metals.37 In particular, the smaller LF splitting puts their metal-centred (MC) states energetically far below the photofunctional MLCT states, hence providing a very strong driving force for the deactivation of the MLCT states.47–50
For photofunctionality, increasing the lifetime of the 3MLCT state is of great importance. Several general strategies to achieve a longer MLCT excited state lifetime in transition metal complexes have been proposed.39,47,48,51,52 One strategy is to push the MC states up in energy thus diminishing the rate of deactivation of the MLCT states. This strategy has successfully been pursued using the strongly σ-donating N-heterocyclic carbene (NHC) ligands.40,49,50 Ever since the 60-fold improved 3MLCT lifetime compared to traditional polypyridyl complexes was obtained for the [Fe(pbmi)2](PF6)2 (pbmi = 1,1′-(pyridine-2,6-diyl)bis(methylimidazol-2-ylidene)) complex,53 the research field has seen many advancements gradually increasing the MLCT excited state lifetime of FeII complexes,54–56 reaching 528 ps with NHC-ligands,57 and reaching the nano-second region using amido-phenanthridine ligands.58
Recently, Tichnell et al. achieved a PCE value of 0.35% using Li+ and 4-nonyl pyridine as additives in the electrolyte and Fe(2,2′-bipyridine-4,4′-dicarboxylic acid)(CN)2 as the PS, the highest value obtained for an Fe-based DSSC besides iron-carbenes.59 However, the most explored iron-based PS is currently [Fe(cpbmi)2](PF6)2 (cpbmi = 1,1′-(4-carboxypyridine-2,6-diyl)bis(3-methylimidazole-2-ylidene)) (Fig. 1 centre), reported independently by Duchanois et al. and Harlang et al.54,55 Since the original report of a PCE of 0.13%,54 several rounds of optimization60–62 have led to a current best result of 1.1% for this photosensitizer.63 The high efficiency was realized by using I−/I3− as redox mediator with magnesium iodide (MgI2), guanidinium thiocyanate (GuNCS) and tetrabutylammonium iodide (TBAI) as additives. Half-cells consisting of [Fe(cpbmi)2](PF6)2 adsorbed on crystalline TiO2 nanoparticles, were further investigated by Harlang et al., showing an injection yield of 92% from the 3MLCT state with an injection time constant of 3 ps.55 This result is comparable to ruthenium PSs (vide supra), and similarly the injected electrons recombine with the oxidized dye in a multi-exponential process characterized by time constants ranging from tens of picoseconds to more than 10 ns. Recombination55 and insufficient coupling between the LUMO of the dye and conduction band states of the TiO2![[thin space (1/6-em)]](https://www.rsc.org/images/entities/char_2009.gif) 64 were identified as bottlenecks for the solar cell performance.
64 were identified as bottlenecks for the solar cell performance.
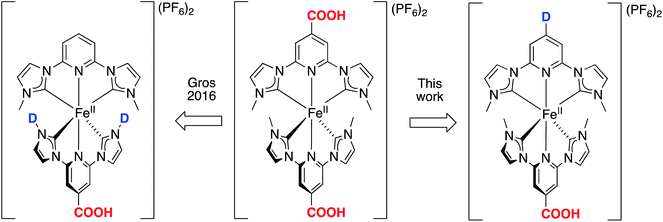 | ||
| Fig. 1 Designing heteroleptic push–pull Fe NHC complexes with linearly aligned distant donor (D) – acceptor (COOH) groups as PSs in dye-sensitized solar cells, based on the reference homoleptic complex [Fe(cpbmi)2](PF6).54,55 The design strategy is compared to previously published heteroleptic Fe NHC complexes.64 The acceptor group is kept as COOH to have an attachment point to the semiconductor (for example TiO2) in a DSSC arrangement. | ||
Further attempts to improve the solar cell performance by molecular design of the iron NHC photosensitizer have been made, including two major design strategies.38,63 One design strategy was to extend the distance between the Fe-centre and the anchor group by the use of aromatic bridges. The idea was to further separate the charges to prevent recombination, however instead less electron density reached the anchor group in the excited state.63 Another design strategy employed PSs with a push–pull structure, where donor (D) and acceptor (COOH) groups were situated on the same ligand (Fig. 1, left) as well as ligands with extended π-conjugation.38,64 Donor groups have high electron density and thus “push” away excited electrons, whereas the electron deficient acceptor groups “pull” the electrons.27 Such an approach has proven successful in both improving the optical properties of dyes,65 and hampering the charge recombination in cells. The push–pull strategy has been particularly developed for the use of Zn-porphyrins as PSs in DSSCs,66 leading to an impressive PCE-value of 13%.67 Also Ru-based,28,68,69 Fe-based70 and organic71 PSs with a push–pull design strategy have been realised, however with less improvement than observed for DSSCs with zinc-porphyrin photosensitizers. For iron-based solar cells this strategy has however not yet yielded substantially better solar cell performance.38,64 The PCE for a DSSC based on a heteroleptic iron NHC complex [Fe(cpbmi)(pbmi)](PF6)2 has been optimized from 0.1%![[thin space (1/6-em)]](https://www.rsc.org/images/entities/char_2009.gif) 64 to 1.4% using the same electrolyte solution as for the record [Fe(cpbmi)2](PF6)2 solar cell.63
64 to 1.4% using the same electrolyte solution as for the record [Fe(cpbmi)2](PF6)2 solar cell.63
In this report, the homoleptic photosensitizer [Fe(cpbmi)2](PF6)2 (Fig. 1, centre) is redesigned into heteroleptic complexes using an alternative design strategy: the cpbmi-ligand is kept as the attachment point to TiO2 as well as being an electron acceptor, and the other NHC-based ligand contains a group that acts as an electron donor (D) (Fig. 1, right). This creates a linearly aligned push–pull structure, where the LUMO is preferentially located on the electron-accepting anchor group. Diarylanilines were selected as electron-donating groups due to their beneficial properties including the ability to harbour positive charge, broaden the absorption spectra of the dye,66 hamper dye aggregation,28 and the absence of basicity.72 The latter is important to avoid formation of zwitter ionic forms of the dyes in neutral solvents.73
Following the design principles above, we have synthesized the heteroleptic push–pull complexes [Fe(cpbmi)(dtapbmi)](PF6)2 and [Fe(cpbmi)(daapbmi)](PF6)2 (Fig. 2) (dtapbmi = 1,1′-(4-(di(p-tolyl)amino)pyridine-2,6-diyl)bis(methylimidazole-2-ylidene), daapbmi = 1,1′-(4-(di(p-anisyl)amino)pyridine-2,6-diyl)bis(methylimidazole-2-ylidene)). The added donor group (di(p-tolyl)amino or di(p-anisyl)amino) and the acceptor group (COOH) are at maximum spatial distance from each other in the [Fe(pbmi)2](PF6)2 confined structure, yielding a rod-like structure. Furthermore, the corresponding homoleptic complexes [Fe(dtapbmi)2](PF6)2 and [Fe(daapbmi)2](PF6)2 were synthesized and together with [Fe(cpbmi)2](PF6)2, used as reference complexes (Fig. 2). All the synthesized complexes were fully characterized and their photophysical properties were thoroughly investigated. In addition, the performance of unoptimized DSSCs with [Fe(cpbmi)(dtapbmi)](PF6)2 and [Fe(cpbmi)(daapbmi)](PF6)2 as the PSs were investigated, using [Fe(cpbmi)2](PF6)2 as a reference.
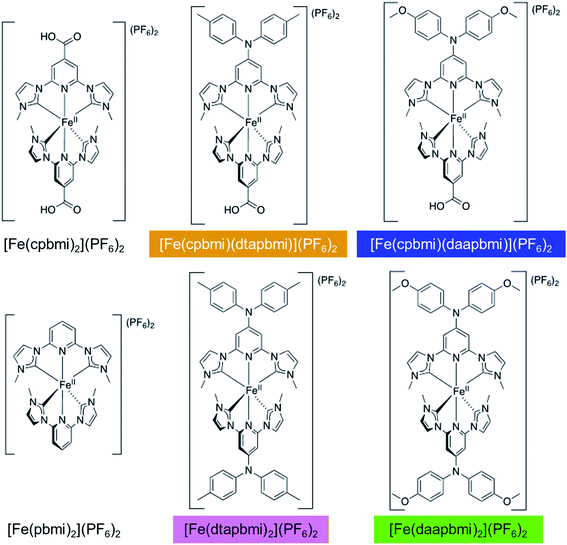 | ||
| Fig. 2 All complexes discussed in this report. The colours indicate the colour code that is used consistently throughout this paper. | ||
2. Results and discussion
2.1. Synthesis of ligands
The pre-ligand [cpbmiH2](PF6)2 was synthesized according to ref. 55. The pre-ligands [dtapbmiH2](PF6)2 and [daapbmiH2](PF6)2 were synthesized starting from 4-amino-2,5-dibromopyridine (1) (Scheme 1). Two imidazole moieties were attached to 1via a copper mediated C–N coupling under basic conditions, leading to 4-amino-2,6-diimidazole-1-ylpyridine (2) in 58% yield. The subsequent Buchwald–Hartwig coupling of 2 with of p-bromotoluene and p-bromoanisol respectively required screening to find the optimal palladium pre-catalyst and phosphine ligand. After extensive search, the highest yield in the coupling reaction was found using Pd2(dba)3 and XPhos/CyJohnPhos. Both reactions with the two different arylbromides proceed slowly (over 5 days in refluxing toluene) and resulted in 2,6-di(imidazol-1-yl)-4-(di-p-tolylamino)pyridine (3) and 4-(di-p-anisylamino)-2,6-di(imidazol-1-yl)pyridine (4) in moderate yields of 28% and 27%, respectively. Extension of the reaction time and higher catalyst loading did not result in higher yields. The monoarylated products were found to be produced in large amounts as well despite the long reaction times. The mono- and bis-arylated products were, however, successfully separated on a silica gel column. In the final step, the methylation of 3 and 4 proceeded smoothly using methyl triflate, resulting in [dtapbmiH2](PF6)2 and [daapbmiH2](PF6)2 in 52% and 35% yields, respectively, after recrystallization.2.2. Synthesis of the iron(II) N-heterocyclic complexes
The synthesis of the two homoleptic complexes [Fe(dtapbmi)2](PF6)2 and [Fe(daapbmi)2](PF6)2, see Scheme 2, was conducted based on our original protocol for the synthesis of [Fe(cpbmi)2](PF6)2 as described in ref. 55.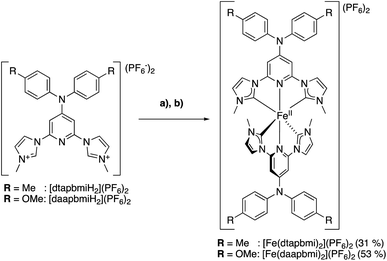 | ||
| Scheme 2 Synthesis of the homoleptic complexes [Fe(dtapbmi)2](PF6)2 and [Fe(daapbmi)2](PF6)2. (a) tBuOK (THF), 0 °C, DMF; (b) FeBr2 r.t. | ||
Hence, the free carbenes of the pre-ligands [dtapbmiH2](PF6)2 and [daapbmiH2](PF6)2, respectively, were generated using t-BuOK at −78 °C or 0 °C, depending on the specific protocol used (see ESI.1†). The so formed free carbenes were reacted with anhydrous FeBr2, yielding [Fe(dtapbmi)2](PF6)2 and [Fe(daapbmi)2](PF6)2 in 31% and 30–53% yield, respectively, after column chromatography and recrystallization, or only recrystallization. For the synthesis of the two heteroleptic complexes [Fe(cpbmi)(dtapbmi)](PF6)2 and [Fe(cpbmi)(daapbmi)](PF6)2, a protocol used by Gros to synthesize heteroleptic Fe NHC complexes,64 was employed (Scheme 3) based on forming the statistical mixture of complexes and then separation of the complexes by column chromatography. Hence, equal amounts of the pre-ligands [cpbmiH2](PF6)2 and [dtapbmiH2](PF6)2, or [cpbmiH2](PF6)2 and [daapbmiH2](PF6)2, were reacted with anhydrous FeBr2, resulting in approximately statistical mixtures (1![[thin space (1/6-em)]](https://www.rsc.org/images/entities/char_2009.gif) :
:![[thin space (1/6-em)]](https://www.rsc.org/images/entities/char_2009.gif) 2
2![[thin space (1/6-em)]](https://www.rsc.org/images/entities/char_2009.gif) :
:![[thin space (1/6-em)]](https://www.rsc.org/images/entities/char_2009.gif) 1) of [Fe(cpbmi)2](PF6)2, [Fe(cpbmi)(dtapbmi)](PF6)2 and Fe(dtapbmi)2](PF6)2, in the first case, and [Fe(cpbmi)2](PF6)2, [Fe(cpbmi)(daapbmi)](PF6)2 and [Fe(daapbmi)2](PF6)2 in the second case. The majority of undesired homoleptic complexes formed were removed by manipulation of protonation state during the extraction prior to chromatograph, see ESI.1.† In each case the remaining complexes were separated on alumina gel, yielding [Fe(cpbmi)(dtapbmi)](PF6)2 and [Fe(cpbmi)(daapbmi)](PF6)2 in 16% and 11% yield, respectively, after precipitation from the eluent.
1) of [Fe(cpbmi)2](PF6)2, [Fe(cpbmi)(dtapbmi)](PF6)2 and Fe(dtapbmi)2](PF6)2, in the first case, and [Fe(cpbmi)2](PF6)2, [Fe(cpbmi)(daapbmi)](PF6)2 and [Fe(daapbmi)2](PF6)2 in the second case. The majority of undesired homoleptic complexes formed were removed by manipulation of protonation state during the extraction prior to chromatograph, see ESI.1.† In each case the remaining complexes were separated on alumina gel, yielding [Fe(cpbmi)(dtapbmi)](PF6)2 and [Fe(cpbmi)(daapbmi)](PF6)2 in 16% and 11% yield, respectively, after precipitation from the eluent.
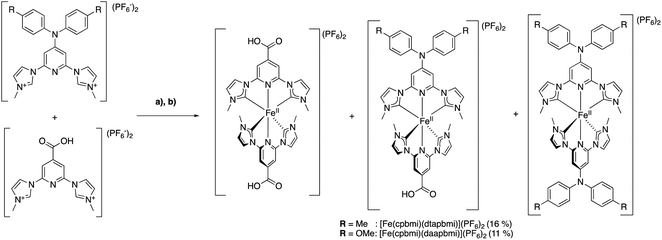 | ||
| Scheme 3 Synthesis of the heteroleptic complexes [Fe(cpbmi)(dtapbmi)](PF6)2 and [Fe(cpbmi)(daapbmi)](PF6)2 using a statistical approach (a) tBuOK (THF), 0 °C, DMF; (b) FeBr2 r.t. | ||
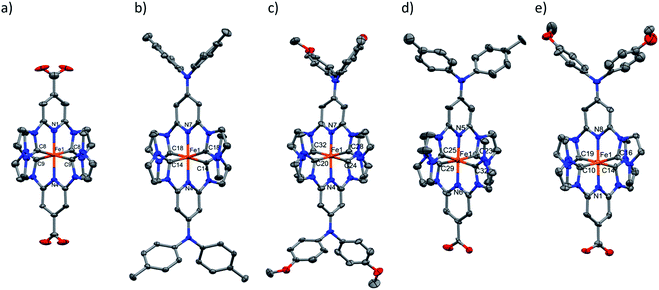
The oxidation state of all the complexes as iron(II) species were confirmed by high resolution mass spectrometry, elemental analysis and single crystal X-ray diffraction (SC-XRD) analysis. The molecular structure as determined by SC-XRD analysis of the complexes is shown in Fig. 3, and these structures were further supported by 1H and 13C NMR spectroscopy.
A single crystal of [FeII(cpbmi)2](PF6)2 was obtained by the diffusion of pentane into a methanol solution of the complex. Crystals of [FeII(dtapbmi)2](PF6)2 and [FeII(daapbmi)2](PF6)2 were obtained by diffusion of pentane into a DCM solution of the respective complex. Crystals of [FeII(cpbmi)(dtapbmi)](PF6)2 and [FeII(cpbmi)(daapbmi)](PF6)2 were obtained by slow evaporation of a methanol solution of the complex. Additionally, crystals of [FeIII(daapbmi)2]K(NO3)4 were obtained serendipitously by precipitation of [FeII(daapbmi)2](PF6)2 with KPF6 (sat, aq.) during the purification of the reaction mixture by silica gel chromatography, using acetone![[thin space (1/6-em)]](https://www.rsc.org/images/entities/char_2009.gif) :
:![[thin space (1/6-em)]](https://www.rsc.org/images/entities/char_2009.gif) H2O
H2O![[thin space (1/6-em)]](https://www.rsc.org/images/entities/char_2009.gif) :
:![[thin space (1/6-em)]](https://www.rsc.org/images/entities/char_2009.gif) KNO3 (sat. aq.) (10
KNO3 (sat. aq.) (10![[thin space (1/6-em)]](https://www.rsc.org/images/entities/char_2009.gif) :
:![[thin space (1/6-em)]](https://www.rsc.org/images/entities/char_2009.gif) 3
3![[thin space (1/6-em)]](https://www.rsc.org/images/entities/char_2009.gif) :
:![[thin space (1/6-em)]](https://www.rsc.org/images/entities/char_2009.gif) 1) as eluant (see ESI.1 and 2†). During this process, the FeII complex oxidised into FeIII and formally contains [K(NO3)4]3− as the counter anion. Bond lengths and bond-angles around the iron-centre are retained to a large extent, both with change of the para-substituents and oxidation state, compared with the parent complex [Fe(pbmi)2](PF6)2.53 All complexes have a very similar distorted octahedral geometry according to the bite angles (see Table 1).
1) as eluant (see ESI.1 and 2†). During this process, the FeII complex oxidised into FeIII and formally contains [K(NO3)4]3− as the counter anion. Bond lengths and bond-angles around the iron-centre are retained to a large extent, both with change of the para-substituents and oxidation state, compared with the parent complex [Fe(pbmi)2](PF6)2.53 All complexes have a very similar distorted octahedral geometry according to the bite angles (see Table 1).
| Bond/angle | [Fe(pbmi)2]2+ | [Fe(cpbmi)2]2+ | [Fe(cpbmi)(dtapbmi)]2+ | [Fe(cpbmi) (daapbmi)]2+ | [Fe(dtapbmi)2]2+ | [Fe(daapbmi)2]2+ | [Fe(daapbmi)2]3+ |
|---|---|---|---|---|---|---|---|
| a From ref. 53. b The average angle of the C–N–C bond in the tertiary amine for complexes where relevant, to reflect the hybridisation of nitrogen. c The average dihedral angles between the pyridine ring and the carboxylic acid group for complexes where relevant. d The average dihedral angles between the pyridine ring and para-substituted nitrogen for complexes where relevant. e The average dihedral angles between the pyridine ring and the tolyl/anisyl rings for complexes where relevant. | |||||||
| Fe–N (Å) | 1.925a (1.940) | 1.905 (1.931) | 1.903 (1.937) | 1.910 (1.937) | 1.915 (1.944) | 1.924 (1.943) | 1.935 |
| Fe–C (Å) | 1.967a (1.972) | 1.943 (1.974) | 1.944 (1.974) | 1.957 (1.976) | 1.947 (1.979) | 1.931 (1.974) | 1.955 |
| C–Fe–C (°) | 158.3a (158.3) | 158.7 (158.5) | 157.5 (158.0) | 158.9 (158.0) | 157.8 (157.6) | 157.3 (157.6) | 157.9 |
| C–N–C (°)b | — | — | 119.9 (120.0) | 120.0 (120.0) | 120.0 (120.0) | 119.9 (120.0) | 119.9 |
| Dihedral ring-COOH (°)c | — | 10.3 (0.3) | 2.1 (0.2) | 9.2 (0.3) | — | — | — |
| Dihedral ring-N (°)d | — | — | 18.3 (16.3) | 5.5 (11.5) | 11.3 (17.3) | 14.2 (14.2) | 3.8 |
| Dihedral ring-ring (°)e | — | — | 74.3 (76.2) | 83.4 (75.7) | 62.0 (76.2) | 69.3 (75.8) | 75.0 |
The angles around the para-substituted nitrogen in the dtapbmi- and daapbmi-ligands were probed to determine their sp2-character of these atoms. While all bond angles around the central N atom deviated slightly from the 120° found in an ideal sp2-geometry, the sum of bond angles deviates from 360° by less than 1° in all cases, showing very good planarity (see ESI.2†). Furthermore, investigating the angles between the pyridine rings and the para-substituents, gives a suggestion of electronic communication. The dihedral angles between the carboxylic acid groups and the pyridine rings were found to be on average 8.0°, suggesting fair overlap between the π-systems of each moiety. This shows the possibility of electronic communication between the anchor group and the rest of the complex. The corresponding dihedral angle on the aniline-substituents were somewhat larger, on average 11°, and similar in each complex suggesting electronic communication also here. The angle between the pyridine rings in the ligand and the N-tolyl/anisyl groups are however in all cases significantly larger, on average 72° (see Table 1 or more details in Table S7†). Thus, the tolyl and anisyl groups probably do not communicate much electronically to the metal-coordinating part of the ligand.
2.3. Steady-state absorption spectroscopy
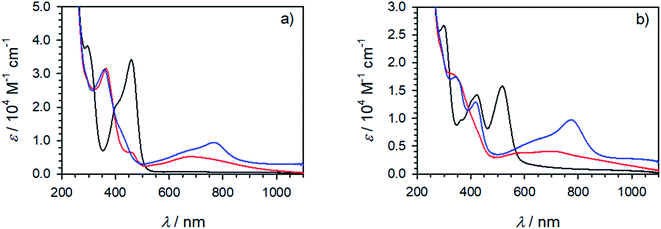
Steady-state absorption spectra of all complexes in the UV-VIS region are shown in Fig. 4. Special care was taken to determine extinction coefficients in a defined protonation state as it has been previously reported for [Fe(cpbmi)2](PF6)2![[thin space (1/6-em)]](https://www.rsc.org/images/entities/char_2009.gif) 56 and a similar iron-carbene complex,74 that deprotonation results in a blue-shift of the charge-transfer band. The iron–carbene complexes presented here bearing the cpbmi-ligand are easily deprotonated, especially when dissolved in acetonitrile at low complex concentration where the ratio water concentration to complex concentration is high. In contrast, complexes [Fe(dtapbmi)2](PF6)2 and [Fe(daapbmi)2](PF6)2 were found not to be prone to protonation/deprotonation under the measurement conditions applied here. This is consistent with the aniline substituents having only minor basicity.72 To ensure that only the protonated species of the carboxylic acid complexes [Fe(cpbmi)2](PF6)2, [Fe(cpbmi)(dtapbmi)](PF6)2 and [Fe(cpbmi)(daapbmi)](PF6)2 are investigated, all measurements were performed in a buffer solution consisting of 0.1 M tetrabutylammonium (TBA) methanesulfonate and 0.1 M methanesulfonic acid in acetonitrile, also assuring a constant ionic strength of 0.1 M. Spectral changes due to protonation/deprotonation were investigated by titration series (see ESI.3†).
56 and a similar iron-carbene complex,74 that deprotonation results in a blue-shift of the charge-transfer band. The iron–carbene complexes presented here bearing the cpbmi-ligand are easily deprotonated, especially when dissolved in acetonitrile at low complex concentration where the ratio water concentration to complex concentration is high. In contrast, complexes [Fe(dtapbmi)2](PF6)2 and [Fe(daapbmi)2](PF6)2 were found not to be prone to protonation/deprotonation under the measurement conditions applied here. This is consistent with the aniline substituents having only minor basicity.72 To ensure that only the protonated species of the carboxylic acid complexes [Fe(cpbmi)2](PF6)2, [Fe(cpbmi)(dtapbmi)](PF6)2 and [Fe(cpbmi)(daapbmi)](PF6)2 are investigated, all measurements were performed in a buffer solution consisting of 0.1 M tetrabutylammonium (TBA) methanesulfonate and 0.1 M methanesulfonic acid in acetonitrile, also assuring a constant ionic strength of 0.1 M. Spectral changes due to protonation/deprotonation were investigated by titration series (see ESI.3†).
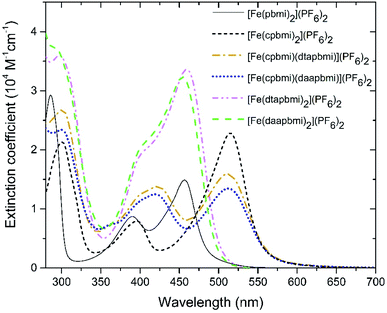 | ||
| Fig. 4 Steady-state absorption spectra of all complexes reported here, all dissolved in a buffer system of 0.1 M TBA methanesulfonate and 0.1 M methanesulfonic acid in acetonitrile. | ||
All complexes exhibit a double peaked absorption band in the wavelength range from 350 to 600 nm. The bands are attributed to MLCT transitions based on similarity to what has previously been established for the parent complex [Fe(pbmi)2](PF6)2![[thin space (1/6-em)]](https://www.rsc.org/images/entities/char_2009.gif) 53 and reference complex [Fe(cpbmi)2](PF6)2.55 Peak wavelengths for each band together with extinction coefficients are summarized in Table 2. As noted prior for [Fe(cpbmi)2](PF6)2, complexes bearing carboxylic acid groups have a strongly red-shifted absorption band on-set compared to the parent complex [Fe(pbmi)2](PF6)2.55 Interestingly the new homoleptic complexes [Fe(dtapbmi)2](PF6)2 and [Fe(daapbmi)2](PF6)2 (substituted only with N,N-diaryl anilines) absorb in a similar wavelength region to their parent complex [Fe(pbmi)2](PF6)2, although with a stronger extinction coefficient. The stronger absorption is attributed to an increased π-system involved in the MLCT transitions. For heteroleptic complexes [Fe(cpbmi)(dtapbmi)](PF6)2 and [Fe(cpbmi)(daapbmi)](PF6)2, their respective MLCT-bands around 515 nm exhibit lower peak extinction coefficients than the corresponding band of [Fe(cpbmi)2](PF6)2. However, when comparing the integrated extinction in the wavelength range of 350–750 nm all three complexes yield similar results. This means that the apparent lowering of the extinction when exchanging one carboxylic acid group for an aniline substituent is more of a broadening of the absorption that results in better coverage of the visible region.
53 and reference complex [Fe(cpbmi)2](PF6)2.55 Peak wavelengths for each band together with extinction coefficients are summarized in Table 2. As noted prior for [Fe(cpbmi)2](PF6)2, complexes bearing carboxylic acid groups have a strongly red-shifted absorption band on-set compared to the parent complex [Fe(pbmi)2](PF6)2.55 Interestingly the new homoleptic complexes [Fe(dtapbmi)2](PF6)2 and [Fe(daapbmi)2](PF6)2 (substituted only with N,N-diaryl anilines) absorb in a similar wavelength region to their parent complex [Fe(pbmi)2](PF6)2, although with a stronger extinction coefficient. The stronger absorption is attributed to an increased π-system involved in the MLCT transitions. For heteroleptic complexes [Fe(cpbmi)(dtapbmi)](PF6)2 and [Fe(cpbmi)(daapbmi)](PF6)2, their respective MLCT-bands around 515 nm exhibit lower peak extinction coefficients than the corresponding band of [Fe(cpbmi)2](PF6)2. However, when comparing the integrated extinction in the wavelength range of 350–750 nm all three complexes yield similar results. This means that the apparent lowering of the extinction when exchanging one carboxylic acid group for an aniline substituent is more of a broadening of the absorption that results in better coverage of the visible region.
| Complexa | λ (nm) | E (eV) | ε (103 M−1 cm−1) |
E
1/2 FeIII/II![[thin space (1/6-em)]](https://www.rsc.org/images/entities/char_2009.gif) c (V) c (V) |
E
p L0/−![[thin space (1/6-em)]](https://www.rsc.org/images/entities/char_2009.gif) c,d (V) c,d (V) |
|---|---|---|---|---|---|
| a As PF6− salt. b In acetonitrile buffered with 0.1 M TBA methanesulfonate and 0.1 M methanesulfonic acid. c Vs. Fc+/Fc in acetonitrile with 0.1 M TBAPF6. d DPV peak potential of irreversible wave. e From ref. 55. f This is a higher value than previously published,54,55 attributed to the fact that the protonated complex has higher extinction at 515 nm than the deprotonated complex. g Potential of first oxidation of the complex adsorbed on a TiO2 film (using the same procedure as for DSSC fabrication, see ESI.9) immersed in acetonitrile with 0.1 M TBAPF6. h Minor reduction peak. | |||||
| [Fe(pbmi)2]2+ | 456 | 2.71 | 15 | 0.31e | −2.39e |
| [Fe(cpbmi)2]2+ | 515 | 2.41 | 23f | 0.45e (0.22)g | −1.71e |
| [Fe(cpbmi)(dtapbmi)]2+ | 511 | 2.42 | 16 | 0.26 (0.17)g | −1.63h, −2.38 |
| [Fe(cpbmi)(daapbmi)]2+ | 512 | 2.42 | 14 | 0.25 (0.19)g | −1.7h, −2.3 |
| [Fe(dtapbmi)2]2+ | 459 | 2.70 | 34 | 0.06 | −2.52 |
| [Fe(daapbmi)2]2+ | 454 | 2.73 | 32 | 0.05 | −2.58 |
2.4. Electrochemistry and spectroelectrochemistry
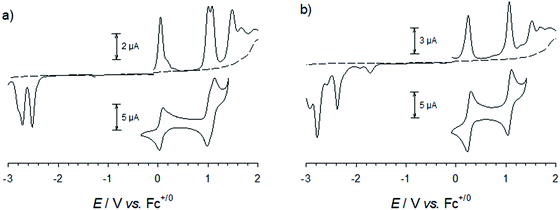
For all complexes studied here, cyclic voltammetry revealed a reversible one-electron oxidation (Fig. 5 and S41†) with half-wave potentials ranging from E1/2 = 0.05 to 0.45 V vs. Fc+/Fc (Table 2). In analogy to the parent complex [Fe(pbmi)2]2+ and its homoleptic carboxylate congener [Fe(cpbmi)2]2+, this wave can be assigned to the FeIII/II couple with the expected negative shift due to the electron donating effect of the aniline substituents of [Fe(dtapbmi)2]2+ and [Fe(daapbmi)2]2+. For the heteroleptic complexes the opposite electronic effects of aniline and carboxylate substituents are almost entirely cancelling each other resulting in potentials of their FeIII/II couple close to that of the parent complex [Fe(pbmi)2]2+. Further oxidation at potentials of about 1 V can be unambiguously attributed to the oxidation of the aniline substituents based on the absence of this process in the parent complex [Fe(pbmi)2]2+ and its homoleptic carboxylate congener [Fe(cpbmi)2]2+. In case of the homoleptic complexes, small splittings (ca. 0.08 V) of the amine oxidation indicate weak electronic interaction between the two amine units. Beyond 1.5 V all complexes undergo further irreversible oxidations similar to the parent complex [Fe(pbmi)2]2+ that presumably comprises ligand oxidation as well as further oxidation of the metal centre.Reduction of the homoleptic amine substituted complexes leads to irreversible reduction waves at about −2.5 V that can be attributed to ligand reduction. Their negative shift relative to the parent complex [Fe(pbmi)2]2+ parallels the trend of the FeIII/II couples in excellent agreement with the virtually identical energies of the MLCT absorption bands (Table 2) of these two complexes and the parent complex. In case of both heteroleptic complexes, similar reduction waves are observed at about −2.3 V. With a positive shift that approximately parallels the effect of the carboxylate substituent on the FeIII/II couples, these potentials cannot account for the red shift of the MLCT bands, however. Minor reductive waves at about −1.6 V, that agree with the first reduction of [Fe(cpbmi)2]2+ and might be attributed to proton coupled reductive chemistry of the carboxylate substituent, corroborate the notion that reliable estimates of LUMO energies from voltammetric data seem to be compromised in case of the carboxylic acid substituted complexes.
Spectroelectrochemistry (Fig. 6 and S42†) corroborates for all complexes the assignment of the first oxidation to the formation of a stable FeIII state accompanied by bleaching of the MLCT band and the concomitant emergence of lower energy absorption that can be tentatively assigned to ligand-to-metal charge-transfer (LMCT) excitation involving ligand oxidations above 1.5 V. The stable products formed upon further reversible oxidation of FeIII complexes [Fe(cpbmi)(dtapbmi)]3+ and [Fe(dtapbmi)2]3+ were also characterized by spectroelectrochemistry (Fig. 6) that supports their assignment to triarylamine cation radicals.75 This means that the preferential site for the complexes to keep an electron deficiency is on the metal in the first place, rather than on the aniline-containing ligand. The result can be explained by the strongly σ-donating ligands shifting the FeIII/II redox couple below the amine oxidation, that occurs at unusually high potential in these complexes, thereby making it hard to fully implement the intended push–pull strategy.
2.5. Quantum chemical calculations
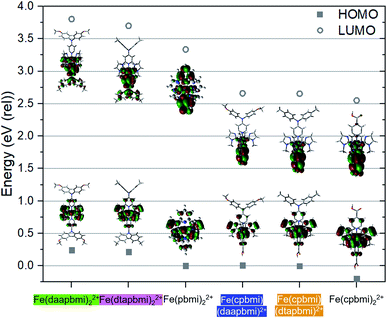
Density Functional Theory (DFT) calculations on the B3LYP* level of theory with the 6-311G(d, p) basis set and modelled in an empirical solvent model of acetonitrile were carried out to provide further electronic structure information about the Fe NHC complexes. The calculated HOMO and LUMO energies are shown in Fig. 7 together with pictures of the Kohn–Sham orbitals (see also Table S8†). Based on the calculations, the aniline substituted ligands (dtapbmi and daapbmi) destabilize both HOMO and LUMO, whereas the carboxylic acid substituted ligand (cpbmi) mostly stabilizes the LUMO of the corresponding iron complexes. The HOMO–LUMO gap is typically related to the position of the lowest energy absorption band, which here is the MLCT-band corroborated by the character of the lowest energy triplet state at the ground state geometry of each complex according to unrestricted single point DFT calculations (see ESI.5, Tables S9 and S10†). The calculations presented in Fig. 7 thus explain the result obtained from absorption measurements (Fig. 4), where the absorption maxima are similar for complexes without the cpbmi-ligand and redshifted for complexes with the cpbmi-ligand compared to the parent complex [Fe(pbmi)2](PF6)2. The red shifting effect of the carboxylic acid group has been previously observed for complex [Fe(cpbmi)2](PF6)2.55 Thus, for heteroleptic complexes bearing both types of ligands, the LUMO-stabilizing effect of the cpbmi-ligand is stronger than the destabilizing effect of the aniline-substituted ligands. The cpbmi-ligand offers a π*-orbital lying lower than other available ligand orbitals, such that the LUMO of heteroleptic complexes only extend on the cpbmi-ligand (seen in Fig. 7, more information in ESI.5†). This validates the intended design strategy that upon light excitation an electron would preferentially be localised on the cpbmi-ligand. The introduced directional excitation is an improvement to the reference complex [Fe(cpbmi)2](PF6)2 where excitation is not preferential to either side of the complex. The sigma-donating effect of the ligands have also managed to further shift the 3MC states to higher energies, at their respective optimized geometry 3MC is now only ∼0.2 eV lower in energy than the 3MLCT states (see Table S11†). This is an improvement compared to previously reported complexes [Fe(pbmi)2](PF6)2 and [Fe(cpbmi)2](PF6)2.76Similar to what has been concluded in previous computational studies,64,76 the electron donating ligands ensure a favourable excitation directionality towards the TiO2, thus alleviating one of the potential problems for the reference complex [Fe(cpbmi)2](PF6)2. However, the HOMOs of the heteroleptic complexes are mainly metal-centred (t2g-character) but also display significant mixing with ligand π*-orbitals as shown in Fig. 7. The strong metal–ligand interaction, leading to a delocalization of the HOMOs, suggests that the complexes would delocalize an electron hole over a large part of the complex rather than directing it towards the electron-donating ligand. The picture is similar to what is observed from electrochemistry, and contribute to explain why recombination is still a problem limiting the DSSC performance of these complexes.
The optimized structures of the complexes (shown in Fig. 7) can be compared to the measured SC-XRD structures in Fig. 3. In general, the B3LYP* functional tends to overestimate all bond lengths with a couple of percent, see Table 1. The calculated bite angle is around 158° for all complexes which was also confirmed by SC-XRD measurements. The dihedral angles between the carboxylic acid group and the pyridine ring in optimized relevant complexes are all maximum 0.3°, suggesting good overlap between the π-systems, also seen in the LUMO extending fully on the carboxylic acid group (Fig. 7). The corresponding angles from SC-XRD measurements are larger indicating less overlap, see Table 1. This discrepancy can be due to the fact that the molecular structures are optimized in an implicit solvent model, whereas SC-XRD measurements represent the crystal structure of the molecule. The calculated dihedral angles between the pyridine ring of the complexes and the para-substituted nitrogen as well as the tolyl/anisyl-rings are more in line with the SC-XRD measurements, see Table 1. These angles suggest some overlap between the π-systems of the pyridine ring and the para-substituted nitrogen (also seen in the LUMOs in Fig. 7). In addition, it is clear from both calculations and SC-XRD measurements that the three aromatic rings making up the tertiary amine are not in the same plane, and thus not strongly coupled. In solution the tolyl/anisyl-rings most likely have significant rotational freedom and do not remain at a fixed position as in a crystal. This also opens up for more planar conformations of the tolyl/anisyl-rings in relation to the pyridine moiety, thus potentially providing better electronic communication all the way from the methyl/methoxy-group of the aniline substituent to the pyridine nitrogen coordinated to the iron atom. The planarity seen for the para-substituted nitrogen in the dtapbmi- and daapbmi-ligands is also supported by the calculations, being close to perfect 120°.
2.6. Transient absorption spectroscopy
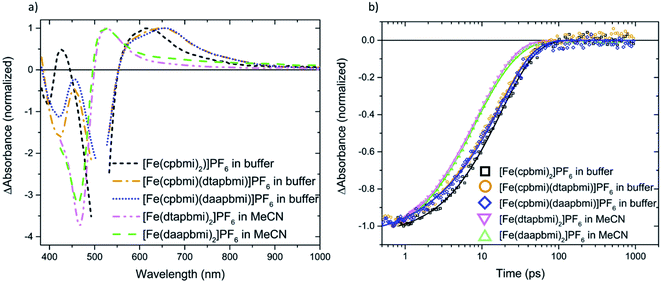
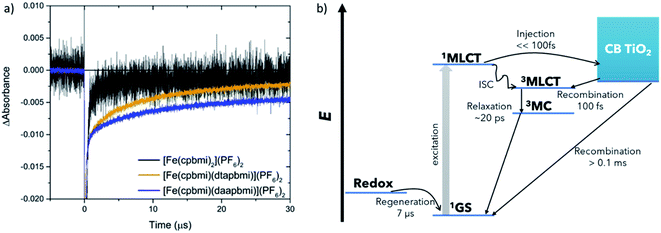
fs-Transient Absorption (TA) spectroscopy was employed to investigate the excited-state properties of the complexes in solution as well as on Al2O3 reference films in acetonitrile (for a description of the experiment setup see ESI.6,† fabrication of films in ESI.8†). Additionally, interfacial charge transfer from [Fe(cpbmi)(dtapbmi)](PF6)2 and [Fe(cpbmi)(daapbmi)](PF6)2 to TiO2 meso-porous films in acetonitrile (fabrication described in ESI.8†) was investigated. The excitation wavelength was tuned to match the absorption maximum of the respective sample. Below will follow a discussion first about the dynamics in solution and later the interfacial dynamics on TiO2 films in acetonitrile. Finally, the dye regeneration kinetics of [Fe(cpbmi)2](PF6)2, [Fe(cpbmi)(dtapbmi)](PF6)2 and [Fe(cpbmi)(daapbmi)](PF6)2 adsorbed on mesoporous TiO2 will be presented. A schematic of all characterized processes can be seen in Fig. 10b.The dynamics of the complexes in solution describe the intrinsic energy evolution in the complexes and build the base for understanding the processes occurring at the surface of TiO2. Complexes bearing carboxylic acid groups (sensitive to deprotonation as discussed previously) were measured in a buffer solution consisting of 0.1 M TBA methanesulfonate and 0.1 M methanesulfonic acid in acetonitrile, the others in acetonitrile only. Measured spectra and kinetics together with fits from global analysis are shown in Fig. 8. In solution, the complexes display ground state bleach (GSB) at ∼400–520 nm resembling the inverted steady-state absorption (Fig. 4). On the red side of the GSB ∼550–700 nm, excited state absorption (ESA) is observed. The spectral characteristics are similar to features previously ascribed to the 3MLCT state of other Fe NHC complexes.53,55 Global analysis of the data in solution reveals two components for all complexes, with the first dominant component decaying on a timescale of 11–20 ps and the second, minor component decaying on a 1–7 ps timescale depending on the particular complex. Thus, the lifetime of the 3MLCT state is limited by the longer decay component. In analogy with previous studies, we assume a decay pathway to ground state from the 3MLCT state via the 3MC state.53,55 The proposed dynamics assume intersystem crossing to be faster than 1 ps, which has before been observed for a related Fe(II) complex.77 All components for the fits are summarized in Table 3.
| System | Complex | τ 1 (ps) | τ 2 (ps) | τ 3 (ps) | τ 4 (ps) |
|---|---|---|---|---|---|
| a Consisting of 0.1 M TBA methanesulfonate and 0.1 M methanesulfonic acid in acetonitrile. b These minor additional components appears to differ significantly for the two complexes, which should not be overinterpreted for the primitive fit not assuming any model. c Fitted by a time-component with infinite lifetime. | |||||
| In Buffera | [Fe(cpbmi)2](PF6)2 | 7 | 20 | ||
| [Fe(cpbmi)(dtapbmi)](PF6)2 | 2 | 18 | |||
| [Fe(cpbmi)(daapbmi)](PF6)2 | 2 | 18 | |||
| In MeCN | [Fe(dtapbmi)2](PF6)2 | 3 | 11 | ||
| [Fe(daapbmi)2](PF6)2 | 6 | 17 | |||
| On Al2O3 | [Fe(cpbmi)(dtapbmi)](PF6)2 | 17 | |||
| [Fe(cpbmi)(daapbmi)](PF6)2 | 18 | ||||
| On TiO2 | [Fe(cpbmi)(dtapbmi)](PF6)2 | 0.1 | 18 | 150b | ndc (5%) |
| [Fe(cpbmi)(daapbmi)](PF6)2 | 0.1 | 3b | 22 | ndc (10%) | |
Further, the dynamics of complexes [Fe(cpbmi)(dtapbmi)](PF6)2 and [Fe(cpbmi)(daapbmi)](PF6)2 adsorbed on wide bandgap Al2O3 reference semiconductor substrate in acetonitrile (where electron injection from the complexes is not energetically feasible) were investigated. The dynamics on Al2O3 in acetonitrile is similar to the dynamics in solution, and one major lifetime component of 17–18 ps can be fitted to this data, see Fig. S49.† The excited state absorption at ∼550–800 nm of the complexes on Al2O3 films in acetonitrile (Fig. S49†) is also similar to the ESA in solution (Fig. 8a).
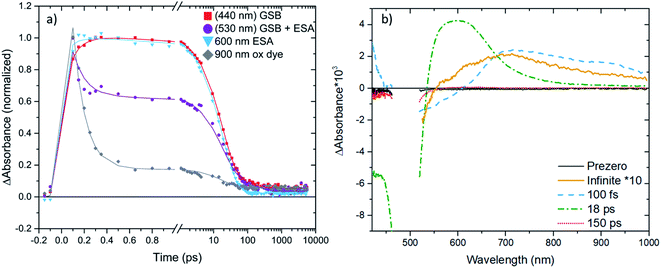
We will now focus on the interfacial dynamics of the two new complexes with anchor groups ([Fe(cpbmi)(dtapbmi)](PF6)2 and [Fe(cpbmi)(daapbmi)](PF6)2) adsorbed on TiO2. As expected, we observe more complex TA evolution which in contrast to the solution case includes also some very fast and very slow processes see Fig. 9a. Spectrally, we observe features additional to the GSB and ESA as seen in solution see Fig. 9b around ∼700–1000 nm. To get a first idea about the fundamental processes, global analysis with a four-exponential fit function was applied to the chirp-corrected datasets. By accounting for the instrument response function, time resolution down to ∼100 fs was obtained (a region of ±80 fs around time zero was omitted). For both complexes, the decay function is mainly described by one ultrafast component with a lifetime of 100 fs, one component with lifetime ∼20 ps, and one non-decaying component within the timeframe of our experiment (see Table 3). Selected kinetics and decay associated spectra (DAS) for [Fe(cpbmi)(dtapbmi)](PF6)2 are plotted in Fig. 9, and the results for [Fe(cpbmi)(daapbmi)](PF6)2 are shown in Fig. S46.† To improve the fits, one very weak additional component at an intermediary time for each dataset was included. It is also important to keep in mind that the studied systems are expected to be highly inhomogeneous as well as they do not correspond to the optimized films for DSSCs where a co-sensitizer was added to help orient the complexes correctly.
When we compare the data in solution and on both TiO2 and Al2O3 films in acetonitrile, we distinguish a component which decays with a nearly identical lifetime (∼20 ps), see Table 3. The decay associated spectrum of this component on TiO2 (Fig. 9b and S46b†) is similar to the ESA in solution (Fig. 8a), however as expected there are minor differences as there are also differences between the solution and film steady-state absorption spectra (for a comparison of TA spectra at 1 ps of the solution and TiO2 film in acetonitrile cases see also Fig. S47†). This spectral component in the film dynamics is therefore also assigned to 3MLCT in analogy to the solution case.
Further, one of the major differences between the solution and TiO2 in acetonitrile data is the presence of a non-decaying component for the data on film. The decay associated spectra of this component resembles that of the oxidized dye established by spectroelectrochemistry (see Fig. S48†) and survives long after the expected lifetime of the complexes. Similar to previous studies of [Fe(cpbmi)2](PF6)2![[thin space (1/6-em)]](https://www.rsc.org/images/entities/char_2009.gif) 55 we assign the non-decaying component to the oxidized complex, formed on the film resulting from electron injection into the conduction band of TiO2. The assignment is further corroborated by working solar cells (presented in Section 2.7) and the fact that a similar non-decaying component is not observed when complexes are adsorbed on Al2O3 (see Fig. S49†). It has previously been shown that the non-decaying component can be related to the solar cell performance since it reflects the portion of injected electrons that remains sufficiently long in the TiO2 to potentially contribute to the photocurrent.78 The amplitudes of the signal in the GSB region remaining after 10 ns are 5% for [Fe(cpbmi)(dtapbmi)](PF6)2 and 10% for [Fe(cpbmi)(daapbmi)](PF6)2 (see Table 3). The difference is an indication that [Fe(cpbmi)(daapbmi)](PF6)2 would have a larger fraction of the long-lived electrons injected into the TiO2. The amplitudes are comparable to what was previously established for the reference sensitizer [Fe(cpbmi)2](PF6)2, for which the non-decaying component amplitude was 13%.55
55 we assign the non-decaying component to the oxidized complex, formed on the film resulting from electron injection into the conduction band of TiO2. The assignment is further corroborated by working solar cells (presented in Section 2.7) and the fact that a similar non-decaying component is not observed when complexes are adsorbed on Al2O3 (see Fig. S49†). It has previously been shown that the non-decaying component can be related to the solar cell performance since it reflects the portion of injected electrons that remains sufficiently long in the TiO2 to potentially contribute to the photocurrent.78 The amplitudes of the signal in the GSB region remaining after 10 ns are 5% for [Fe(cpbmi)(dtapbmi)](PF6)2 and 10% for [Fe(cpbmi)(daapbmi)](PF6)2 (see Table 3). The difference is an indication that [Fe(cpbmi)(daapbmi)](PF6)2 would have a larger fraction of the long-lived electrons injected into the TiO2. The amplitudes are comparable to what was previously established for the reference sensitizer [Fe(cpbmi)2](PF6)2, for which the non-decaying component amplitude was 13%.55
The other striking difference between the two cases is the very fast component that dominates a large part of the TA in the sensitized TiO2 film in acetonitrile, but is not present in solution and in the sensitized Al2O3 film in acetonitrile (see Table 3). The main feature of this fast component that makes it differ from the other two cases is a pronounced TA signal that is nearly flat from 700 to 900 nm where ESAs in solution and on Al2O3 film in acetonitrile exhibit a cut-off (compare Fig. 8, S49 and S50†). Absorption of this feature extends to the red limit of the studied spectral range. This component has similarity with the very long-lived component and with the oxidized dye absorption established by spectroelectrochemistry combined with the ground state bleach spectral feature (see Fig. S48†). Thus, we associate this ultrafast decay component to the signal of the oxidized complexes.
In Fig. 9a (and S46a†) it is clear that the oxidized dye signal (monitored at 900 nm) rise is limited by the instrument response function. This suggests that injection is not resolved in our experiment and must be faster than 100 fs. Such a fast injection has been seen before in the case of Ru-based complexes.10,27 When looking at the ultrafast time evolution of the TA spectra (Fig. S50†) it is seen that the spectra at these times have contributions of both ESA and the oxidized dye. Formation of both oxidized dye and ESA at early times could be rationalized as an injection that is never complete for both dyes, most probably due to other fast competing processes such as an intersystem crossing (ISC) and intra-molecular vibrational energy relaxation.
It is important to realize that the resolved 100 fs component represents a decay of the oxidized complex signal. We interpret this fast decay as an ultrafast recombination process. Further, from the selected kinetics plotted in Fig. 9a (and S46a†) we see this ultrafast decay present for the oxidized dye region (900 nm), but not for the GSB recovery signal shown by the kinetics measured at 440 nm. The ultrafast recombination is thus not returning the complexes to the ground state. In addition to the positive signal representing a decay of the oxidized complex we can see a negative component with an on-set at ∼700 nm (see also Fig. S48†). It is important to note that the on-set of this negative part of the 100 fs DAS is red-shifted from the ground state absorption on-set (∼550 nm), which together with the absence of any significant fast decay in the GSB signal recorded at 440 nm restrains the assignment of this component as the ground state bleach recovery. As there is no other negative TA component, we have to assign the negative part of the 100 fs DAS to a rise of a positive TA signal. Furthermore, as one of the strongest DAS components with lifetime 18–22 ps has been above identified as the ESA of the complexes, based on similarity in spectral shapes and dynamics between the solution and TiO2 film in acetonitrile cases, we conclude that the oxidized complexes recombine back to the excited 3MLCT state. The appearance of this ultrafast recombination in the TA spectra depends on the correlation between the extinction coefficients of the oxidized complex and excited state absorptions; when the extinction coefficient of the excited state absorption is larger than the oxidized dye we observe a decay in the signal, in the opposite case we observe a rise. As the resolved charge recombination dynamics is comparable to the temporal resolution of the experiment and to the delay time of the first presented TA spectra (Fig. S50†), one could associate the appearance of the ESA in these spectra with the early parts of the recombination.
The ultrafast recombination process is the core reason for the loss of the ∼90% initially oxidized complexes, which is detrimental for the DSSC performance. We assign this dominant process to geminate recombination of the electron not having escaped from the positively charged oxidized complex left after injection. This means that only ∼10% of the injected electrons become fully free to move in the conduction band of TiO2 and can contribute to DSSC performance. On the truly ultrafast timescale where both injection and recombination occur, electrons are not yet free and the situation could potentially be described as a manifold of bound states delocalized between the complex and the conduction band of TiO2, similar to what was discussed in ref. 79. Such states could have the spectroscopic signature of an oxidized sensitizer. If the coupling of the delocalized states with a state localized on the complex is good, and the localized state is lower in energy, a very fast relaxation of the delocalized states could occur and cause the spectroscopic signal which could be interpreted as an efficient ultrafast recombination.
Assigning the fourth minor decay component is more ambiguous as the weak spectral changes associated with this component have much larger influence of the instrument noise level. Yet, we compared the dynamics measured at 900 nm where the signal is expected to be dominated by the oxidized complex with the dynamics at 600 nm, the peak of the ESA contribution, see Fig. S51.† At the timescale from 1 ps to 1 ns both the fast and the slow components should not have any significant contribution. Thus, following the suggested scheme of very fast and very slow recombination and the ESA decay, the entire dynamics in this time range must be dominated by the decay of ESA. Nevertheless, we observe statistically different dynamics in the oxidized complex and ESA spectral regions for [Fe(cpbmi)(daapbmi)](PF6)2 ([Fe(cpbmi)(dtapbmi)](PF6)2 has too high noise level to yield this result), see Fig. S51.† We tentatively interpret this difference as a contribution of slow injection and intermediate recombination caused by inhomogeneity of the adsorbed complex geometries.
We also considered the possibility of side reactions since some contaminates in the solvent may influence the observed TA dynamics. Either the photogenerated excited state or the oxidized dye after electron injection might be involved in such side reactions. The comparison of TiO2 film in acetonitrile TA dynamics to that measured on Al2O3 films in acetonitrile rules out that there would be side reactions only involving the excited state (see ESI.6† for a more detailed discussion). We also find that a very fast quenching of the oxidized complex does not agree with observed dynamics (see ESI.6† for a more detailed discussion). Furthermore, the possible influence of the Stark effect on the measured TA spectra was analyzed via comparison of the linear absorption and its derivative with the GSB spectral shape,80 see Fig. S52.† It appears that the Stark shift is not essential in the measured data on longer than 1 ps timescale most probably due to a very low concentration of injected electrons in the TiO2 nanoparticles and consequently low strength of the electric field generated by injection.
The dye regeneration kinetics of [Fe(cpbmi)2](PF6)2, [Fe(cpbmi)(dtapbmi)](PF6)2 and [Fe(cpbmi)(daapbmi)](PF6)2 adsorbed on mesoporous TiO2 films were investigated using ns-transient absorption spectroscopy (see ESI.7 and 8† for more information regarding setup and sample preparation). In the absence of a redox electrolyte, for films in air or in contact with an inert electrolyte, a biphasic recombination was observed, with a fast component (∼130 ns) and a slow component with a time constant of more than 40 μs. In contact with the iodide redox electrolyte, another fast component with a similar time constant as before ∼130 ns was found, as well as a much slower component, see Fig. 10a. We attribute the faster component in all transients to the recombination of electrons in TiO2 to oxidized dye molecules, induced by the relatively high laser pulse intensities used in these ns-TA measurements (ca. 2 mJ per pulse), resulting in locally high electron concentrations. The slower component (with a time constant τ2) in the experiments with iodide redox electrolyte is due to regeneration of the oxidized dye by iodide. For [Fe(cpbmi)2](PF6)2τ2 was about 0.5 μs, while it was about one order of magnitude slower for [Fe(cpbmi)(dtapbmi)](PF6)2 and [Fe(cpbmi)(daapbmi)](PF6)2, 6.4 and 7.2 μs, respectively. Under comparable conditions a regeneration time constant τ2 for the N719 dye was about 0.7 μs, similar to that of [Fe(cpbmi)2](PF6)2, suggesting that dye regeneration should not be a problem for [Fe(cpbmi)2](PF6)2. The slower dye regeneration of [Fe(cpbmi)(dtapbmi)](PF6)2 and [Fe(cpbmi)(daapbmi)](PF6)2 can be tentatively attributed to a smaller driving force for the regeneration reaction. It must be taken into consideration that in the initial regeneration step the short-lived intermediate diiodide (I2−) is formed (reaction (1), where D stands for the dye), which subsequently disproportionates (reaction (2)).19
| D+ + 2I− → D + I2− | (1) |
| 2I2− → I3− + I− | (2) |
The formal potential of I2−/I− is about 0.8 V vs. NHE, or 0.17 V vs. Fc+/Fc.81 This implies a small driving force for the regeneration of [Fe(cpbmi)(dtapbmi)](PF6)2 and [Fe(cpbmi)(daapbmi)](PF6)2, the oxidation potential for the films are 0.17 V and 0.19 V vs. Fc+/Fc to be compared with 0.22 V vs. Fc+/Fc for [Fe(cpbmi)2](PF6)2 (see Table 2) This reaction will still proceed to completion due to the irreversible nature of reaction (2).
2.7. Photovoltaic performance
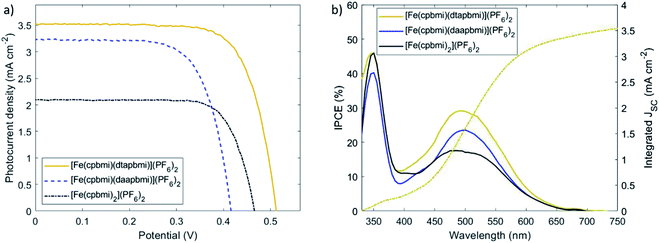
Since the complexes [Fe(cpbmi)(dtapbmi)](PF6)2 and [Fe(cpbmi)(daapbmi)](PF6)2 were able to inject electrons into TiO2, solar cells with these complexes as photosensitizers were fabricated and characterized by relevant techniques (for details see ESI.9 and 10†). To demonstrate the effect of the push–pull structure on the solar cell performance, devices sensitized with the complex [Fe(cpbmi)2](PF6)2 were used as a reference. In order to take full advantage of the push–pull directionality in the heteroleptic dyes, the commonly used co-adsorbent chenodeoxycholic acid (cheno) was added into the sensitizer solutions.82–84 The co-adsorbent was introduced to ensure complete coverage of the TiO2 surface, to avoid charge recombination between the inorganic semiconductor and the electrolyte (here I−/I3−). However, the co-adsorbent strongly competed with all dyes for TiO2 coverage. To avoid incomplete sensitization, photoanodes were immersed in dye and co-adsorbent baths sequentially, rather than having a mixture of both in the same solution. As a result, an improved trend in solar cell performance with the addition of chenodeoxycholic acid was observed for all sensitizers. The best recorded JV-curves are shown in Fig. 11a, and their key parameters are summarized in Table 4. The presented iron sensitizers were further tested with the more sophisticated redox mediator Co(bpy)3. Despite the allegedly larger cell voltage, only a fraction of photocurrent (below 0.2 mA cm−2) was recorded (see Fig. S57†). The reason likely lies in more rapid electronic recombination from the TiO2 conduction band to the more recombination-prone one-electron metal complex redox shuttle.| Dye | V OC (V) | J SC (mA cm−2) | J SC,IPCE (mA cm−2) | FF | PCE (%) | Dye loading (10−5 mmol cm−2) |
|---|---|---|---|---|---|---|
| [Fe(cpbmi)2](PF6)2 | 0.466 (0.46 ± 0.02) | 2.09 (1.9 ± 0.2) | 2.14 | 0.752 (0.74 ± 0.1) | 0.73 (0.63 ± 0.07) | 22.1 |
| [Fe(cpbmi)(dtapbmi)](PF6)2 | 0.512 (0.50 ± 0.01) | 3.52 (3.3 ± 0.2) | 3.50 | 0.724 (0.714 ± 0.08) | 1.31 (1.2 ± 0.1) | 9.87 |
| [Fe(cpbmi)(daapbmi)](PF6)2 | 0.416 (0.40 ± 0.02) | 3.23 (2.7 ± 0.4) | 2.80 | 0.694 (0.69 ± 0.1) | 0.93 (0.8 ± 0.2) | 6.55 |
Upon examination of the photovoltaic characteristics of the foremost heteroleptic donor–acceptor complex, [Fe(cpbmi)(dtapbmi)](PF6)2, it becomes apparent that the performance has increased in comparison to the homoleptic reference complex [Fe(cpbmi)2](PF6)2. Intramolecular directionality of frontier orbitals, common to many (metal-)organic dyes, provides the initial step towards successful charge separation.65,66,85 The directional excitation shifts the electron density in the LUMO towards the anchor group, which facilitated subsequent injection into the TiO2 conduction band. As a result, the solar cell based on the sensitizer [Fe(cpbmi)(dtapbmi)](PF6)2 reached a maximum incident-photon-to-current-conversion efficiency (IPCE) of 29% around 500 nm (Fig. 11b). The photocurrent collected at the contacts increased over 3 mA cm−2 for [Fe(cpbmi)(dtapbmi)](PF6)2 compared to only 2 mA cm−2 for [Fe(cpbmi)2](PF6)2. Further, the potential generated across the TiO2/dye/electrolyte interface increased by 40 mV to 0.50 V. In consequence, the overall PCE rises above 1% for this DSSC using the I−/I3− redox mediator selected to have minimum recombination losses. The advantage of the push–pull design strategy for Fe dyes over the homoleptic reference was confirmed by the superior performance of also the [Fe(cpbmi)(daapbmi)](PF6)2 dye over [Fe(cpbmi)2](PF6)2, although the presence of a methoxy group in the donor ligand greatly reduced its performance compared to its methyl counterpart. This reduced performance can be attributed to a large decrease in VOC (0.40 V compared to 0.50 V) that can not result from a difference in the intrinsic energetics of the complexes (see Table 2), but is likely due to increased recombination processes with [Fe(cpbmi)(daapbmi)](PF6)2 compared to [Fe(cpbmi)(dtapbmi)](PF6)2. It is important to notice that this recombination is on a completely different timescale than the ultrafast recombination discussed in Section 2.6, this is a slower recombination in competition with the regeneration process. A possible explanation for this electric potential loss could be derived by the fact that the methoxy group introduces electrostatic effects around the TiO2/dye/electrolyte interface.86 A reduction in JSC (2.7 mA cm−2 compared to 3.3 mA cm−2) is also observed, arising from a lower dye loading of [Fe(cpbmi)(daapbmi)](PF6)2 compared to [Fe(cpbmi)(dtapbmi)](PF6)2 (see Table 4).
To further investigate the effects of recombination, the lifetimes of electrons injected into the TiO2 conduction band were measured using transient photovoltage measurements (TPV) (see ESI.10† for experimental details).87,88 In our experiment, electrons in [Fe(cpbmi)(dtapbmi)](PF6)2-sensitized solar cells showed the longest lifetime and the highest Fermi level in the TiO2 conduction band (Fig. 12a). This indicates the best charge separation across the TiO2/dye/electrolyte interface, which is in accordance with the photovoltaic data from Fig. 11, especially the photovoltage. The effect of co-adsorbent chenodeoxycholic acid on the electron lifetime is shown in Fig. 12b, comparing the homoleptic dye [Fe(cpbmi)2](PF6)2 and the heteroleptic push–pull dye [Fe(cpbmi)(dtapbmi)](PF6)2 (data for dye [Fe(cpbmi)(daapbmi)](PF6)2 in Fig. S56†). The addition of co-adsorbent chenodeoxycholic acid did hardly influence the electron lifetime in case of sensitizer [Fe(cpbmi)2](PF6)2, while leading to a rise in Fermi level of more than 50 mV and an order of magnitude longer electron lifetime for its heteroleptic counterpart [Fe(cpbmi)(dtapbmi)](PF6)2. This effect of a dense and effective shielding as well as the charge-separating push–pull sensitizer/co-adsorbent monolayer explains the high PCE of 1.3% obtained. The relatively short electron lifetime for devices with [Fe(cpbmi)(daapbmi)](PF6)2 is possibly caused by slow dye regeneration of the oxidized dye by iodide, leading to more electron recombination to the oxidized dye than for the other dyes. This agrees with the ns-TA measurements, where [Fe(cpbmi)(daapbmi)](PF6)2 showed the slower regeneration dynamics.
3. Conclusion
In this paper, the design, synthesis and characterisation of four new iron–carbene complexes stemming from the parent complex [Fe(pbmi)2](PF6)2 and reference complex [Fe(cpbmi)2](PF6)2 are reported. The design strategy of heteroleptic push–pull complexes as photosensitizers in DSSCs was realized in the complexes [Fe(cpbmi)(dtapbmi)](PF6)2 and [Fe(cpbmi)(daapbmi)](PF6)2, containing aniline and carboxylic acid moieties. The heteroleptic complexes were synthesized using a statistical synthetic methodology. The first crystal structures of heteroleptic six-coordinated iron NHC complexes were obtained, revealing that the geometry around iron did not change much compared to the two corresponding homoleptic complexes [Fe(dtapbmi)2](PF6)2 and [Fe(daapbmi)2](PF6)2. A buffer system was developed allowing to study the carboxylic acid containing iron NHC complexes in their neutral protonated form over a range of concentrations at constant ionic strength. Rewardingly, the molecular design resulted in a directional excitation of the complexes, with broader absorption spectra than the reference complex [Fe(cpbmi)2](PF6)2. For the heteroleptic complexes it was established, by the localization of the LUMO and the first reduction, that the excited electron was mainly localized to the anchor group-containing cpbmi-ligand. Injection was proven by transient absorption spectroscopy and by working solar cells.With [Fe(cpbmi)(dtapbmi)](PF6) as the photosensitizer in a solar cell, a power conversion efficiency of 1.3% was obtained. By only adding the co-sensitizer chenodeoxycholic acid, the solar cell performance of the new generation heteroleptic sensitizer outcompeted the first generation homoleptic reference complex [Fe(cpbmi)2](PF6)2 which has already been subject to several rounds of optimization. This implies that the directional excitation introduced by the here presented novel design and the push–pull effect is capable of yielding better solar cell performance. The addition of chenodeoxycholic acid helps the charge-separation in the dye molecules by improving their alignment and separation between them, thus prolonging the electron lifetime in TiO2. The slower regeneration dynamics of the heteroleptic complexes with the redox mediator (6–8 μs compared to 0.5 μs for reference complex [Fe(cpbmi)2](PF6)2) potentially resulting from a lower driving force in the former case, also indicates that further optimization of the solar cell performance is viable.
The time-resolved spectroscopy suggests that even though injection occurs faster than 100 fs, it also undergoes ultrafast recombination already at the sub-ps timescale. The ultrafast recombination between the resulting oxidized dye and the injected electron is the core reason that only ∼10% of the initially excited molecules yield injected electrons accessible for the DSSC operation. This process serves as the main limitation to the solar cell performance and should be targeted for future dye design strategies. The solar cell performance of [Fe(cpbmi)(dtapbmi)](PF6)2 and not [Fe(cpbmi)(daapbmi)](PF6) is the best obtained in this report, despite the larger fraction of long-lived injected electrons for [Fe(cpbmi)(daapbmi](PF6)2. This is tentatively attributed to the fact that [Fe(cpbmi)(daapbmi)](PF6)2 has slightly worse dye loading compared to [Fe(cpbmi)(dtapbmi](PF6)2, and more efficient slow timescale (>μs) recombination competing with the regeneration. Having identified these important limitations, the results for the new push–pull complexes introduced in this study and the comparison to the reference photosensitizer constitute nevertheless an important step forward in the continued hunt for competitive earth-abundant photosensitizers.
Data availability
The authors can provide primary data upon request.Author contributions
Linnea Lindh performed steady-state and time-resolved spectroscopy measurements, analysed the data, performed quantum chemical calculations, coordinated the writing, wrote major parts and discussed the overall interpretation of results in the manuscript. Olga Gordivska developed the synthetic strategy and performed synthesis of target compounds, assisted in sample preparation for spectroscopic measurements, drafted and coordinated the original paper. Samuel Persson developed the synthetic strategy and performed synthesis as well as chemical characterisation of target compounds, assisted in sample preparation for spectroscopic measurements, wrote major parts and helped coordinating the writing of the paper. Hannes Michaels fabricated and characterized photovoltaic devices, analysed the DSSC results as well as contributed to the writing of the manuscript. Hao Fan helped with synthesis, optimization of the synthetic protocols and participated in the measurement of pH-dependent steady-state absorption spectra. Pavel Chábera performed time-resolved spectroscopy measurements and contributed to the writing of the manuscript. Nils W. Rosemann participated in steady-state absorption measurements and contributed to the writing of the manuscript. Arvind Kumar Gupta contributed to the crystallization of all the Fe(II) complexes and performed and analyzed SC-XRD data. Iacopo Benesperi fabricated and characterized photovoltaic devices, analysed the DSSC results as well as contributed to the writing of the manuscript. Jens Uhlig provided software to fit the time-resolved spectroscopy data, helped with interpretation of data and contributed to the writing of the manuscript. Om Prakash helped with synthesis of the target molecules. Esmaeil Sheibani helped to optimize the synthesis procedure of the target molecules. Kasper S. Kjaer performed initial time-resolved spectroscopy measurements. Gerrit Boschloo helped with the discussion and analysis of DSSC results as well as contributed to the writing of the manuscript. Arkady Yartsev helped with the discussion and analysis of time-resolved spectroscopy results, as well as contributed to the writing of the manuscript. Marina Freitag contributed to interpreting the DSSC results and aided in the conceptualization of the project. Reiner Lomoth contributed to interpreting the (spectro)electrochemistry results and to the writing of the manuscript. Petter Persson contributed to interpreting the quantum chemical calculations, helped outline the manuscript and contributed to the writing of the manuscript. Kenneth Wärnmark conceived and planned the research, contributed to the design of the complexes as well as of their synthetic routes, and outlined and wrote major parts of the manuscript.Conflicts of interest
There are no conflicts to declare.Acknowledgements
The authors acknowledge Daniel Strand for his help with SC-XRD measurements and analyses, Edoardo Domenichini for help with interpreting spectroscopy results, Nidhi Kaul for providing data for electrochemistry and spectroelectrochemistry and Yogesh Goriya for help with synthesis of compounds. The authors would also like to point out the helpful comments and pertinent questions from the referees that contributed to significantly strengthen this manuscript in the reviewing process. The Swedish Foundation for Strategic Research (SSF) as well as the Knut and Alice Wallenberg (KAW) Foundations are acknowledged for financial support. KW acknowledges support from the Swedish Research Council (VR), the Swedish Energy Agency (Energimyndigheten), the LMK Foundation, the Carl Trygger Foundation and the Sten K Johnson Foundation. PP acknowledges support from the Swedish Research Council (VR), the Swedish Energy Agency (Energimyndigheten), eSSENCE, and the computing centres LUNARC and NSC through support via SNIC. RL acknowledges support from the Swedish Research Council (VR). GB acknowledges support from the STandUP for Energy program. NWR gratefully acknowledges funding from the Alexander von Humboldt Foundation within the Feodor-Lynen Fellowship program. JU gratefully acknowledges funding from the Swedish Research Council (VR).References
- N. Rathore, N. L. Panwar, F. Yettou and A. Gama, A comprehensive review of different types of solar photovoltaic cells and their applications, Int. J. Ambient Energy, 2019, 42(10), 1200–1217, DOI:10.1080/01430750.2019.1592774.
- D. G. Nocera and M. P. Nash, Powering the planet: Chemical challenges in solar energy utilization, Proc. Natl. Acad. Sci. U. S. A., 2007, 103(43), 15729–15735, DOI:10.1073/pnas.0603395103.
- B. O'Regan and M. Grätzel, A low-cost, high-efficiency solar cell based on dye-sensitized colloidal TiO2 films, Nature, 1991, 353, 737–740, DOI:10.1038/353737a0.
- M. Grätzel and A. Hagfeldt, Molecular Photovoltaics, Acc. Chem. Res., 2000, 33(5), 269–277, DOI:10.1021/ar980112j.
- A. Hagfeldt, G. Boschloo, L. Sun, L. Kloo and H. Pettersson, Dye-Sensitized Solar Cells, Chem. Rev., 2010, 110(11), 6595–6663, DOI:10.1021/cr900356p.
- A. Carella, F. Borbone and R. Centore, Research Progress on Photosensitizers for DSSC, Front. Chem., 2018, 6(481), 1–24, DOI:10.3389/fchem.2018.00481.
- B. E. Hardin, H. J. Snaith and M. D. McGehee, The renaissance of dye-sensitized solar cells, Nat. Photonics, 2012, 6(3), 162–169 CrossRef CAS.
- M. Graetzel, R. A. J. Janssen, D. B. Mitzi and E. H. Sargent, Materials interface engineering for solution-processed photovoltaics, Nature, 2012, 488(7411), 304–312, DOI:10.1038/nature11476.
- S. Yun, Y. Qin, A. R. Uhl, N. Vlachopoulos, M. Yin and D. Li, et al., New-generation integrated devices based on dye-sensitized and perovskite solar cells, Energy Environ. Sci., 2018, 11(3), 476–526, 10.1039/C7EE03165C.
- S. Ardo and G. J. Meyer, Photodriven heterogeneous charge transfer with transition-metal compounds anchored to TiO2 semiconductor surfaces, Chem. Soc. Rev., 2009, 38(1), 115–164, 10.1039/B804321N.
- D. L. Ashford, M. K. Gish, A. K. Vannucci, M. K. Brennaman, J. L. Templeton and J. M. Papanikolas, et al., Molecular Chromophore–Catalyst Assemblies for Solar Fuel Applications, Chem. Rev., 2015, 115(23), 13006–13049, DOI:10.1021/acs.chemrev.5b00229.
- R. Razeghifard, Natural and Artificial Photosynthesis – Solar Power as an Energy Source, John Wiley and Sons, Inc., Hoboken, New Jersey, 2013 Search PubMed.
- D. M. Arias-Rotondo and J. K. McCusker, The photophysics of photoredox catalysis: a roadmap for catalyst design, Chem. Soc. Rev., 2016, 45(21), 5803–5820, 10.1039/C6CS00526H.
- A. Noble and D. W. C. MacMillan, Photoredox α-Vinylation of α-Amino Acids and N -Aryl Amines, J. Am. Chem. Soc., 2014, 136(33), 11602–11605, DOI:10.1021/ja506094d.
- O. S. Wenger, Photoactive Complexes with Earth-Abundant Metals, J. Am. Chem. Soc., 2018, 140(42), 13522–13533, DOI:10.1021/jacs.8b08822.
- C. Förster and K. Heinze, Photophysics and photochemistry with Earth-abundant metals – fundamentals and concepts, Chem. Soc. Rev., 2020, 49(4), 1057–1070, 10.1039/C9CS00573K.
- B. Bozic-Weber, E. C. Constable and C. E. Housecroft, Light harvesting with Earth abundant d-block metals: Development of sensitizers in dye-sensitized solar cells (DSCs), Coord. Chem. Rev., 2013, 257(21–22), 3089–3106, DOI:10.1016/j.ccr.2013.05.019.
- M. K. Nazeeruddin, A. Kay, I. Rodicio, R. Humphry-Baker, E. Mueller and P. Liska, et al., Conversion of light to electricity by cis-X2bis(2,2’-bipyridyl-4,4’-dicarboxylate)ruthenium(II) charge-transfer sensitizers (X = Cl-, Br-, I-, CN-, and SCN-) on nanocrystalline titanium dioxide electrodes, J. Am. Chem. Soc., 1993, 115(14), 6382–6390, DOI:10.1021/ja00067a063.
- G. Boschloo and A. Hagfeldt, Characteristics of the Iodide/Triiodide Redox Mediator in Dye-Sensitized Solar Cells, Acc. Chem. Res., 2009, 42(11), 1819–1826, DOI:10.1021/ar900138m.
- M. K. Nazeeruddin, P. Péchy, T. Renouard, S. M. Zakeeruddin, R. Humphry-Baker and P. Comte, et al., Engineering of Efficient Panchromatic Sensitizers for Nanocrystalline TiO2 -Based Solar Cells, J. Am. Chem. Soc., 2001, 123(8), 1613–1624, DOI:10.1021/ja003299u.
- C.-Y. Chen, M. Wang, J.-Y. Li, N. Pootrakulchote, L. Alibabaei and C. Ngoc-le, et al., Highly Efficient Light-Harvesting Ruthenium Sensitizer for Thin-Film Dye-Sensitized Solar Cells, ACS Nano, 2009, 3(10), 3103–3109, DOI:10.1021/nn900756s.
- S. Shalini, R. Balasundaraprabhu, T. S. Kumar, N. Prabavathy, S. Senthilarasu and S. Prasanna, Status and outlook of sensitizers/dyes used in dye sensitized solar cells (DSSC): a review, Int. J. Energy Res., 2016, 40(10), 1303–1320, DOI:10.1002/er.3538.
- A. K. Pal and G. S. Hanan, Design, synthesis and excited-state properties of mononuclear Ru(II) complexes of tridentate heterocyclic ligands, Chem. Soc. Rev., 2014, 43(17), 6184–6197, 10.1039/C4CS00123K.
- P. Persson and M. J. Lundqvist, Calculated Structural and Electronic Interactions of the Ruthenium Dye N3 with a Titanium Dioxide Nanocrystal, J. Phys. Chem. B, 2005, 109(24), 11918–11924, DOI:10.1021/jp050513y.
- E. Krawczak, Dye Photosensitizers and their Influence on DSSC Efficiency: a Review, IAPGOS, 2019, 9(3), 86–90, DOI:10.35784/iapgos.34.
- N. A. Anderson and T. Lian, Ultrafast Electron Transfer at the Molecule-Semiconductor Nanoparticle Interface, Annu. Rev. Phys. Chem., 2005, 56(1), 491–519, DOI:10.1146/annurev.physchem.55.091602.094347.
- C. S. Ponseca Jr, P. Chábera, J. Uhlig, P. Persson and V. Sundström, Ultrafast Electron Dynamics in Solar Energy Conversion, Chem. Rev., 2017, 117(16), 10940–11024, DOI:10.1021/acs.chemrev.6b00807.
- S. Aghazada and M. Nazeeruddin, Ruthenium Complexes as Sensitizers in Dye-Sensitized Solar Cells, Inorganics, 2018, 6(2), 52, DOI:10.3390/inorganics6020052.
- B. Durham, J. v. Caspar, J. K. Nagle and T. J. Meyer, Photochemistry of tris(2,2’-bipyridine)ruthenium(2+) ion, J. Am. Chem. Soc., 1982, 104(18), 4803–4810, DOI:10.1021/ja00382a012.
- J. van Houten and R. J. Watts, Temperature dependence of the photophysical and photochemical properties of the tris(2,2’-bipyridyl)ruthenium(II) ion in aqueous solution, J. Am. Chem. Soc., 1976, 98(16), 4853–4858, DOI:10.1021/ja00432a028.
- J.-H. Im, C.-R. Lee, J.-W. Lee, S.-W. Park and N.-G. Park, 6.5% efficient perovskite quantum-dot-sensitized solar cell, Nanoscale, 2011, 3(10), 4088, 10.1039/c1nr10867k.
- H. He, A. Gurung, L. Si and A. G. Sykes, A simple acrylic acid functionalized zinc porphyrin for cost-effective dye-sensitized solar cells, Chem. Commun., 2012, 48(61), 7619–7621, 10.1039/c2cc33337f.
- N. Zhou, K. Prabakaran, B. Lee, S. H. Chang, B. Harutyunyan and P. Guo, et al., Metal-Free Tetrathienoacene Sensitizers for High-Performance Dye-Sensitized Solar Cells, J. Am. Chem. Soc., 2015, 137(13), 4414–4423, DOI:10.1021/ja513254z.
- C. E. Housecroft and E. C. Constable, The emergence of copper(I)-based dye sensitized solar cells, Chem. Soc. Rev., 2015, 44(23), 8386–8398, 10.1039/C5CS00215J.
- N. Alonso-Vante, J.-F. Nierengarten and J.-P. Sauvage, Spectral sensitization of large-band-gap semiconductors (thin films and ceramics) by a carboxylated bis(1,10-phenanthroline)copper(I) complex, J. Chem. Soc., Dalton Trans., 1994, 11(11), 1649–1654, 10.1039/dt9940001649.
- K. Kakiage, Y. Aoyama, T. Yano, K. Oya, J. Fujisawa and M. Hanaya, Highly-efficient dye-sensitized solar cells with collaborative sensitization by silyl-anchor and carboxy-anchor dyes, Chem. Commun., 2015, 51(88), 15894–15897, 10.1039/C5CC06759F.
- J. K. McCusker, Electronic structure in the transition metal block and its implications for light harvesting, Science, 2019, 363(6426), 484–488, DOI:10.1126/science.aav9104.
- T. Duchanois, L. Liu, M. Pastore, A. Monari, C. Cebrián and Y. Trolez, et al., NHC-Based Iron Sensitizers for DSSCs, Inorganics, 2018, 6(2), 63, DOI:10.3390/inorganics6020063.
- M. Abrahamsson, Solar energy conversion using iron polypyridyl type photosensitizers – a viable route for the future?, Photochemistry, 2017, 44, 285–295, 10.1039/9781782626954-00285.
- Y. Liu and K. Wärnmark, 5. Fe Complexes as Photosensitizers for Dye-Sensitized Solar Cells, Emerging Photovoltaic Technologies – Photophysics and Devices, ed. C. S.Ponseca Jr, Jenny Stanford Publishing, Singapore, 2019 Search PubMed.
- O. S. Wenger, Is Iron the New Ruthenium?, Chem.–Eur. J., 2019, 25(24), 6043–6052, DOI:10.1002/chem.201806148.
- M. A. Bergkamp, C. K. Chang and T. L. Netzel, Quantum yield determinations for subnanosecond-lived excited states and photoproducts: applications to inorganic complexes and photosynthetic models, J. Phys. Chem., 1983, 87(22), 4441–4446, DOI:10.1021/j100245a024.
- W. Gawelda, A. Cannizzo, V.-T. Pham, F. van Mourik, C. Bressler and M. Chergui, Ultrafast Nonadiabatic Dynamics of [Fe II (bpy)3]2+ in Solution, J. Am. Chem. Soc., 2007, 129(26), 8199–8206, DOI:10.1021/ja070454x.
- J. E. Monat and J. K. McCusker, Femtosecond Excited-State Dynamics of an Iron(II) Polypyridyl Solar Cell Sensitizer Model, J. Am. Chem. Soc., 2000, 122(17), 4092–4097, DOI:10.1021/ja992436o.
- S. Ferrere and B. A. Gregg, Photosensitization of TiO2 by [Fe II (2,2‘-bipyridine-4,4‘-dicarboxylic acid)2(CN)2]: Band Selective Electron Injection from Ultra-Short-Lived Excited States, J. Am. Chem. Soc., 1998, 120(4), 843–844, DOI:10.1021/ja973504e.
- S. Ferrere, New Photosensitizers Based upon [Fe(L)2(CN)2] and [Fe(L)3] (L = Substituted 2,2‘-Bipyridine): Yields for the Photosensitization of TiO2 and Effects on the Band Selectivity, Chem. Mater., 2000, 12(4), 1083–1089, DOI:10.1021/cm990713k.
- E. A. Juban, A. L. Smeigh, J. E. Monat and J. K. McCusker, Ultrafast dynamics of ligand-field excited states, Coord. Chem. Rev., 2006, 250(13–14), 1783–1791, DOI:10.1016/j.ccr.2006.02.010.
- Y. Liu, P. Persson, V. Sundström and K. Wärnmark, Fe N -Heterocyclic Carbene Complexes as Promising Photosensitizers, Acc. Chem. Res., 2016, 49(8), 1477–1485, DOI:10.1021/acs.accounts.6b00186.
- S. Kaufhold and K. Wärnmark, Design and Synthesis of Photoactive Iron N-Heterocyclic Carbene Complexes, Catalysts, 2020, 10(1), 132, DOI:10.3390/catal10010132.
- L. Lindh, P. Chábera, N. W. Rosemann, J. Uhlig, K. Wärnmark, A. Yartsev and P. Persson, Photophysics and Photochemistry of Iron Carbene Complexes for Solar Energy Conversion and Photocatalysis, Catalysts, 2020, 10(3), 315, DOI:10.3390/catal10030315.
- L. L. Jamula, A. M. Brown, D. Guo and J. K. McCusker, Synthesis and Characterization of a High-Symmetry Ferrous Polypyridyl Complex: Approaching the 5T2/3T1 Crossing Point for Fe II, Inorg. Chem., 2014, 53(1), 15–17, DOI:10.1021/ic402407k.
- M. Abrahamsson, M. Jäger, R. J. Kumar, T. Österman, P. Persson and H.-C. Becker, et al., Bistridentate Ruthenium(II)polypyridyl-Type Complexes with Microsecond 3MLCT State Lifetimes: Sensitizers for Rod-Like Molecular Arrays, J. Am. Chem. Soc., 2008, 130(46), 15533–15542, DOI:10.1021/ja804890k.
- Y. Liu, T. Harlang, S. E. Canton, P. Chábera, K. Suárez-Alcántara and A. Fleckhaus, et al., Towards longer-lived metal-to-ligand charge transfer states of iron(II) complexes: an N-heterocyclic carbene approach, Chem. Commun., 2013, 49(57), 6412–6414, 10.1039/c3cc43833c.
- T. Duchanois, T. Etienne, C. Cebrián, L. Liu, A. Monari and M. Beley, et al., An Iron-Based Photosensitizer with Extended Excited-State Lifetime: Photophysical and Photovoltaic Properties, Eur. J. Inorg. Chem., 2015,(14), 2469–2477, DOI:10.1002/ejic.201500142.
- T. C. B. Harlang, Y. Liu, O. Gordivska, L. A. Fredin, C. S. Ponseca and P. Huang, et al., Iron sensitizer converts light to electrons with 92% yield, Nat. Chem., 2015, 7(11), 883–889, DOI:10.1038/nchem.2365.
- L. Liu, T. Duchanois, T. Etienne, A. Monari, M. Beley and X. Assfeld, et al., A new record excited state 3MLCT lifetime for metalorganic iron(II) complexes, Phys. Chem. Chem. Phys., 2016, 18(18), 12550–12556, 10.1039/c6cp01418f.
- P. Chábera, K. S. Kjaer, O. Prakash, A. Honarfar, Y. Liu and L. A. Fredin, et al., Fe II Hexa N-Heterocyclic Carbene Complex with a 528 ps Metal-to-Ligand Charge-Transfer Excited-State Lifetime, J. Phys. Chem. Lett., 2018, 9(3), 459–463, DOI:10.1021/acs.jpclett.7b02962.
- J. D. Braun, I. B. Lozada, C. Kolodziej, C. Burda, K. M. E. Newman and J. van Lierop, et al., Iron(II) coordination complexes with panchromatic absorption and nanosecond charge-transfer excited state lifetimes, Nat. Chem., 2019, 11, 1144–1150, DOI:10.1038/s41557-019-0357-z.
- C. R. Tichnell, J. N. Miller, C. Liu, S. Mukherjee, E. Jakubikova and J. K. McCusker, Influence of Electrolyte Composition on Ultrafast Interfacial Electron Transfer in Fe-Sensitized TiO2-Based Solar Cells, J. Phys. Chem. C, 2020, 124(3), 1794–1811, DOI:10.1021/acs.jpcc.9b09404.
- M. Karpacheva, C. E. Housecroft and E. C. Constable, Electrolyte tuning in dye-sensitized solar cells with N -heterocyclic carbene (NHC) iron(II) sensitizers, Beilstein J. Nanotechnol., 2018, 9, 3069–3078, DOI:10.3762/bjnano.9.285.
- M. Karpacheva, V. Wyss, C. E. Housecroft and E. C. Constable, There Is a Future for N-Heterocyclic Carbene Iron(II) Dyes in Dye-Sensitized Solar Cells : Improving Performance through Changes in the Electrolyte, Materials, 2019, 12(24), 4181, DOI:10.3390/ma12244181.
- E. Marchini, M. Darari, L. Lazzarin, R. Boaretto, R. Argazzi and C. A. Bignozzi, et al., Recombination and regeneration dynamics in FeNHC(II)-sensitized solar cells, Chem. Commun., 2020, 56(4), 543–546, 10.1039/C9CC07794D.
- A. Reddy-Marri, E. Marchini, V. Diez Cabanes, R. Argazzi, M. Pastore and S. Caramori, et al., Record Power Conversion Efficiencies for Iron(II)-NHC-Sensitized DSSCs from Rational Molecular Engineering and Electrolyte Optimization, J. Mater. Chem. A, 2021, 9(6), 3540–3554, 10.1039/C7TA07529D.
- M. Pastore, T. Duchanois, L. Liu, A. Monari, X. Assfeld and S. Haacke, et al., Interfacial charge separation and photovoltaic efficiency in Fe(II)–carbene sensitized solar cells, Phys. Chem. Chem. Phys., 2016, 18(40), 28069–28081, 10.1039/C6CP05535D.
- F. Bureš, Fundamental aspects of property tuning in push–pull molecules, RSC Adv., 2014, 4(102), 58826–58851, 10.1039/C4RA11264D.
- J. Lu, S. Liu and M. Wang, Push-Pull Zinc Porphyrins as Light-Harvesters for Efficient Dye-Sensitized Solar Cells, Front. Chem., 2018, 6(541) DOI:10.3389/fchem.2018.00541.
- S. Mathew, A. Yella, P. Gao, R. Humphry-Baker, B. F. E. Curchod and N. Ashari-Astani, et al., Dye-sensitized solar cells with 13% efficiency achieved through the molecular engineering of porphyrin sensitizers, Nat. Chem., 2014, 6(3), 242–247, DOI:10.1038/nchem.1861.
- W. A. Rosero, R. Guimaraes, T. Matias and K. Araki, Effect of Push-Pull Ruthenium Complex Adsorption Conformation on the Performance of Dye Sensitized Solar Cells, J. Braz. Chem. Soc., 2020, 31(11), 2250–2264, DOI:10.21577/0103-5053.20200077.
- S. Lyu, Y. Farré, L. Ducasse, Y. Pellegrin, T. Toupance and C. Olivier, et al., Push–pull ruthenium diacetylide complexes: new dyes for p-type dye-sensitized solar cells, RSC Adv., 2016, 6(24), 19928–19936, 10.1039/C5RA25899E.
- A. K. C. Mengel, C. Förster, A. Breivogel, K. Mack, J. R. Ochsmann and F. Laquai, et al., A Heteroleptic Push-Pull Substituted Iron(II) Bis(tridentate) Complex with Low-Energy Charge-Transfer States, Chem.–Eur. J., 2015, 21(2), 704–714, DOI:10.1002/chem.201404955.
- D. P. Hagberg, J.-H. Yum, H. Lee, F. de Angelis, T. Marinado and K. M. Karlsson, et al., Molecular Engineering of Organic Sensitizers for Dye-Sensitized Solar Cell Applications, J. Am. Chem. Soc., 2008, 130(19), 6259–6266, DOI:10.1002/tcr.201100044.
- A. J. Hoefnagel, M. A. Hoefnagel and B. M. Wepster, Substituent effects. 8. Basic strength of azatriptycene, triphenylamine, and some related amines, J. Org. Chem., 1981, 46(21), 4209–4211, DOI:10.1021/jo00334a021.
- S. Tshepelevitsh, A. Kütt, M. Lõkov, I. Kaljurand, J. Saame and A. Heering, et al., On the Basicity of Organic Bases in Different Media, Eur. J. Org. Chem., 2019,(40), 6735–6748, DOI:10.1002/ejoc.201900956.
- T. Duchanois, T. Etienne, M. Beley, X. Assfeld, E. A. Perpète and A. Monari, et al., Heteroleptic Pyridyl-Carbene Iron Complexes with Tuneable Electronic Properties, Eur. J. Inorg. Chem., 2014,(23), 3747–3753, DOI:10.1002/ejic.201402356.
- S. Amthor, B. Noller and C. Lambert, UV/Vis/NIR spectral properties of triarylamines and their corresponding radical cations, Chem. Phys., 2005, 316(1–3), 141–152, DOI:10.1016/j.chemphys.2005.05.009.
- L. A. Fredin, K. Wärnmark, V. Sundström and P. Persson, Molecular and Interfacial Calculations of Iron(II) Light Harvesters, ChemSusChem, 2016, 9(7), 667–675, DOI:10.1002/cssc.201600062.
- M. Chergui, Ultrafast Photophysics of Transition Metal Complexes, Acc. Chem. Res., 2015, 48(3), 801–808, DOI:10.1021/ar500358q.
- H. Imahori, S. Kang, H. Hayashi, M. Haruta, H. Kurata and S. Isoda, et al., Photoinduced Charge Carrier Dynamics of Zn−Porphyrin−TiO2 Electrodes: The Key Role of Charge Recombination for Solar Cell Performance, J. Phys. Chem. A, 2011, 115(16), 3679–3690, DOI:10.1021/jp103747t.
- H. Němec, J. Rochford, O. Taratula, E. Galoppini, P. Kužel, T. Polívka, A. Yartsev and V. Sundström, Influence of the electron-cation interaction on electron mobility in dye-sensitized ZnO and TiO2 nanocrystals: A study using ultrafast terahertz spectroscopy, Phys. Rev. Lett., 2010, 104(19), 197401–197405, DOI:10.1103/PhysRevLett.104.197401.
- U. B. Cappel, S. M. Feldt, J. Schöneboom, A. Hagfeldt and G. Boschloo, The influence of local electric fields on photoinduced absorption in dye-sensitized solar cells, J. Am. Chem. Soc., 2010, 132(26), 9096–9101, DOI:10.1021/ja102334h.
- G. Boschloo, E. A. Gibson and A. Hagfeldt, Photomodulated Voltammetry of Iodide/Triiodide Redox Electrolytes and Its Relevance to Dye-Sensitized Solar Cells, J. Phys. Chem. Lett., 2011, 2(24), 3016–3020, DOI:10.1021/jz2014314.
- H. Michaels, M. Rinderle, R. Freitag, I. Benesperi, T. Edvinsson and R. Socher, et al., Dye-sensitized solar cells under ambient light powering machine learning: towards autonomous smart sensors for the internet of things, Chem. Sci., 2020, 11(11), 2895–2906, 10.1039/C9SC06145B.
- S. Ito, H. Miura, S. Uchida, M. Takata, K. Sumioka and P. Liska, et al., High-conversion-efficiency organic dye-sensitized solar cells with a novel indoline dye, Chem. Commun., 2008,(41), 5194–5196, 10.1039/b809093a.
- T. Daeneke, T.-H. Kwon, A. B. Holmes, N. W. Duffy, U. Bach and L. Spiccia, High-efficiency dye-sensitized solar cells with ferrocene-based electrolytes, Nat. Chem., 2011, 3(3), 211–215, DOI:10.1038/nchem.966.
- A. Yella, C.-L. Mai, S. M. Zakeeruddin, S.-N. Chang, C.-H. Hsieh and C.-Y. Yeh, et al., Molecular Engineering of Push-Pull Porphyrin Dyes for Highly Efficient Dye-Sensitized Solar Cells: The Role of Benzene Spacers, Angew. Chem., 2014, 126(11), 3017–3021, DOI:10.1002/ange.201309343.
- Y. Saygili, M. Stojanovic, H. Michaels, J. Tiepelt, J. Teuscher and A. Massaro, et al., Effect of Coordination Sphere Geometry of Copper Redox Mediators on Regeneration and Recombination Behavior in Dye-Sensitized Solar Cell Applications, ACS Appl. Energy Mater., 2018, 1(9), 4950–4962, DOI:10.1021/acsaem.8b00957.
- K. Sunahara, J. Ogawa and S. Mori, A method to measure electron lifetime in dye-sensitized solar cells: Stepped current induced measurement of cell voltage in the dark, Electrochem. Commun., 2011, 13(12), 1420–1422, DOI:10.1016/j.elecom.2011.09.005.
- J. Bisquert, F. Fabregat-Santiago, I. Mora-Seró, G. Garcia-Belmonte and S. Giménez, Electron Lifetime in Dye-Sensitized Solar Cells: Theory and Interpretation of Measurements, J. Phys. Chem. C, 2009, 113(40), 17278–17290, DOI:10.1021/jp9037649.
Footnotes |
| † Electronic supplementary information (ESI) available: Further details and experimental section. CCDC 2045349, 2045350, 2045879, 2050281, 2070990 and 2034279. For ESI and crystallographic data in CIF or other electronic format see DOI: 10.1039/d1sc02963k |
| ‡ These authors contributed equally to this work. |
| This journal is © The Royal Society of Chemistry 2021 |


