 Open Access Article
Quantification of the charge transport processes inside carbon nanopipettes†
Rujia
Liu
,
Yingfei
Ma
,
Xiaoyue
Shen
and
Dengchao
Wang
 *
*
School of Chemical Sciences, University of Chinese Academy of Sciences, Beijing 10049, P. R. China. E-mail: wangdengchao@ucas.ac.cn
First published on 4th October 2021
Abstract
Conductive nanopipettes have been extensively used as powerful multifunctional probes for electrochemical and ion transport measurements, while the involved charge transfer processes have not been fully explored. In this paper, we use both experimental and simulation methods to de-convolute and quantify the respective electron transfer (ET) and ion transport (IT) contributions to the resulting current signals in carbon nanopipettes (CNPs). The results present that the current signals in CNPs are determined by ET in the case of low solution depth and long timescales, while IT becomes dominant at short timescales or high solution depth. In addition, the electrochemically and chemically irreversible ET processes in CNPs were also quantified. The elucidated and quantified charge transport processes inside CNPs will help control and optimize the IT and ET processes at the nanoscale, promoting better and broad usage of conductive nanopipettes in single-entity sensing and imaging applications.
Introduction
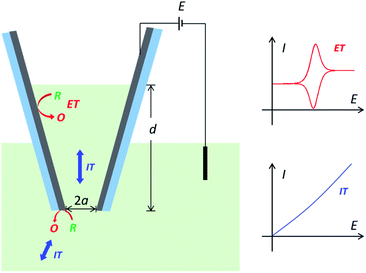
With the merits of both the pipette geometry and electrochemical interface, conductive nanopipettes have been receiving great attention recently for fundamental research and used as a multi-functional platform in single-entity sensing and imaging applications.1–6 Besides the simultaneous recording of electron transfer (ET) and ion transport (IT) signals, the interplay between ET and IT also leads to novel charge transport features, such as wireless bipolar sensing,7 charge-selective electrochemistry,8,9 and electron-transfer gated ion current rectification.10 Furthermore, the small size and confined electrochemical interface also make conductive nanopipettes powerful probes for local experiments in single living cells.11–14 It is therefore greatly desired and beneficial to elucidate and quantify the involved charge transfer processes in conductive nanopipettes, toward quantitative analysis and better usage in those emerging applications.However, the charge transport process in conductive nanopipettes is generally very complicated and has not been fully revealed, as it includes both IT and ET processes,5 which are coupled and determined by many critical geometric and experimental parameters. Take carbon nanopipettes (CNPs) as an example. When applying a potential at the carbon layer, thin-layer electrochemistry is expected with symmetric oxidation/reduction peaks from the cavity, on top of steady-state currents from the carbon near the pipette orifice.15 The more solution that enters CNPs, the higher the resulting peak current will be.8,15 But note that ET reactions at the carbon surface are coupled with ion/molecule transport processes, so resistive IT processes would start to superimpose onto the ET processes at high solution depth (Scheme 1). Moreover, the IT process in nanopipettes is known to be time-dependent,16–18 and thus the charge transport processes in CNPs at different timescales need to be elaborated as well. In addition, it is also very encouraging to study and quantify complicated ET processes in CNPs, as the electro-active species in real samples could be very diverse in content and ET mechanism. Quantitative understanding of the charge transport features is the key to reliable measurements and analysis for CNP-based applications. With the elucidated charge transport processes in CNPs, the desired reporting signals, i.e. IT in rectification and resistive pulse sensing,19 ET in single entity measurements,20 or both IT and ET signals,12 can then be better optimized and quantified.
Conductive nanopipettes can be fabricated by coating the interior wall of glass/quartz nanopipettes with conductive material, i.e. carbon,21 gold,22 platinum,23 or silver.7 In general, the pipette geometry and thickness of the conductive layer can be actively controlled by the fabrication parameters.15 But it is still very challenging to fully characterize the inner part of the conductive nanopipettes, and correlate the geometry and surface features to the resulting current signals, due to the heterogeneity in the fabricated conductive nanopipettes. In this case, numerical simulation is always used to help gain physical insights and establish a quantitative correlation.9,15
In this paper, we will de-convolute the charge transfer processes inside the carbon nanopipettes, and quantify the respective ET and IT contributions to the resulting current with both experiments and simulation. The steady-state and time dependent current responses were studied, and the effects of potential scan rate, solution depth, redox mediator and electrolyte concentration were systematically studied. In addition to the commonly used redox mediator, electrochemically and chemically irreversible ET reactions in CNPs were also studied and quantified. These results would not only reveal the fundamental charge transport processes in broadly defined conductive nanopipettes, but also greatly help to promote better usage of the conductive nanopipettes for in situ analysis in more extensive applications.
Experimental section
Chemicals and materials
Potassium chloride (KCl), potassium ferrocyanide trihydrate (K4Fe(CN)6·3H2O), iron(III) chloride (FeCl3), dopamine hydrochloride (DA), L-ascoribic acid (AA), uric acid (UA), and phosphate buffered saline buffer (PBS buffer, pH 7.4) premixed powder were obtained from Macklin, and sulfuric acid (H2SO4) was purchased from Sinopharm Chemical Reagent Co., Ltd. All chemicals were used as received. Ultrapure water (18.2 MΩ cm) with total organic carbon (TOC) ≪ 3 ppb was obtained from a Milli-Q 3 UV system (Millipore) and used for all aqueous solutions. The quartz capillaries (Q100-50-7.5, o.d. = 1 mm, i.d. = 0.5 mm and length = 7.5 cm) were from Sutter Instrument Co.Fabrication of carbon nanopipettes (CNPs)
The fabrication of the carbon nanopipettes followed previously reported procedures.15,21 Briefly, the quartz nanopipettes were first obtained by pulling capillaries with a laser puller (P-2000, Sutter Instruments) (parameters: HEAT = 680, FIL = 3, VEL = 22, DEL = 135, PUL = 100). A layer of carbon was then deposited on their interior surface by the chemical vapor deposition method, using methane as the carbon source and argon as the protector (v/v = 3![[thin space (1/6-em)]](https://www.rsc.org/images/entities/char_2009.gif) :
:![[thin space (1/6-em)]](https://www.rsc.org/images/entities/char_2009.gif) 2) at 970 °C in a furnace.
2) at 970 °C in a furnace.
Instrumentation and procedures
The geometry of the prepared CNPs was characterized by transmission electron microscopy (TEM, JEOL TEM-2100). The radius of the CNPs is ca. 30–50 nm, with a half-cone angle of 6–8° (Fig. S1†). The electrochemical measurements were conducted using a Gamry 600+ potentiostat inside a home-made Faraday cage. By applying a potential at the carbon layer, the CNPs were used as the working electrode, with home-made Ag/AgCl wire as the counter and the reference electrode. In all the experiments, the potentials were referenced with respect to Ag/AgCl wire.Simulation methods
Numerical simulations were also performed to help study the charge transport process in carbon nanopipettes using commercial software COMSOL Multiphysics 5.4 with a 2D-axisymmetric model. The mass transport processes in the solution can be described by the Nernst–Planck equation: | (1) |
JR = k0c0![[thin space (1/6-em)]](https://www.rsc.org/images/entities/char_2009.gif) e−αf(E−ϕ−E0) − k0cR e−αf(E−ϕ−E0) − k0cR![[thin space (1/6-em)]](https://www.rsc.org/images/entities/char_2009.gif) e(1−α)f(E−ϕ−E0) e(1−α)f(E−ϕ−E0) | (2) |
JO = −k0c0![[thin space (1/6-em)]](https://www.rsc.org/images/entities/char_2009.gif) e−αf(E−ϕ−E0) + k0cR e−αf(E−ϕ−E0) + k0cR![[thin space (1/6-em)]](https://www.rsc.org/images/entities/char_2009.gif) e(1−α)f(E−ϕ−E0) e(1−α)f(E−ϕ−E0) | (3) |
 | (4) |
Meanwhile, the solution potential and current in the solution should follow Ohm's law, with a known solution conductance (σ).
| i = σϕ | (5) |
By combining eqn (1)–(5), the charge transport processes and resulting ionic currents in CNPs can be solved and obtained.
Results and discussion
Steady-state study
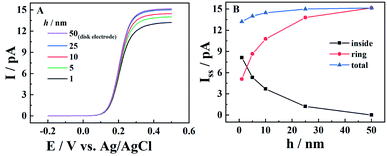
The steady-state current of carbon nanopipettes is firstly studied, as it is widely used for size estimation and sensing applications.1 Theoretically, the steady-state current originates from both the carbon ring and inner carbon near the orifice. Thus, the effect of carbon layer thickness (h) on steady-state current is studied in the simulation. As shown in Fig. 1, with a fixed 50 nm-radius quartz nanopipette, the diffusion-limited current (i.e. E > 0.4 V) increases slightly when h increases, and reaches a threshold when h > 25 nm. This is because the edge of the carbon ring exposed to bulk solution is known to mainly contribute to the steady state currents, which is evidenced by the simulation of the CNPs with different radii (Fig. S2†). This result also suggests that the size of conductive nanopipettes can be roughly estimated by the equations for disk nanoelectrodes, as the diffusion-limited currents at various h values are quite comparable, and plateaued when h > 0.5a. It is also interesting to see the current from the ring and inner carbon show different trends with respect to h. As shown in panel B, with the increase of h, the carbon ring current increases, while the current of the inner carbon decreases. It is also worth pointing out that as the pipette orifice region mainly contributes to the steady-state currents, the half-cone angle of CNPs has a negligible effect on the resulting current signals (Fig. S3†).Time-dependent study
In addition to steady-state currents, transient-state responses of CNPs are also widely recorded and analyzed in resistive pulse sensing, electrochemical collisions, and fast scan rate cyclic voltammetry measurements,11,20,24 to reveal the physicochemical features of the analytes. As both ET and IT processes contribute to the charge transport processes, we systematically vary the experimental conditions to reveal their contributions to the resulting current responses.Scan rate effect
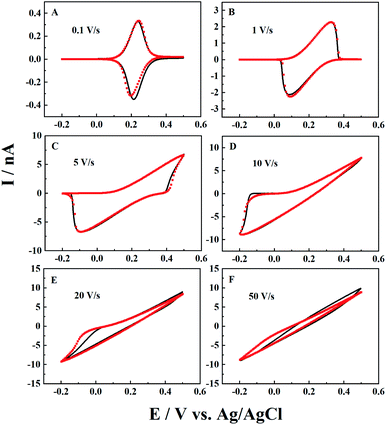
The scan rate effect on the resulting current signals is firstly studied by both experiments and simulation, as shown in Fig. 2. It is interesting to see that the experimental results can be well fitted by simulation at a wide range of scan rates. For CNPs with a 50 nm radius in 1 mM K4Fe(CN)6 and 0.1 M KCl, typical thin layer electrochemical responses with symmetrical redox peaks are observed at a low scan rate of 0.1 V s−1. When the scan rate increases from 0.1 V s−1 to 20 V s−1 (panels B to E), both the oxidative and reductive peaks gradually move to higher potential ends and finally disappear at 50 V s−1.This can be explained by the finite diffusion length of the ions during the timescale of the experiments. With the obtained solution depth of 2000a, the ions have enough time to transport inside the CNPs and get involved in ET reactions at deep sites, and thus ET dominates the signals at lower scan rates (v < 0.1 V s−1). Meanwhile, at extremely high scan rates with a very short timescale (i.e. v > 50 V s−1), IT dominates the resulting current signals. For the intermediate scan rates, both ET and IT contribute to the current signals, so the linear i–V curve is superimposed onto the symmetric oxidation/reduction peaks, shifting the oxidative and reductive peaks toward higher potential ends. Here for this pipette, the IT resistance (RIT) is estimated to be 0.039 GΩ from the linear i–V response in panel F, which agrees well with the calculated geometry resistance of the CNPs (0.04 GΩ) (see the ESI† for calculation details).
Solution depth effect
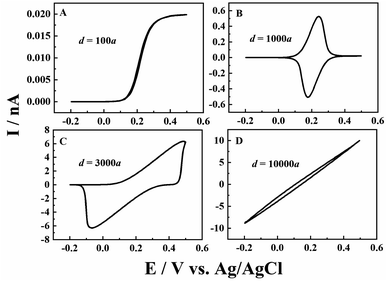
Besides the scan rate, the solution depth (d) is also varied to further explore the ion diffusion length effect in CNPs. As d is very difficult to be accurately obtained and controlled in experiments, the numerical simulation is used to reveal its effects. As shown in Fig. 3, at a fixed scan rate of 0.1 V s−1, when a small amount of solution (d = 100a, panel A) enters the CNPs, a sigmodal i–V response is observed, suggesting that the system can quickly reach the steady state. As the solution enters a little deeper (d = 1000a), a thin layer electrochemical response with a pair of redox peaks is shown in the i–V curves (panel B), indicating the diffusion of the redox mediators toward the carbon surface. Upon further increasing the solution depth, the RIT becomes larger and superimposed in the CV curves, so the redox peaks move to both potential ends (panel C). Finally, with a much larger d value of 10![[thin space (1/6-em)]](https://www.rsc.org/images/entities/char_2009.gif) 000a (panel D), only the ion transport current can be seen at −0.2–0.5 V. This scenario is similar to that of solution filled carbon nanopipettes, where ion transport dominates the charge transport process in this case.
000a (panel D), only the ion transport current can be seen at −0.2–0.5 V. This scenario is similar to that of solution filled carbon nanopipettes, where ion transport dominates the charge transport process in this case.
By roughly controlling the solution depth with external pressure, we also obtain experimental voltammograms at solution depths of ∼170a, 840a, 3000a, and >10![[thin space (1/6-em)]](https://www.rsc.org/images/entities/char_2009.gif) 000a, which are estimated from the enclosed charges in the voltammogram. The depth of 10000a is just a guess as no redox peaks can be used for evaluation. As shown in Fig. S4,† the experimental results are in good agreement with the simulation.
000a, which are estimated from the enclosed charges in the voltammogram. The depth of 10000a is just a guess as no redox peaks can be used for evaluation. As shown in Fig. S4,† the experimental results are in good agreement with the simulation.
From the experimental and simulation results, we can now see that the ion diffusion length is critical to the charge transport processes in conductive nanopipettes. At slow scan rates or low solution depth, the ions have sufficient time to arrive at the interior surface and undergo ET processes, and thus typical thin layer electrochemical or steady-state sigmodal responses are observed in the voltammogram. Meanwhile, at higher scan rates or greater solution depths, the ion transport is too slow to reach the deep sites in the nanopipettes, so resistive IT processes start to superimpose and dominate the current signals.
Redox mediator concentration effect
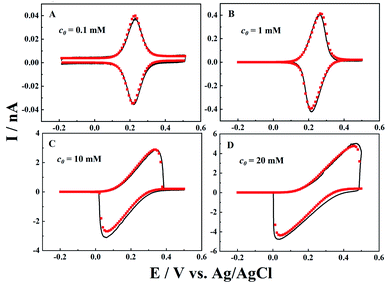
Besides the diffusion length effect, both the concentration of the redox mediator and ionic strength are also systematically studied, as they directly determine the ET and IT currents. Cyclic voltammograms (black curves) for different redox mediator concentrations (c0) are recorded, and fitted by simulation (red points). As shown in Fig. 4, at a low concentration of 0.1 mM, perfect symmetric oxidative and reductive peaks are obtained as the potential drop in the solution is negligible (i.e. 0.04 nA × 0.04 GΩ = 1.6 mV). When c0 increases to 1 mM, the peak current is 10 times higher than that at 0.1 mM, and very small shifts in oxidative and reductive peaks are displayed, as the potential drop in the solution is now ∼16 mV. Following the same pattern, larger potential drops were observed inside the nanopipettes at higher c0. In the case of 20 mM K4Fe(CN)6, we can clearly see that the resistive IT process distorted the voltammogram, and both the oxidative and reductive peaks shift to higher potential ends. At the same time, the peak current is only about 1.6 times that at 10 mM, though c0 is 2 times higher.Electrolyte concentration effect
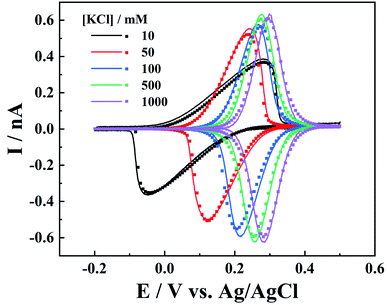
On the other hand, the electrolyte concentration effect on IT and ET responses is also studied. As the IT conductance is proportional to electrolyte concentration, symmetric oxidative/reductive peaks are expected at higher ionic strength, while at low ionic strength, resistive IT would shift the oxidative and reductive peaks, leading to smaller peak currents (Fig. 5). It is interesting to see that all the voltammograms at various ionic strengths can be well fitted by simulation with the same parameters, after potential correction of the referenced Ag/AgCl wire in the respective KCl solution (calculation details are included in the ESI†).It is worth pointing out that, at low ionic strength, the surface charges could also play an important role in the charge transport processes. The negative surface charges at the carbon layer would attract the cations and repel the anions, so lower current signals are expected for the redox anions, while redox cations would result in larger currents.9 Here in our case (c1 > 10 mM), we found that the surface charge effect is negligible as the experiments can be well fitted by the diffusion model.
Slow ET kinetics
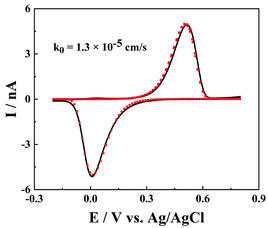
Besides the model redox mediator, ET processes of the electroactive species in real samples could be more complicated, such as electrochemically and chemically irreversible ET processes. As shown in Fig. 6, for a much slower ET reaction between Fe3+ and Fe2+, both the oxidation and reduction peaks shift to higher potential ends, but the peak shape is not distorted. Note that the IT resistance here is too small to affect the charge transport processes, and the slow ET kinetics require slightly large over-potentials to drive ET reactions and produce noticeable oxidation/reduction peaks. The fitted rate constant of Fe3+/Fe2+ at the carbon surface is 1.3 × 10⁻⁵ cm s−1, which is in good agreement with the reported value.25 But it is worth pointing out that the rate constant of Fe3+/Fe2+ is very sensitive to the surface features of the carbon (morphology, structure and surface groups),26 so the measured rate constants could vary at different CNPs.Chemical reversibility
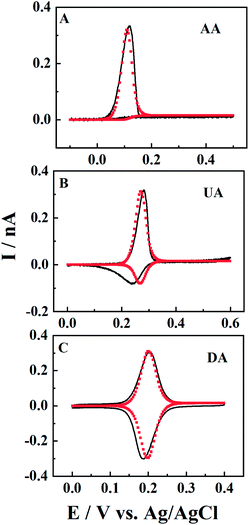
There are many electroactive substances in biological systems that have a chemical reaction following an initial electron-transfer oxidation (EC reaction). For example, different from dopamine (DA), the electro-oxidation products of uric acid (UA) and ascorbic acid (AA) can be easily hydrolysed (reaction rate is kc) and the electro-oxidation proceeds through an irreversible EC mechanism27 (see the ESI†). Here, the ET processes of DA, UA and AA in CNPs (black solid line) are also studied, and fitted by simulation (red points). The solutions are 0.5 mM DA/UA/AA containing 10 mM PBS (pH 7.4) and the scan rate is 0.1 V s−1. It is shown that when kc > 0.8 s−1, such as for AA (Fig. 7, panel A), the posterior chemical reaction is so fast that no reversible reduction is shown in the voltammogram. For the UA response in panel B, there is a big oxidation peak and a small reduction peak in the reverse scan, suggesting a small kc value of 0.2 s−1. It is worth pointing out that the broader reduction peak might indicate a one-electron ET process (Fig. S5†), or a combination of multiple reduction peaks with different formal potentials, which may be due to the heterogeneity of the carbon surface. When kc < 0.01 s−1, the oxidative product produced by the electrochemical reaction can be largely maintained in the solution, before it goes through a chemical reaction. In this case, symmetric redox peaks are displayed in the CV curves, such as for DA (panel C).Conclusions
In this paper, the charge transport processes inside carbon nanopipettes have been investigated by both experiments and simulation. The ion diffusion length is found to be critical to the charge transport processes in conductive nanopipettes. At slow scan rates or low solution depth, the ET processes at the carbon layer dominate the resulting current signals, while IT starts to take effect and dominate the current signals at high scan rates and/or high solution depth, as the ions do not have sufficient time to diffuse inside the nanopipettes and get involved in the ET reaction. In addition, low Faraday current or electrolyte resistivity would lead to more predominant ET responses, while high Faraday current and high solution resistivity suggest a larger IT contribution. Lastly, complex ET reactions with slow kinetics and the following chemical reaction have also been studied and quantified, showing varying and unique effects on charge transport processes. Overall, these results present the fundamental charge transport processes in CNPs, which will help select and optimize the experimental conditions and offer a quantitative description for emerging CNP-based applications.Data availability
All study data are included in the article and/or ESI.†Author contributions
D. W. conceived the project. R. L. performed the experiments and numerical simulation. Y. M. and X. S. contributed to the CNP preparation and electrochemical tests. R. L. and D. W. wrote the manuscript, and all authors discussed the results and revised the manuscript.Conflicts of interest
There are no conflicts to declare.Acknowledgements
This work was supported by the National Natural Science Foundation of China (No. 21904126) and the Fundamental Research Funds for the Central Universities.References
- K. Hu, Y. Wang, H. Cai, M. V. Mirkin, Y. Gao, G. Friedman and Y. Gogotsi, Anal. Chem., 2014, 86, 8897–8901 CrossRef CAS PubMed.
- R. J. Yu, Y. L. Ying, R. Gao and Y. T. Long, Angew. Chem., Int. Ed., 2019, 58, 3706–3714 CrossRef CAS PubMed.
- S. M. Lu, Y. Y. Peng, Y. L. Ying and Y. T. Long, Anal. Chem., 2020, 92, 5621–5644 CrossRef CAS PubMed.
- S. Zhang, M. Li, B. Su and Y. Shao, Annu. Rev. Anal. Chem., 2018, 11, 265–286 CrossRef PubMed.
- R. Jia and M. V. Mirkin, Chem. Sci., 2020, 11, 9056–9066 RSC.
- Y. Takahashi, A. I. Shevchuk, P. Novak, Y. Murakami, H. Shiku, Y. E. Korchev and T. Matsue, J. Am. Chem. Soc., 2010, 132, 10118–10126 CrossRef CAS PubMed.
- R. Gao, Y. L. Ying, Y. X. Hu, Y. J. Li and Y. T. Long, Anal. Chem., 2017, 89, 7382–7387 CrossRef CAS PubMed.
- K. Hu, D. Wang, M. Zhou, J. H. Bae, Y. Yu, H. Xin and M. V. Mirkin, Anal. Chem., 2019, 91, 12935–12941 CrossRef CAS PubMed.
- J. H. Bae, D. Wang, K. Hu and M. V. Mirkin, Anal. Chem., 2019, 91, 5530–5536 CrossRef CAS PubMed.
- D. Wang and M. V. Mirkin, J. Am. Chem. Soc., 2017, 139, 11654–11657 CrossRef CAS PubMed.
- R. Pan, K. Hu, R. Jia, S. A. Rotenberg, D. Jiang and M. V. Mirkin, J. Am. Chem. Soc., 2020, 142, 5778–5784 CrossRef CAS PubMed.
- R. Pan, K. Hu, D. Jiang, U. Samuni and M. V. Mirkin, J. Am. Chem. Soc., 2019, 141, 19555–19559 CrossRef CAS PubMed.
- K. Hu, R. Jia, A. Hatamie, K. L. Le Vo, M. V. Mirkin and A. G. Ewing, J. Am. Chem. Soc., 2020, 142, 16910–16914 CrossRef CAS PubMed.
- Y. L. Ying, Y. X. Hu, R. Gao, R. J. Yu, Z. Gu, L. P. Lee and Y. T. Long, J. Am. Chem. Soc., 2018, 140, 5385–5392 CrossRef CAS PubMed.
- Y. Yu, J. M. Noel, M. V. Mirkin, Y. Gao, O. Mashtalir, G. Friedman and Y. Gogotsi, Anal. Chem., 2014, 86, 3365–3372 CrossRef CAS PubMed.
- J. P. Guerrette and B. Zhang, J. Am. Chem. Soc., 2010, 132, 17088–17091 CrossRef CAS PubMed.
- D. Momotenko and H. H. Girault, J. Am. Chem. Soc., 2011, 133, 14496–14499 CrossRef CAS PubMed.
- D. Wang, J. Liu, M. Kvetny, Y. Li, W. Brown and G. Wang, Chem. Sci., 2014, 5, 1827–1832 RSC.
- Y. Wang, D. Wang and M. V. Mirkin, Proc. R. Soc. A, 2017, 473, 20160931 CrossRef PubMed.
- R. Liu, X. Shen and D. Wang, Anal. Chem., 2021, 93, 7394–7398 CrossRef CAS PubMed.
- B. M. Kim, T. Murray and H. H. Bau, Nanotechnology, 2005, 16, 1317–1320 CrossRef CAS.
- C. Yang, P. Hinkle, J. Menestrina, I. V. Vlassiouk and Z. S. Siwy, J. Phys. Chem. Lett., 2016, 7, 4152–4158 CrossRef CAS PubMed.
- R. Pan, M. Xu, J. D. Burgess, D. Jiang and H.-Y. Chen, Proc. Nat. Acad. Sci., 2018, 115, 4087–4092 CrossRef CAS PubMed.
- C. Yang, K. K. Hu, D. C. Wang, Y. Zubi, S. T. Lee, P. Puthongkham, M. V. Mirkin and B. J. Venton, Anal. Chem., 2019, 91, 4618–4624 CrossRef CAS PubMed.
- S. Ferro and A. D. Battisi, Electrochim. Acta, 2002, 47, 1641–1649 CrossRef CAS.
- L. Tang, Y. Wang, Y. Li, H. Feng, J. Lu and J. Li, Adv. Funct. Mater., 2009, 19, 2782–2789 CrossRef CAS.
- L. Xiao, J. Chen and C. Cha, J. Electroanal. Chem., 2000, 495, 27–35 CrossRef CAS.
Footnote |
| † Electronic supplementary information (ESI) available: TEM image of the prepared CNPs; calculation details of the solution resistance, and potential correction of the reference electrode. See DOI: 10.1039/d1sc04282c |
| This journal is © The Royal Society of Chemistry 2021 |

