Effective electrode design and the reaction mechanism for electrochemical promotion of ammonia synthesis using Fe-based electrode catalysts†
Chien-I.
Li
,
Hiroki
Matsuo
 and
Junichiro
Otomo
 *
*
Department of Environment Systems, Graduate School of Frontier Sciences, The University of Tokyo, 5-1-5 Kashiwanoha, Kashiwa-shi, Chiba 277-8563, Japan. E-mail: otomo@k.u-tokyo.ac.jp
First published on 3rd November 2020
Abstract
The electrochemical promotion of ammonia formation on Fe-based electrode catalysts is investigated using proton-conducting-electrolyte-supported cells of H2–Ar, Pt|BaCe0.9Y0.1O3 (BCY)| Fe-based catalysts, H2–N2 at temperatures between 550 °C and 600 °C, and ambient pressure. To clarify the reaction mechanism, the ammonia formation rate is examined using two cathodes: (I) a porous pure Fe electrode with a shorter triple phase boundary (TPB) length and (II) a cermet electrode consisting of Fe–BCY (or W–Fe–BCY) with a longer TPB length. Using the different electrode structures, we investigate the effects of cathodic polarization, hydrogen partial pressure, and electrode materials. The porous pure Fe electrode shows better performance than the Fe–BCY cermet electrode, which suggests that the ammonia formation is accelerated by the electrochemical promotion of catalysis (EPOC) effect on the Fe surface rather than the charge-transfer reaction at the TPB. The electrochemical promotion is governed by a dissociative mechanism, i.e., acceleration of direct N2 bond dissociation with cathodic polarization on the Fe surface, with a smaller contribution by a proton-assisted associative mechanism at the TPB. These findings indicate that the porous pure Fe electrode is more effective for ammonia formation than the (W–)Fe–BCY cermet electrode. Despite the relatively short TPB length, the porous pure Fe cathode achieves a very high ammonia formation rate of 1.4 × 10⁻⁸ mol cm−2 s−1 (450 μg h−1 mg−1) under appropriate conditions. This significant result suggests that the effective double layer spreads widely on the Fe electrode surface. Using the identified reaction mechanism, we discuss key processes for improving ammonia formation.
Introduction
Ammonia is an essential product in our daily life, with millions of tons synthesized each year worldwide and the majority used as a nitrogen fertilizer for agriculture.1 In addition to agriculture, ammonia is also a great candidate for the chemical energy carrier of hydrogen because of its high hydrogen density of approximately 17.8% by weight.2 Today, ammonia is industrially fabricated using the Haber–Bosch process, in which N2 reacts with H2 to form ammonia at high pressure and high temperature using iron-based catalysts.3 However, in addition to its low energy efficiency, another challenging issue is that H2 is commonly produced by methane steam reforming, which releases a large amount of carbon dioxide.4 Therefore, there is growing interest in alternative and green processes for ammonia synthesis, especially by electrochemical reactions.5–24 The advantages of the electrochemical synthesis of ammonia include carbon-free emission,25 decentralized production,25 and higher energy efficiency.26In the electrochemical synthesis of ammonia using a proton-conducting electrolyte membrane, water dissociates to form protons at the anode (eqn (1)), and then the protons pass through the electrolyte membrane toward the cathode and react with nitrogen and electrons to form ammonia (eqn (2)). The overall reaction of ammonia formation is described in eqn (3). Some previous studies replaced H2 for H2O in the anode to simplify the system and to investigate the N2 reduction in the cathode.5,6,8–11,15,16,21–23
Anode:
 | (1) |
Cathode:
| N2 + 6H+ + 6e− → 2NH3 | (2) |
Overall:
 | (3) |
The reaction mechanisms for ammonia electrochemical synthesis can be divided into two mechanisms, as described in eqn (4)–(9). For ammonia formation, N2 and H2 molecules adsorb on the catalyst surface and dissociate to form 2N* and 2H*, and then the adsorbates of H* and N* react to form NH3.27 In general, the reaction of N2 dissociation is considered as the rate-determining step in ammonia formation.28–33 To promote the electrochemical reaction of ammonia formation, appropriate catalysts,34–37 and/or applying a voltage to accelerate the reaction of N2 dissociation11,15,24,36 were proposed. The reaction mechanism in N2 dissociation was the same as that in the Haber–Bosch process with the Fe catalyst, in which the NH3 formation reaction is followed by a dissociative mechanism (eqn. (4)–(7)). The rate-determining step is the dissociation of  into 2N* on the catalyst surface (a two-phase boundary) (eqn (5)),28–33 and the dissociated N* then reacts with 3H* to form NH3. On the other hand, an alternative route of N2 association to form NH3 was also proposed.38,39 First principles calculations based on density functional theory (DFT) have proposed that the associative mechanism (eqn. (8) and (9)), in which the adsorbed
  reacts with protons and electrons to promote N2 bond cleavage, with subsequent formation of NH3 at the triple phase boundary (TPB) between the electrolyte, electrode, and gas phase (eqn (8)), can occur with cathodic polarization even at ambient temperature.38,39
Dissociative mechanism:
 | (4) |
 | (5) |
| H2 + 2* → 2H* | (6) |
| N* + 3H* → NH3 + 4* | (7) |
Associative mechanism:
| N2 + 3H+ + 3e− + * → NH3 + N* | (8) |
| N* + 3H+ + 3e− → NH3 + * | (9) |
Many researchers have investigated the electrochemical reduction of N2 to NH3 at high temperature (>500 °C) using a variety of catalysts including metals such as Fe,11 Pd,5 Ag,17 Pt,17 and AgPd,6,8–10 as well as cermet electrodes such as Ni–BaCe0.2Zr0.7Y0.1O3,15,16,24 Ni–BaCe0.9Y0.1O3,23 Ru-doped BaCe0.9Y0.1O3,22 Ru-doped La0.3Sr0.6TiO3,22 and K–Al–Fe–BaCe0.9Y0.1O3.21 Both noble metal6–10 and ceramic catalysts result in similar ammonia formation rates of approximately 10−9 mol s−1 cm−2.15,16,24 The atmosphere in the cathode is another important factor affecting the ammonia formation rate. With the supply of pure N2 to the cathode, some previous studies have shown that the mechanism of the electrochemical reduction of N2 is initiated by pumped H+ and dissociated N* reacting with H+ to form NH3.7,16,19 In addition, Kosaka et al. reported that the rate-determining step of N2 dissociation can be accelerated by cathodic polarization using a Ru-based catalyst.22 The hydrogen coverage surface at high applied voltage, however, hindered N2 molecule adsorption and NH3 formation.11,13,18–20,22–24
On the other hand, the ammonia electrochemical synthesis has also been investigated for the supply of a gaseous mixture of H2–N2 to the cathode.11,15,16,21,24 Generally, the ammonia formation rate in H2–N2 is higher than that in pure N2 because H2 in the cathode acts as an additional source of ammonia formation.11,21 In that case, the ammonia formation rate can be enhanced by the electrochemical promotion of catalyst (EPOC) effect (i.e., non-faradaic process), which promotes the electron donation/backdonation reaction by an applied voltage.11
In our previous study, we also reported that the electrolyte-supported cell of H2O–H2–Ar, Pt|BaCe0.9Y0.1O3 (BCY)|Al–K–Fe–BCY, N2 exhibited a low electrochemical ammonia formation rate. Nevertheless, when a gaseous mixture of 15% H2–85% N2 was supplied to the cathode side, there was a significant increase in the ammonia formation rate from 2.8 × 10⁻¹¹ to 6.7 × 10⁻¹⁰ mol s−1 cm−2, which was observed with cathodic polarization at 650 °C.21 However, for a gaseous mixture of H2–N2 in the cathode, it is unclear whether the electrochemical promotion is caused by a dissociative mechanism (i.e., non-faradaic process without charge–transfer reaction), which accelerates N2 dissociation on the Fe surface (eqn (5)), or a proton-assisted associative mechanism (i.e., faradaic process with charge-transfer reaction), which promotes the charge-transfer reaction of  at the TPB (eqn (8)).
In this study, the ammonia formation performance with cathodic polarization was examined using the following configuration of single cells: 3% H2O–20% H2–77% Ar, Pt|BCY| Fe-based catalysts, H2–N2. To investigate the electrochemical promotion of ammonia formation via either the dissociative or associative mechanism, a porous pure Fe cathode with a relatively short TPB length (the relevant reactions are governed by a two-phase boundary, i.e., the Fe surface) and 10 wt% Fe–BCY and 0.5 wt% W–10 wt% Fe–BCY cermet cathodes with a relatively long TPB were used, as shown in Table 1. First, by comparing the 10 wt% Fe–BCY cermet cathode (type A) with the porous pure Fe cathode (type B), the nature of the electrochemical promotion mechanism of ammonia formation was investigated. Second, a modified Fe–BCY cermet electrode, i.e., the same electrode structure as type A but with the addition of W (type A′), was investigated. The exchange current density for H2 evolution, i0,H2, was low, and it could suppress the hydrogen evolution reaction and reduce the current density with cathodic polarization because of the higher adsorption energy of W–H formation relative to that of Fe–H.40,41 Therefore, the effect of a low current density, i.e., low flux of pumped protons from the anode, on the electrochemical promotion of ammonia formation rate was also evaluated by comparing 10 wt% Fe–BCY (type A) and 0.5 wt% W–10% Fe–BCY (type A′: x wt% W–y wt% Fe–BCY cathodes, where x and y represent the weight ratios of W and Fe, indicated by xW–yFe–BCY hereafter).
| Cathode | Electrode structure and properties | |
|---|---|---|
| Type A | Fe–BCY | Cermet electrode with a relatively long TPB length and high i0,H2 |
| Type A′ | W–Fe–BCY | Cermet electrode with a relatively long TPB length and low i0,H2 |
| Type B | Fe | Porous Fe electrode with a relatively short TPB length and low i0,H2, active site: Fe surface |
Results and discussion
Characterization
Fig. 1 presents the X-ray diffraction (XRD) patterns of the as-prepared samples for 10Fe–BCY (type A), porous pure Fe (type B), and 0.5W–10Fe–BCY (type A′) cathodes on the BCY electrolyte. The single phase of Fe (cubic, Im![[3 with combining macron]](https://www.rsc.org/images/entities/char_0033_0304.gif) m, PDF#00-006-0696) and that of BCY originating from the BCY electrolyte appeared in all the samples. In the porous pure Fe cathode (type B), a partially oxidized Fe phase, Fe3O4, was observed due to the exposure of the sample to air. However, based on the result of the TG-DTA measurement (Fig. S1†), the porous pure Fe cathode catalyst can maintain a pure Fe phase at the operating temperature (550 °C). On the other hand, relevant peaks of W or W compounds were not detected because of the low amounts of W.
m, PDF#00-006-0696) and that of BCY originating from the BCY electrolyte appeared in all the samples. In the porous pure Fe cathode (type B), a partially oxidized Fe phase, Fe3O4, was observed due to the exposure of the sample to air. However, based on the result of the TG-DTA measurement (Fig. S1†), the porous pure Fe cathode catalyst can maintain a pure Fe phase at the operating temperature (550 °C). On the other hand, relevant peaks of W or W compounds were not detected because of the low amounts of W.
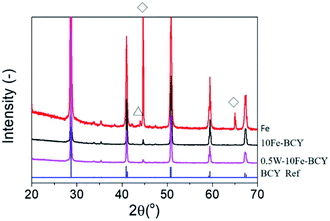 | ||
| Fig. 1 XRD patterns for the as-prepared samples of 10Fe–BCY (type A), 0.5W–10F–BCY (type A′), and Fe (type B). ◊: Fe, Δ:Fe3O4. BCY reference: PDF#01-070-1429. | ||
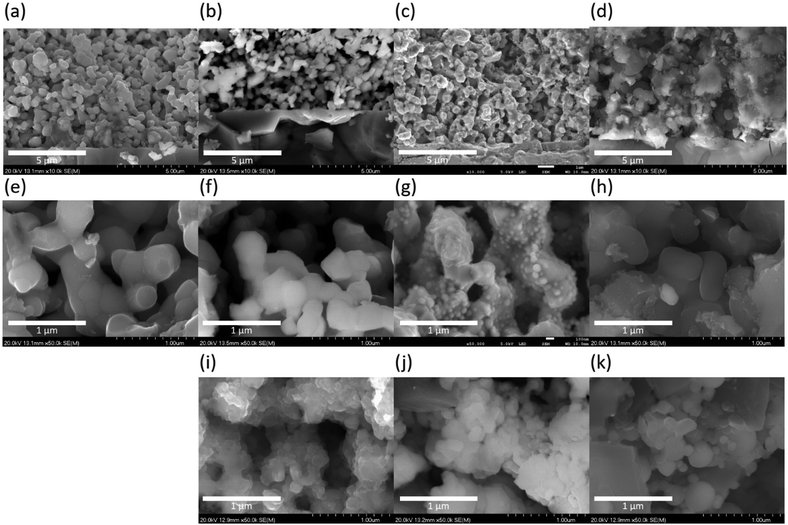
Fig. 2 shows the cross-sectional scanning electron microscopy (SEM) images of the three cathode catalysts. The size of BCY particles was around 300 nm in pure BCY, 10Fe–BCY, and 0.5W–10Fe–BCY electrodes. Although it is difficult to distinguish each position of Fe particles in the 10Fe–BCY cathode from Fig. 2f, the deposition of Fe particles on BZY can be observed from the TEM images (see the next section). In the 0.5W–10Fe–BCY cathode, Fe particles tend to aggregate on the BCY surface. In the porous pure Fe cathode, the size of Fe particles was around 200–400 nm. The thicknesses of the BCY and Fe porous cathodes were approximately 10–15 μm (see Fig. S2 in the ESI†). Fig. 2i–k correspond to the SEM cross-sectional images of the cathodes after the electrochemical measurements. The particle aggregation of around 50, 130, and 150 nm was observed in 10Fe–BCY, 0.5W–10Fe–BCY, and porous pure Fe cathodes, respectively.
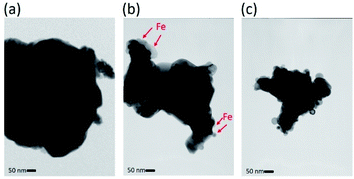
For further observation of the cathode structures of 10Fe–BCY and 0.5W–10Fe–BCY, transmission electron microscopy (TEM) was used to examine the detailed particle structures, as shown in Fig. 3. The TEM image of the pure porous BCY cathode showed that the BCY particle size was around 300 nm. After Fe or W–Fe infiltrated into BCY, small particles located on the BCY surface were observed in 10Fe–BCY and 0.5W–10Fe–BCY cathodes. The energy-dispersive X-ray spectroscopy (EDX) mapping of 0.5W–10Fe–BCY showed that the Fe signal around the BCY surface was detected as well as the Ce signal (Fig. 4). Judging from the TEM-EDX, we think that the small particles located on the BCY surface in Fig. 3b are Fe particles. However, because the W amount is too low to detect and the EDX peaks of W (Mα and Mβ edges) and Y (Lα edge) are overlapping, we could not confirm the exact W position.
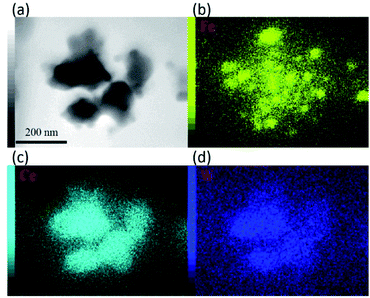 | ||
| Fig. 4 (a) TEM image of 0.5W–10Fe–BCY (type A′) and EDX mapping for the elements (b) Fe, (c) Ce, and (d) W. | ||
Electrochemical reaction of ammonia synthesis with different cathode structures
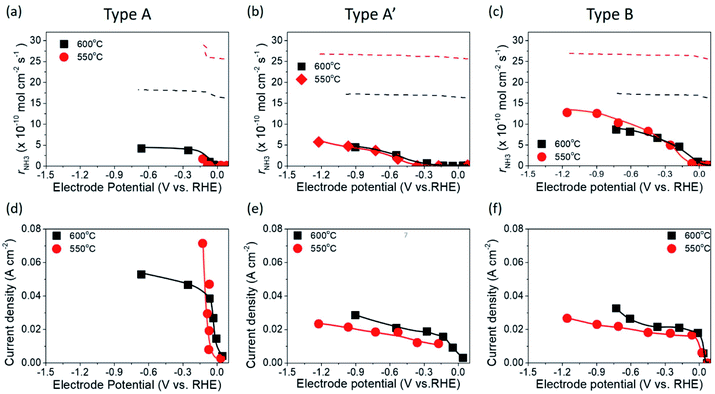
Fig. 5 shows the ammonia formation performance using 10Fe–BCY (type A), 0.5W–10Fe–BCY (type A′), and porous pure Fe (type B) cathodes in 10% H2–90% N2. The broken lines are the ammonia formation rates at equilibrium. The ammonia formation rates at equilibrium change with the electrode potential because H2 partial pressure in the cathode increased by the H2 evolution reaction (eqn (10)). Here, we assume that the current efficiency of H2 evolution reaction is 100%. Therefore, an increase in H2 partial pressure, ΔpH2, can be obtained by eqn (11).| 2H+ + 2e− → H2 | (10) |
 | (11) |
With W addition to 10Fe–BCY, the type A′ cell 0.5W–10Fe–BCY cathode exhibited a higher ammonia formation rate of 5.7 × 10⁻¹⁰ mol s−1 cm−2 at −1.2 V (137 μg h−1 mg−1 Fe) even at a lower operating temperature (550 °C) than that of the 10Fe–BCY cathode. In addition, current density for the type A′ (0.5W–10Fe–BCY) cathode, i.e., proton flux from the counter electrode (anode) to the working electrode (cathode), was reduced by approximately 40% in comparison with that of the type A (10Fe–BCY) cathode.
As for the exchange current density, the exchange current densities at 600 °C for type A (10Fe–BCY) and type A′ (0.5W–10Fe–BCY) were 0.037 and 0.014 A cm−2, respectively. The reason for the low exchange current densities for 0.5W–10Fe–BCY was due to the suppression of the hydrogen evolution reaction. Although the highest voltage of −1.5 V was applied for both the cathodes at 600 °C, the ammonia formation rates for both the cathodes were mostly the same, whereas 0.5W–10Fe–BCY had a lower current density than that of 10Fe–BCY. Therefore, the results suggest that the influence of applied voltage on ammonia formation is more significant than that of current density.
When using the type B cell with a porous pure Fe cathode, the ammonia formation rate increased with increasing cathodic polarization and reached 1.3 × 10⁻⁹ mol s−1 cm−2 (44.33 μg h−1 mg−1 Fe) at 550 °C, which was the best performance of these three cathodes. Because the type B porous pure Fe possessed a shorter TPB length than the type A 10Fe–BCY, a low current density of approximately 0.03 A cm−2 at around −1.2 V was observed. As for the exchange current density, the exchange current density at 600 °C for type B was 0.017 A cm−2, which was also lower than that for type A due to the shorter TPB length in type B.
The current efficiency ηCE (eqn (12)) and the fraction of obtained NH3 concentration to NH3 concentration at equilibrium XEqu (eqn (13)), using the 10Fe–BCY, 0.5W–10Fe–BCY, and porous pure Fe cathodes, were examined, as discussed in Section 3 in the ESI (Fig. S3†).
 | (12) |
 | (13) |
 | (14) |
The electrochemical ammonia synthesis involved the electrochemical synthesis of ammonia and hydrogen evolution reaction in parallel. According to Fig. S3,† the current efficiency for NH3 formation was below 2%, which implied that the hydrogen evolution reaction was more favourable (eqn (10)) in the electrochemical reaction of ammonia synthesis.
Obtained XEqu about 50% (equilibrant to 36.5 ppm NH3) in type B of porous pure Fe was higher than that of 26% in type A or type A′. The best performance for ammonia formation rate was achieved using the type B porous pure Fe cathode, which had a relatively shorter TPB length than that of type A or type A′ cermet electrodes.
Electrochemical reaction of ammonia synthesis at different H2 partial pressures
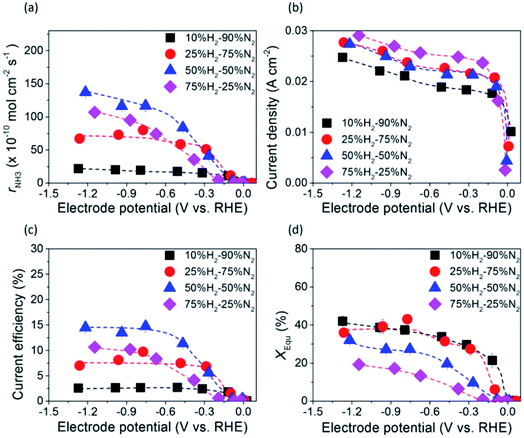
The dependence of ammonia formation rate on H2 partial pressure in the cathode was investigated using the type A 10Fe–BCY cathode, as shown in Fig. 6. The ammonia formation rate was improved upon increasing the H2 partial pressure in the cathode; however, the current densities were mostly similar, indicating that ammonia formation is mainly affected by the H2 reactant in the cathode. This result indicates that the ammonia formation rate has a positive correlation with H2 partial pressures in the cathode. On the basis of this result, the ammonia formation at different hydrogen partial pressures in the cathode (10–75% H2–90–25% N2 with 40 sccm) was examined using the type B porous pure Fe cathode, as shown in Fig. 7. With increasing H2 partial pressure in the cathode, the ammonia formation rate increased by 6 times from 2.2 × 10⁻⁹ mol s−1 cm−2 in 10% hydrogen to 1.4 × 10⁻⁸ mol s−1 cm−2 in 50% hydrogen at −1.2 V. The best performance of ammonia formation was obtained in 50% H2–50% N2 rather than at the nominal composition of 75% H2–25% N2 for ammonia formation. From the SEM image, the particle aggregation after the electrochemical reaction was observed, which caused the reduction of the surface area and the degradation of the catalyst. The degradation of the catalyst decreased the ammonia formation rate by 10–15% (Fig. S4†). Despite the degradation of the catalyst, the ammonia formation rate in 50% H2–50% N2 was still higher than that in 75% H2–25% N2.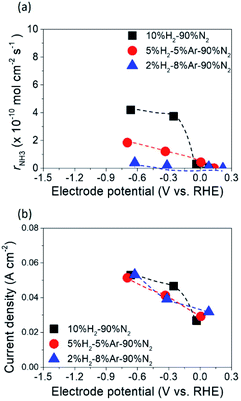 | ||
| Fig. 6 (a) Ammonia formation rates and (b) current densities obtained using the 10Fe–BCY cathode (type A) at 600 °C at different hydrogen partial pressures (pumped protons from the anode). | ||
Table S1† shows the observed ammonia partial pressure and theoretical ammonia partial pressures in the cathode at different ratios of H2 to N2. XEqu reached around 40% in 10% H2–90% N2, whereas it decreased to around 30% in 50% H2–50% N2 because the NH3 partial pressure in 50% H2–50% N2 was higher than that in 10% H2–90% N2.
The ammonia formation rate increased by about 220 times to 1.4 × 10⁻⁸ mol s−1 cm−2 at around −1.2 V compared with that at the rest potential. This result also confirms the conclusion that the ammonia formation rate has a strongly positive correlation with the H2 partial pressure in the cathode. To the best of our knowledge, this ammonia formation rate of 1.4 × 10⁻⁸ mol s−1 cm−2 was quite high compared with the reported values in other existing electrochemical ammonia syntheses under moderate or ambient pressure. The representative previous studies are shown in Fig. 8, and the details are shown in Table S2 in the ESI.†11,16,21,42,43 Furthermore, the ammonia formation rate normalized by weight reached 450 μg h−1 mg−1, which was much higher than those in other previous reports,11,21,24,42,43 because the weight of Fe catalyst of 0.7 mg in this study was much less than that in the previous reports. Notably, the ammonia formation rate of 450 μg mg−1 h−1 at 550 °C and 0.1 MPa is a similar level of performance to those of 250–976 μg mg−1 h−1 in the conventional Haber–Bosch process at 400 °C and 7–10 MPa with Fe-based catalysts.27 This result suggests that the Fe catalyst has significant performance in ammonia formation, and that Fe has the potential to be a cathode catalyst for ammonia electrochemical synthesis. To clarify the promotion of ammonia electrochemical synthesis using the Fe cathode catalyst, the reaction mechanism is discussed in the next section.
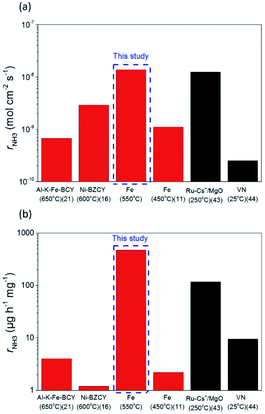 | ||
| Fig. 8 Ammonia formation rates, rNH3, were normalized by (a) area of electrode and (b) metal catalyst weight. The data in red and black were respectively obtained in H2–N2 and pure N2 atmospheres. | ||
Reaction mechanism
As described in the last section, our observations are summarized by the following four points: (1) The electrochemical promotion of ammonia formation was observed with cathodic polarization in a gaseous mixture of N2–H2 in the cathode, whereas a low ammonia formation rate (3 × 10⁻¹² to 1.7 × 10⁻¹¹ mol cm−2 s−1) in pure N2 even was detected upon an increase in the cathodic polarization for the type A cathode (Fig. S5†). (2) Infiltration of W into the Fe–BCY cermet electrode (type A′ cathode) improved the ammonia formation rate because of the suppression of the hydrogen formation reaction and high cathodic polarization. (3) The performance of ammonia formation rate using the type B (pure Fe) electrode was better than that using the type A and A′ cermet electrodes, although the TPB length in the type B cathode was short. (4) A strong correlation between the ammonia formation rate and hydrogen partial pressure in the cathode was observed. In this study, the highest ammonia formation rate, >1.4 × 10⁻⁸ mol s−1 cm−2, was observed when the porous pure Fe cathode was used.On the basis of the results, the details of the ammonia formation mechanism are discussed. In our system, both the dissociative mechanism (i.e., non-faradaic process without charge–transfer reaction) and proton-assisted associative mechanism (i.e., faradaic process with charge–transfer reaction) were possible routes for ammonia formation, as described in Table 2.
In the Haber–Bosch process, ammonia formation with an Fe-based catalyst is governed by a dissociative mechanism. The dissociative mechanism for ammonia formation on an iron catalyst has been extensively discussed in previous experimental and theoretical research.45–50 For example, Ertl's group discussed the potential energy for the synthesis of ammonia over a potassium-promoted Fe catalyst based on the dissociative mechanism.50 In addition, density functional theory (DFT) calculations were used to discuss a similar reaction mechanism.45,47 The rate-determining step in the dissociative mechanism was considered to be dissociative chemisorption of N2 on the Fe catalyst.28–30 N2 dissociation proceeded by electron donation from the Fe surface to the N2 orbital, weakening the bonding of N
![[triple bond, length as m-dash]](https://www.rsc.org/images/entities/char_e002.gif) N and thus promoting N2 cleavage directly (eqn R2 in Table 2). In addition, a previous study showed that alkali metal (K) addition causes electron transfer from the alkali metal to the Fe catalyst, elevating the Fermi level of Fe and then promoting the electron-backdonation reaction into N2
N and thus promoting N2 cleavage directly (eqn R2 in Table 2). In addition, a previous study showed that alkali metal (K) addition causes electron transfer from the alkali metal to the Fe catalyst, elevating the Fermi level of Fe and then promoting the electron-backdonation reaction into N2 and N2 dissociation.51
However, N2 dissociation cannot proceed easily at ambient temperature because of the insufficient energy to overcome the energy of N2 dissociation. Previous DFT studies have shown that the electrochemical reaction of ammonia formation is dominated by a proton-assisted associative mechanism rather than a dissociative mechanism.39 In the proton-assisted associative mechanism, protonation of adsorbed  proceeds to form NH3 and N* without direct N2 cleavage.
Generally, in SOFCs, the relevant charge–transfer reaction proceeds at the TPB. If ammonia formation was governed by the proton-assisted associative mechanism, then the type A (10Fe–BCY) and type A′ (0.5W–10Fe–BCY) cermet electrodes with relatively long TPB lengths should exhibit higher ammonia formation rates than the type B electrode. However, this hypothesis contradicts conclusion 3 stated above. In addition, according to conclusion 4 on the strong correlation between the ammonia formation rate and hydrogen partial pressure in the cathode, the ammonia formation process appears to be governed by the dissociative mechanism (eqn (4)–(7)) rather than by the proton-assisted associative mechanism (eqn. (8) and (9)). In the final section, we discuss the mechanism of enhancement of the N2 dissociation process on the Fe surface in terms of electrochemical promotion of the catalyst surface reaction.
Electrochemical promotion of catalyst effect and an effective double layer on the Fe catalyst
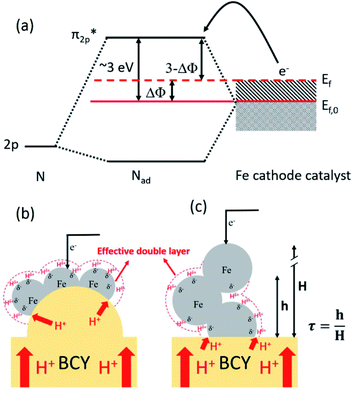
Based on the results in the last section, the improvement of ammonia formation rate via the dissociative mechanism is probably caused by the electrochemical promotion of catalyst (EPOC) effect. Vayenas et al. proposed an EPOC effect model with cathodic or anodic polarization, in which the work function of metal catalyst could be changed and an effective double layer in a gas–solid system could be formed via spillover of mobile ions originating from charge carriers in the electrolyte.52 An increase or a decrease in metal work function could promote the electron donation/backdonation reaction. In our present system, the effective double layer can form on the Fe catalyst surface via H+ spillover on the Fe surface, and the decrease in Fe work function can also promote electron backdonation, which can be induced by electron transfer from the Fe Fermi level to the N2 antibonding orbital of , as shown in Fig. 9.52 The EPOC effect can be described by eqn (15):52–56
 | (15) |
 dissociation (R2), which is a rate-determining step for the dissociative mechanism. It is accelerated by the electron backdonation reaction with cathodic polarization, as shown in Fig. 9a. On the other hand, the effective double layer on the Fe catalyst plays an important role in the electrochemical promotion of ammonia synthesis.
To support this hypothesis of the effective double layer, we conducted electrochemical ammonia synthesis using an yttria-stabilized zirconia (YSZ) electrolyte-based cell, which is an oxide ion conductor. The details of the experiment are described in the ESI (Section 7†). Using the cell composed of 20% H2–80% Ar, Pt|YSZ|10Fe-YSZ, 10% H2–90% N2, we did not observe any electrochemical promotion of the ammonia formation rate (Fig. S6†). This suggests that the formation of the effective double layer with protons in the cathode plays an important role in the promotion of the NH3 formation reaction, as well as the cathodic polarization. Therefore, the structure of the effective double layer is very important and those of type A and type B are discussed in the last section.
Estimation of the effective surface area and effective double layer
In the final section, we attempt to conduct an order-of-magnitude estimate of the effective surface area and discuss it through the comparison of type A (10Fe–BCY) and type B (pure Fe). According to the EPOC effect, the ammonia formation rate is proportional to the area of the reaction surface, i.e., the area of effective double layer, . Also, Si (i denotes A and B for type A and type B, respectively) is defined as the total area of Fe particles connected with a network structure of electrons. The details of the definition and calculation for
  , SA, and SB are shown in the ESI (Sections 8–10†).
To understand the proton diffusion length and the area of the effective double layer, we propose three assumptions. (1) Proton diffusion length on the Fe surface is adequately long. Thus, we can assume that the Fe particles of type A can be covered by protons because the proton can fully diffuse on the Fe particle surface of type A (the size of Fe particles on BCY in type A was around several tens of nanometers) and cover the Fe surface of type A to form an effective double layer (Fig. 9b). Therefore, the area of the effective double layer in type A,  , is equal to the effective surface area of Fe particles, SA (eqn (16)), as shown in Fig. 9b.
 | (16) |
(2) In type B, the proton diffusion length, h, should be less than or equal to the thickness of the porous pure Fe cathode, H. The proton diffusion length could be represented as eqn (17):
| h = H × τ | (17) |
 , can be represented by the effective surface area of Fe particles multiplied with τ in type B (eqn (18)).
 | (18) |
(3) Because the electrochemical reaction of ammonia formation in type A and type B was carried out using Fe-based catalysts and at the same H2 and N2 partial pressures, the reaction rate constants for type A and type B were the same. The relation between the ammonia formation rate and the area of the effective double layer can be simplified as eqn (19):
 | (19) |
Supposed that the average values of the sizes of Fe particles in type A and type B were 42 nm and 190 nm, respectively, the corresponding effective proton diffusion length h was around 1.03 μm (Fig. 9c), and the value of τ was about 0.08. Fig. S17† shows the details of the relationship among the effective proton diffusion length h, the size Fe particles in types A and B, and the porosity in type B. Therefore, the effective double layer can be formed on a part of the Fe electrode surface (1.03 μm distance from the BCY electrolyte). The details of the estimation procedure of the effective double layer and the relevant parameters are summarized in the ESI (Section 11†).
In conclusion, the present rough estimation of the effective surface area provides the following views: (I) protons diffusing from the electrolyte can migrate to form an effective double layer (proton diffusion length: submicron order), and the effective double layer in type B (pure Fe) spreads adequately on the Fe surface. (II) N2 dissociation will be enhanced on the effective double layer via electron backdonation with cathodic polarization; thus, the improvement in ammonia formation rate was observed in type B.
In our present study, the high ammonia formation rate in type B will be caused by the relatively large area of the effective double layer. Our findings will aid in designing new reactors for the electrochemical synthesis of ammonia. To further improve the ammonia formation rate, controlling the effective proton diffusion length in metal electrodes, designing relevant electrode structures, and reducing the operating temperature are particularly important. Design and optimization of the new reactor is our next challenge.
Conclusions
In this study, the ammonia formation rates of electrosynthesis using 10Fe–BCY, 0.5W–10Fe–BCY, and porous pure Fe cathodes were examined. The electrochemical promotion of ammonia formation in the three types of cathodes was dominated by the dissociative mechanism, with a smaller contribution by the proton-assisted associative mechanism.At 550 °C and 10% H2–90% N2 in the cathode, type A 10Fe–BCY, which had a relatively long TPB length, showed an ammonia formation rate of 4.2 × 10⁻¹⁰ mol cm−2 s−1, while type A′ 0.5W–10Fe–BCY reduced the current density by 40% in comparison with type A 10Fe–BCY, and it increased the ammonia formation rate to 5.7 × 10⁻¹⁰ mol cm−2 s−1. These results suggest that the reduction of current density and the increase in cathodic polarization can contribute to an improved ammonia formation rate and current efficiency. On the other hand, type B porous pure Fe, which had a relatively short TPB length, exhibited a higher ammonia formation rate of 1.3 × 10⁻⁹ mol cm−2 s−1 than those of types A and A′. The high ammonia formation rate was probably achieved by accelerating N2 dissociation on the Fe surface, i.e., dissociative mechanism, rather than that at the TPB via a proton-assisted associated mechanism with the charge-transfer reaction. Furthermore, with an increase in the H2 partial pressure to 50% in the cathode, a significantly high ammonia formation rate, 1.4 × 10⁻⁸ mol s−1 cm−2 (450 μg h−1 mg−1) at −1.2 V, was observed, which was one of the best performances in the world. The electrochemical promotion of ammonia formation rate, which is higher by ca. 220 times than that at the rest potential, will be caused by the EPOC effect rather than by the faradaic electrochemical process, i.e., the charge-transfer reaction at the TPB. The results suggest that the formation of an effective double layer on the Fe surface is very important for the ammonia formation process. Through the observations, the present work provides new strategies for designing efficient electrolysis cells for ammonia synthesis.
Experimental
Powder fabrication
BaCe0.9Y0.1O3 (BCY) powder was synthesized by the coprecipitation method using precursors of Ba(NO3)2 (99.99% purity; Kanto Chemical Co., Inc., Japan), Ce(NO3)3·6H2O (99.99% purity; Kanto Chemical Co., Inc., Japan), and Y(NO3)3·6H2O (99.99% purity; Kanto Chemical Co., Inc., Japan), which were stoichiometrically dissolved in water. (NH4)2(COO)2 (99.5% purity; Kanto Chemical Co. Inc., Japan), with concentration 1.5 times higher than the total cation concentration, was added as a precipitant. A white precipitate was obtained by filtering with suction filtration, and then dried at 80 °C for one night. The dried precipitate was precalcined at 800 °C and then calcined at 1200 °C in air to obtain BCY powder. Finally, fine BCY powder was obtained by ball milling. Fine Fe2O3 powder (99.9% purity; Fujifilm Wako Pure Chemical, Co., Inc., Japan) was also obtained by ball milling.Cell fabrication
Pelletized BCY was prepared by a uniaxial press and subsequent cold isostatic press. BCY powder (1.5 g) was first uniaxially pressed under 1 t cm−2, and then isostatically pressed under 180 MPa. Next, the BCY pellets were calcined at 1600 °C in air in a crucible with sacrificial powder of BCY to prevent intermixing and with vaporization of barium.A porous pure Fe cathode (ca. 0.5 mg) on the BCY electrolyte was prepared by the doctor-blade method. Fe2O3 powder was mixed with a slurry of α-terpineol (solvent) (98% purity; Fujifilm Wako Pure Chemical, Co., Inc., Japan), ethyl cellulose (binder) (48.0–49.5% ethoxy content; Kanto Chemical, Co., Inc., Japan), Nonion OP-83 RAT sorbitan sesquioleate (dispersant) (NOF, Co., Japan), dibutyl phthalate (plasticizer) (99.5% purity; Kanto Chemical, Co., Inc., Japan), and poly(methyl methacrylate) resin (pore formation) (99.9% purity; Tokyo Chemical Industry, Co., Ltd., Japan). The mixed slurry was then pasted onto the BCY electrolyte and calcined at 900 °C in air to obtain a porous pure Fe cathode. A porous BCY (ca. 1 mg) electrode on the BCY electrolyte was fabricated for the porous pure Fe cathode by the same process by using BCY powder.
In this paper, x wt% W–y wt% Fe–BCY cathodes (x and y are the weight ratios of W and Fe) are represented by xW–yFe–BCY. 10Fe–BCY and 0.5W–10Fe–BCY cathodes were fabricated by the impregnation method. Ammonium metatungstate (99.99% purity; Sigma-Aldrich, USA) and Fe(NO3)3·9H2O (99.99% purity; Wako Chemical Co., Inc., Japan) were stoichiometrically dissolved in water. The mixture solution was poured onto the BCY porous cathode, and then annealed at 700 °C to obtain the W–Fe–BCY cathode. The above processes were carried out several times until the amount of Fe and W reached an appropriate weight ratio. The 10Fe–BCY cathode was fabricated using the same process as W–Fe–BCY except that only iron nitrate was used as a precursor and a lower annealing temperature of 500 °C was applied. The Pt counter electrode (CE) and Pt reference electrode (RE) for all pellets were attached on the opposite side of the BCY electrolyte by the doctor-blade method. Finally, the obtained samples were then annealed at 900 °C for 3 h in 3% H2, as shown in Fig. S18.† Fig. S19† shows a schematic image of the three types of cathode structures.
Characterization
All samples were characterized using a scanning electron microscope (SEM, JEOL JSM-5600, Japan), an S4700 unit (Hitachi, Japan), an X-ray diffractometer (XRD, SmartLab, Rigaku, Japan), and a transmission electron microscope (TEM, JEOL JEM-1200EX, Japan and JEOL JEM-2010F, Japan). The Fe surface area in type B was detected by BET measurements (Nova 2200E, Quantachrome Instrument, USA).Ammonia electrochemical synthesis
A single cell was set in between two quartz tubes in a furnace. Pyrex glass rings were used to seal the quartz tubes at 900 °C. After sealing, Fe and Fe–W were reduced in 3% H2/Ar and a pure H2 atmosphere, respectively. Then, the operating temperature was lowered to 550–600 °C for ammonia electrosynthesis. Ammonia electrochemical synthesis was performed at different temperatures with a gaseous H2–N2 mixture introduced into the cathode and a gaseous 20% H2–3% H2O–77% Ar mixture introduced into the anode, as shown in Fig. S20.†AC impedance spectroscopic measurements from 1 to 106 Hz and potentiostatic measurements were performed using an Autolab PGSTAT128N (Metrohm Autolab B.V., Netherlands). In the electrochemical measurements using the three-electrode method, the electrode potential, E, was defined as follows:
 | (20) |
Ammonia formed in the cell was captured by allowing the outlet gas of the cathode side to flow into 0.01 mM H2SO4 solution, which was prepared by mixing ultrapure water (100 ml) (Autopure WT 100 compatible with Milli-Q, Yamato, Scientific Co., Ltd., Japan) and 0.005 M H2SO4 solution (0.1 ml) (Kanto Chemical, Co., Inc., Japan), for 5 min, and then the solution was analyzed by high performance ion chromatography (HPLC) (Extrema, Jasco, Japan).
A hydrogen pumping test was also conducted using a single cell of 20% H2–80% Ar, Pt|BCY| porous pure Fe, Ar. The current efficiency achieved 80–85% because the energy loss was probably caused by the leakage current (Fig. S21†).
The blank test, ammonia deformation reaction test, and reversible test for ammonia electrochemical synthesis are discussed in the ESI (Sections 13–15†), respectively. The stability of porous pure Fe was examined in 10% H2–90% N2 in the cathode. The details are discussed in the ESI (Section 16†).
Conflicts of interest
The authors declare no conflict of interest.Acknowledgements
The authors thank CREST, Japan Science and Technology Agency (JPMJCR1441) for financial support; the Materials Design and Characterization Laboratory, Institute for Solid State Physics, The University of Tokyo, Department of Chemical System Engineering, Faculty of Engineering, The University of Tokyo, and Advanced Characterization Nanotechnology Platform of the University of Tokyo, supported by “Nanotechnology Platform” of the Ministry of Education, Culture, Sports, Science and Technology (MEXT), Japan, for use of the SEM, XRD and TEM facilities; and the Medical Research Support Center, Research Institute of Medical Science, Nihon University School of Medicine, for use of the TEM facility.References
- J. W. Erisman, M. A. Sutton, J. Galloway, Z. Klimont and W. Winiwarter, Nat. Geosci., 2008, 1, 636–639 CrossRef CAS.
- W. Wang, J. M. Herreros, A. Tsolakis and A. P. E. York, Int. J. Hydrogen Energy, 2013, 38(23), 9907–9917 CrossRef CAS.
- M. Appl, Ammonia principles and industrial practice, Wiley-VCH, Germany, 1999 Search PubMed.
- S. Giddey, S. P. S. Badwal, C. Munnings and M. Dolan, ACS Sustainable Chem. Eng., 2017, 5(11), 10231–10239 CrossRef CAS.
- G. Marnellos and M. Stoukides, Science, 1998, 282, 98–100 CrossRef CAS.
- Y. Xie, J.-D. Wang, R.-Q. Liu, X.-T. Su, Z.-P. Sun and Z.-J. Li, Solid State Ionics, 2004, 168(1–2), 117–121 CrossRef CAS.
- Z.-J. Li, R.-Q. Liu, J.-D. Wang, Y.-H. Xie and F. Yue, J. Solid State Electrochem., 2005, 9(4), 201–204 CrossRef CAS.
- J.-D. Wang, Y.-H. Xie, Z.-F. Zhang, R.-Q. Liu and Z.-J. Li, Mater. Res. Bull., 2005, 40(8), 1294–1302 CrossRef CAS.
- Z. Li, R. Liu, Y. Xie, S. Feng and J. Wang, Solid State Ionics, 2005, 176(11–12), 1063–1066 CrossRef CAS.
- F. Zhang, Q. Yang, B. Pan, R. Xu, H. Wang and G. Ma, Mater. Lett., 2007, 61(19–20), 4144–4148 CrossRef CAS.
- M. Ouzounidou, A. Skodra, C. Kokkofitis and M. Stoukides, Solid State Ionics, 2007, 178(1–2), 153–159 CrossRef CAS.
- A. Skodra and M. Stoukides, Solid State Ionics, 2009, 180(23–25), 1332–1336 CrossRef CAS.
- W. B. Wang, X. B. Cao, W. J. Gao, F. Zhang, H. T. Wang and G. L. Ma, J. Membr. Sci., 2010, 360(1–2), 397–403 CrossRef CAS.
- I. A. Amar, R. Lan, C. T. G. Petit, V. Arrighi and S. Tao, Solid State Ionics, 2011, 182(1), 133–138 CrossRef CAS.
- E. Vasileiou, V. Kyriakou, I. Garagounis, A. Vourros, A. Manerbino, W. G. Coors and M. Stoukides, Top. Catal., 2015, 58(18–20), 1193–1201 CrossRef CAS.
- E. Vasileiou, V. Kyriakou, I. Garagounis, A. Vourros and M. Stoukides, Solid State Ionics, 2015, 275, 110–116 CrossRef CAS.
- D. S. Yun, J. H. Joo, J. H. Yu, H. C. Yoon, J.-N. Kim and C.-Y. Yoo, J. Power Sources, 2015, 284, 245–251 CrossRef CAS.
- J. Otomo, N. Noda and F. Kosaka, ECS Trans., 2015, 68(1), 2663–2670 CrossRef CAS.
- F. Kosaka, N. Noda, T. Nakamura and J. Otomo, J. Mater. Sci., 2016, 52(5), 2825–2835 CrossRef.
- S. Kishira, G. Qing, S. Suzu, R. Kikuchi, A. Takagaki and S. T. Oyama, Int. J. Hydrogen Energy, 2017, 42(43), 26843–26854 CrossRef CAS.
- F. Kosaka, T. Nakamura, A. Oikawa and J. Otomo, ACS Sustainable Chem. Eng., 2017, 5(11), 10439–10446 CrossRef CAS.
- F. Kosaka, T. Nakamura and J. Otomo, J. Electrochem. Soc., 2017, 164(13), F1323–F1330 CrossRef CAS.
- N. Simoda, Y. Kobayashi, Y. Kimura, G. Nakagawa and S. Satokawa, J. Ceram. Soc. Jpn., 2017, 125(4), 252–257 CrossRef.
- E. Vasileiou, V. Kyriakou, I. Garagounis, A. Vourros, A. Manerbino, W. G. Coors and M. Stoukides, Solid State Ionics, 2016, 288, 357–362 CrossRef CAS.
- G. Centi, G. Iaquaniello and S. Perathoner, BMC Chemical Engineering, 2019, 1, 5 CrossRef.
- J. N. Renner, L. F. Greenlee, A. M. Herring and K. E. Ayers, Electrochem. Soc. Interface, 2015, 24(2), 51–57 CrossRef CAS.
- H. Liu, Ammonia synthesis catalysts : innovation and practice, World Scientific, Singapore, 2013 Search PubMed.
- P. Stoltze and J. K. Nørskov, Phys. Rev. Lett., 1985, 55(22), 2502–2505 CrossRef CAS.
- P. Stoltze, Phys. Scr., 1987, 36, 824–864 CrossRef CAS.
- P. Stoltze and J. K. Nørskov, J. Vac. Sci. Technol., A, 1987, 5(4), 581–585 CrossRef CAS.
- J. A. Dumesic and A. A. Trevino, J. Catal., 1989, 116, 119–129 CrossRef CAS.
- B. Fastrup, J. Catal., 1997, 168, 235–244 CrossRef CAS.
- A. L. Garden and E. Skúlason, J. Phys. Chem. C, 2015, 119(47), 26554–26559 CrossRef CAS.
- C. D. Zeinalipour-Yazdi, J. S. J. Hargreaves and C. R. A. Catlow, J. Phys. Chem. C, 2015, 119(51), 28368–28376 CrossRef CAS.
- I. A. Amar, R. Lan, C. T. G. Petit and S. Tao, Int. J. Electrochem. Sci., 2015, 10, 3757–3766 CAS.
- J. Díez-Ramírez, V. Kyriakou, I. Garagounis, A. Vourros, E. Vasileiou, P. Sánchez, F. Dorado and M. Stoukides, ACS Sustainable Chem. Eng., 2017, 5(10), 8844–8851 CrossRef.
- C. D. Zeinalipour-Yazdi, J. S. J. Hargreaves and C. R. A. Catlow, J. Phys. Chem. C, 2018, 122(11), 6078–6082 CrossRef CAS.
- S. Back and Y. Jung, Phys. Chem. Chem. Phys., 2016, 18(13), 9161–9166 RSC.
- E. Skulason, T. Bligaard, S. Gudmundsdottir, F. Studt, J. Rossmeisl, F. Abild-Pedersen, T. Vegge, H. Jonsson and J. K. Norskov, Phys. Chem. Chem. Phys., 2012, 14(3), 1235–1245 RSC.
- S. Trasatti, J. Electroanal. Chem. Interfacial Electrochem., 1972, 39(1), 163–184 CrossRef CAS.
- J. K. Nørskov, T. Bligaard, A. Logadottir, J. R. Kitchin, J. G. Chen, S. Pandelov and U. Stimming, J. Electrochem. Soc., 2005, 152(3), J23 CrossRef.
- K. Imamura and J. Kubota, Sustainable Energy Fuels, 2019, 3(6), 1406–1417 RSC.
- X. Zhang, R. M. Kong, H. Du, L. Xia and F. Qu, Chem. Commun., 2018, 54(42), 5323–5325 RSC.
- P. Stoltze and J. K. Nørskov, J. Catal., 1988, 110, 1–10 CrossRef CAS.
- J. Qian, Q. An, A. Fortunelli, R. J. Nielsen and W. A. Goddard 3rd, J. Am. Chem. Soc., 2018, 140(20), 6288–6297 CrossRef CAS.
- K. C. Waugh, Catal. Today, 1999, 53, 161–176 CrossRef CAS.
- J. J. Mortensen, L. B. Hansen, B. Hammer and J. K. Nørskov, J. Catal., 1999, 182, 479–488 CrossRef CAS.
- D. R. Strongin, J. Carrazza, S. R. Bare and G. A. Somorjai, J. Catal., 1987, 103, 213–215 CrossRef CAS.
- G. A. Somorjai and N. Materer, Top. Catal., 1994, 1, 215–231 CrossRef CAS.
- J. R. Anderson and M. Boudart, Catalysis, Science and Technology, Springer-Verlag Berlin Heidelberg, 1983, vol. 4 Search PubMed.
- K.-I. Aika, H. Hori and A. Ozaki, J. Catal., 1972, 27, 424–431 CrossRef CAS.
- C. G. Vayenas and S. Brosda, Top. Catal., 2014, 57(14–16), 1287–1301 CrossRef CAS.
- D. Tsiplakides and C. G. Vayenas, J. Electrochem. Soc., 2001, 148(5), E189 CrossRef CAS.
- C. G. Vayenas, S. Bebelis and S. Ladas, Nature, 1990, 343, 625–627 CrossRef CAS.
- M. N. Tsampas, F. M. Sapountzi and C. G. Vayenas, Catal. Today, 2009, 146(3–4), 351–358 CrossRef CAS.
- C. G. Vayenas, S. Bebelis, C. Pliangos, S. Brosda, and D. Tsiplakides, Electrochemical Activation of Catalysis: Promotion, Electrochemical Promotion, and Metal-Support Interactions, Kluwer Academic/Plenum Publishers, 2001 Search PubMed.
Footnote |
| † Electronic supplementary information (ESI) available. See DOI: 10.1039/d0se01385d |
| This journal is © The Royal Society of Chemistry 2021 |

