Red blood cell hitchhiking enhances the accumulation of nano- and micro-particles in the constriction of a stenosed microvessel
Huilin
Ye
 a,
Zhiqiang
Shen
 a,
Mei
Wei
b and
Ying
Li
 *ac
*ac
aDepartment of Mechanical Engineering, University of Connecticut, 191 Auditorium Road, Unit 3139, Storrs, Connecticut 06269, USA. E-mail: yingli@engr.uconn.edu; Fax: +1 860 4865088; Tel: +1 860 4867110
bDepartment of Mechanical Engineering, Ohio University, Athens, OH 45701, USA
cPolymer Program, Institute of Materials Science, University of Connecticut, 97 North Eagleville Road, Unit 3136, Storrs, Connecticut 06269, USA
First published on 6th November 2020
Abstract
We investigate the circulation of nano- and micro-particles, including spherical particles and filamentous nanoworms, with red blood cells (RBCs) suspension in a constricted channel that mimics a stenosed microvessel. Through three-dimensional simulations using the immersed boundary-based Lattice Boltzmann method, the influence of channel geometries, such as the length and ratio of the constriction, on the accumulation of particles is systematically studied. Firstly, we find that the accumulation of spherical particles with 1 μm diameter in the constriction increases with the increases of both the length and ratio of the constriction. This is attributed to the interaction between spheres and RBCs. The RBCs “carry” the spheres and they accumulate inside the constriction together, due to the altered local hydrodynamics induced by the existence of the constriction. Secondly, nanoworms demonstrate higher accumulation than that of spheres inside the constriction, which is associated with the escape of nanoworms from RBC clusters and their accumulation near the wall of main channel. The accumulated near-wall nanoworms will eventually enter the constriction, thus enhancing their concentration inside the constriction. However, an exceptional case occurs in the case of constrictions with large ratio and long length. In such circumstances, the RBCs aggregate together tightly and concentrate at the center of the channel, which makes the nanoworms hardly able to escape from RBC clusters, leading to a similar accumulation of nanoworms and spheres inside the constriction. This study may provide theoretical guidance for the design of nano- and micro-particles for biomedical engineering applications, such as drug delivery systems for patients with stenosed microvessels.
1 Introduction
The study of vascular stenosis in blood vessels has attracted a large number of researchers due to its essential role in atherosclerosis in arterioles1 and microemboli in microvasculature.2 The treatments of microvascular stenosis focus on the infusion of thrombolytic drugs, which have achieved great success in animal models,3–7 including targeting thrombomodulin3 or a mutant plasminogen activator5 to circulating red blood cells (RBCs). However, the treatments in humans depend on systematic administration.8,9 Although many thrombolytic delivery systems have been designed to effectively and selectively target the sites of stenosis, the side-effects caused by freely administrated drugs throughout the body are inevitable.9–12To improve the delivery systems for the treatment of microvascular stenosis, extensive efforts have been made from biological and chemical aspects.13,14 Recently, researchers have endeavored to explore the physical approach in terms of fluid mechanics, since the local hydrodynamics are severely altered and exhibit different physical characteristics as a result of microvascular stenosis compared to those in normal vasculature.15–17 Based on these distinguishable characteristics, corresponding drug containers can be designed to target diseased sites with higher efficacy. For instance, Korin et al. have designed shear-activated nanotherapeutics for drug targeting to obstructed blood vessels, by using the high shear stress caused by vascular narrowing as a targeting mechanism.9 These shear-activated nanotherapeutics can maintain their compacted structure in normal blood flow and break up into nanoscale components under abnormally high fluid shear stress, thereby minimizing side effects while maximizing delivery efficacy. Nevertheless, due to the intricate structure of blood vasculature throughout the body and the complex dynamics of blood flow involving vast numbers of blood cells, the hydrodynamic motion of particles such as drug containers in stenosed microvasculature has not yet been fully explored.
Since blood flow plays an essential role during the circulation of particles in a blood vessel, extensive efforts have been devoted to the hemodynamics of blood.18–23 Compared to that in a large artery, the blood in the microvasculature behaves as a non-Newtonian fluid and manifests cellular characteristics such as Fahraeus–Lindqvist and Fahraeus effects.19,20 When circulating in the vessel, the red blood cells (RBCs) that occupy the major part of the blood vessel tend to migrate towards the center of the vessel, due to deformation-induced lift force.21 This migration of RBCs results in a typical distribution in microvasculature: a RBC-free layer (CFL) near the wall and a RBC-rich core at the center. The formation of CFL acts as a lubricant layer near the wall and is responsible for the Fahraeus–Lindqvist and Fahraeus effects, which refer to the reduction of apparent blood viscosity and the RBC's volume fraction with decreasing vessel diameter, respectively. Recently, it is found that both Fahraeus–Lindqvist and Fahraeus effects can be significantly affected by microvascular stenosis.24–27 For example, Vahidkhah et al. found that the Fahraeus–Lindqvist effect was largely enhanced as the apparent viscosity of blood increased by several fold, by virtue of the asymmetric distribution of RBCs in stenosed microvasculature.24 Moreover, the hemodynamics in stenosed microvasculature are studied through investigating the RBC's volume fraction,25 membrane stiffness, shape,26 and aggregation.27
Based on the findings of hemodynamics in stenosed microvasculature, the hydrodynamic motion of the immersed particles is further studied with the applications to design effective drug containers for the treatment of stenosis.9,10,28–30 Bacher et al. found, through three-dimensional simulations, that rigid microparticles circulating in the constricted channel will concentrate in front of the constriction, which may have critical physiological consequences such as the formation of microthrombi. Therefore, the clustering of microparticles can be applied to drug containers that deposited at the site of stenosis.9–11 Furthermore, since the fluid shear stress can be increased locally by one to two orders of magnitude in the constricted region, the drug containers can be designed to break up into nanoscale components that help mitigate the stenosis when exposed to high-level fluid stress. This system, from circulation along with blood flow, concentrating in front of the constriction to finally releasing drug components is called a shear-activated system.10 With the lenticular vesicles as drug containers, Holme et al. found that the vesicles were stable under static conditions and released their contents under elevated shear stress.10 Utilizing this unique property, they designed a shear-stress sensitive drug delivery system for the treatment of stenosis.
Apart from the local hydrodynamics, the RBC hitchhiking phenomenon opens a new avenue of exploration for drug delivery systems (DDS).3–7,31–36 The RBC exhibits great potential to introduce unprecedented changes in pharmacokinetics, pharmacodynamics, and immunogenicity. The drugs can be loaded into RBC either via encapsulation or surface coupling, depending on the target applications. For instance, Brenner et al.32 reported that when the nanocarriers loaded with drugs were adsorbed into RBC and then entered the blood stream through intravascular injection, the liposome uptake in the first downstream organ, the lungs, was found to increase by 40-fold compared with that of freely administrated nanocarriers. Additionally, RBC hitchhiking has been applied to anti-thrombotic drug delivery. It is found that after targeting thrombomodulin to the circulating RBC, the pharmacokinetics and antithrombotic effects are improved without increasing bleeding in mouse models.3 Also, directly targeting a mutant plasminogen activator to circulating RBCs can remarkably prolong the intravascular circulation and fibrinolytic activity.5 These studies reveal that RBC hitchhiking is a clinically translatable technology to augment DDS in lung disease, thrombosis, and several other diseases.
Nevertheless, the geometry of stenosis should also influence the motion of particles in the stenosed microvasculature. Although many studies have made efforts to understand the effects of stenosis on RBC motion,37,38 platelet motion and thrombus formation,39,40 the investigation of the effect of stenosis geometry is still limited. For example, recently, Carboni et al. conducted a series of experiments to understand the margination of micro-particles with a diameter of 2.11 μm in a constricted microfluidic channel with different occlusions, constriction lengths, and eccentricities.30 They found that the margination of micro-particle-migration towards the channel wall increased with increasing occlusion and length of constriction. However, due to the limitations in tracking RBCs and particles with low spatial and temporal resolutions, the underlying mechanisms remain to be explored in detail. Inspired by this experimental work, we systematically study the geometrical effects, including constriction length and ratio, on the circulation of nano- and micro-particles in the blood flow. Furthermore, we consider two typical particle shapes: spheres and filamentous nanoworms. The RBC hitchhiking phenomenon is also observed. We find the distribution of spheres in the flow direction follows that of RBCs: dipping before and after the constriction while remaining high inside the constriction. The accumulation inside the constriction is found to increase with the increment of both constriction length and ratio. By comparing the distributions in the flow and radial directions, we find nanoworms exhibit higher accumulation than do spheres inside the constriction. This is related to the escape of nanoworms from RBC clusters and subsequent accumulation near the wall. However, this rationale cannot be applied to the case of severe a constriction with long length, in which the RBCs concentrate at the center of channel and aggregate tightly so that the nanoworms can no longer penetrate them. Therefore, the nanoworms show the same distribution as spheres in this scenario.
This paper is organized as follows. The first part describes the computational system that we adopt to model the microvascular stenosis and corresponding computational methods including fluid, RBC and particle models. In the results and discussion part, we first demonstrate the distribution of spheres in different cases, in which the geometry of the constriction varies. Then we compare the distributions between nanoworms and spheres in detail. This is followed by a detailed discussion to explain the difference of distributions between these two kinds of particles. Lastly, we conclude this study with some final remarks.
2 Computational method
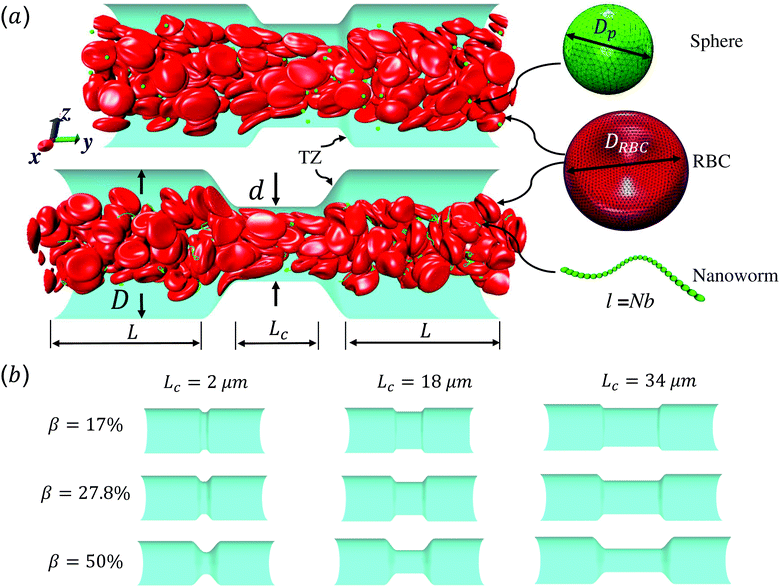
Fig. 1 shows the computational model adopted in the present work to study the circulation of particles, including spherical micro-particles (spheres) and nanoworms in a constricted channel that mimics stenosed microvasculature. The blood plasma is considered as a Newtonian fluid, and the flow is regarded as Stokes flow, due to the extremely small Reynolds number (∼10−5–10−3) in microcirculation. To represent realistic blood flow, the existence of red blood cells (RBCs) is explicitly accounted for. The inclusion and modeling of RBCs play essential roles, because nearly 45% of the volume fraction of the blood vessel is occupied by RBCs. Whereas the other components like white blood cells and platelets are ignored due to their small volumetric contributions (∼1%). In addition, the motion of particles dispersed among RBCs and the interaction between particles and RBCs are taken into consideration. Combining these aspects, the circulation of particles in blood flow is considered to be fully resolved.Here, we study the effect of constriction geometry on the circulation of particles in blood vessels. The blood vessel is modeled as a cylindrical channel with a constricted part, as presented in Fig. 1(a). Periodic boundary condition is applied along the flow direction (y-direction). The length and diameter of the two main channels are fixed at L = 36 μm and D = 18 μm respectively. The constriction is characterized by the constriction length (CL) Lc and constriction ratio (CR)  , where d is the diameter of the constriction. Three CLs Lc = 2, 18 and 34 μm and three CRs β = 17%, 27.8% and 50% are examined as shown in Fig. 1(b). The two main channels and the constriction are linked through a transition zone (TZ). To have a smooth transition, the diameter of this cone-like zone follows a third-order polynomial with coefficients as functions of Lc and β. Specifically, the first order derivative of the polynomial at the two ends (linking points between the main channel and constriction) are 0. To simplify this comparison, we fix the hematocrit (volume fraction of RBCs) Ht = 20% (in the human body's microvasculature network, the hematocrit is within the range 20–40%41) such that the number of RBCs varies from 147 to 195 according to specific geometries of constriction. In addition, 96 particles (spheres or nanoworms) are randomly placed among RBCs in the blood flow, which is adequate for statistical analysis. The diameter of the spherical particles ranges from 1 μm to 3 μm and the length of the nanoworms is fixed at l = 8 μm. The nanoworm is assumed inextensible and here we only consider a semi-flexible nanoworm with a bending stiffness as shown in Table 1. We assume the flow is driven by a constant pressure gradient between inlet and outlet of the channel. This assumption is based on the fact that for a specific part of the blood vessel, the pressures at the inlet and outlet should not be changed, since the blood is pumped by the heart beating at a specific rate, which is not relevant to the shape of the constriction formed within this part of blood vessel. To model the pressure-driven blood flow, we apply a spatially constant body force that mimics an external pressure gradient in the flow direction. The magnitude of the body force is controlled to keep the wall shear rate in the main channel in the order of 1000 s−1.
| Parameters | Simulation | Physical | Ref. |
|---|---|---|---|
| RBC diameter (D0) | 32.0 | 8 × 10⁻⁶ m | 55 |
| RBC shear modulus (μr) | 0.01 | 6.3 × 10⁻⁶ N m−1 | 56 |
| Energy scale (kBT) | 1.1 × 10⁻⁴ | 4.14 × 10⁻²¹ N m | — |
| Viscosity of fluid (η) | 0.167 | 0.0012 Pa s | — |
| Area constant (ka) | 0.0075 | 4.72 × 10⁻⁶ N m−1 | 50 |
| Local area constant (kd) | 0.367 | 2.31 × 10⁻⁴ N m−1 | 50 |
| Volume constant (kv) | 0.096 | 249 N m−2 | 50 |
| RBC bending constant (kb) | 0.013 | 5 × 10⁻¹⁹ N m | 50 |
| Nanoworm stretching constant (Kps) | 1.0 | 6.3 × 10⁻⁴ N m−1 | 51 |
| Nanoworm bending constant (κ) | 5.5 × 10⁻³ | 2.07 × 10⁻¹⁹ N m | 51 |
| Sphere diameter (sphere D0) | 4.0–12 | 1–3 × 10⁻⁶ m | — |
| Sphere shear modulus (μr) | 1.0 | 6.3 × 10⁻⁴ N m−1 | 51 and 54 |
| Sphere area constant (ka) | 0.075 | 4.72 × 10⁻⁵ N m−1 | 51 and 54 |
| Sphere local area constant (kd) | 3.67 | 2.31 × 10⁻³ N m−1 | 51 and 54 |
| Sphere volume constant (kv) | 0.96 | 2490 N m−2 | 51 and 54 |
| Sphere bending constant (kb) | 0.13 | 5 × 10⁻¹⁸ N m | 51 and 54 |
| Morse energy well width (β) | 0.96 | 3.84 μm−1 | 53 and 57 |
| Equilibrium distance (r0) | 2.0 | 0.5 μm | 53 and 57 |
| Morse cutoff distance (rc) | 6.0 | 1.5 μm | 53 and 57 |
| LJ depth of well (ε) | 1.1 × 10⁻⁴ | 4.14 × 10⁻²¹ N m | 51 and 54 |
| LJ zero potential distance (σ) | 2.0 | 0.5 μm | 51 and 54 |
| LJ cutoff distance (rLJ) | 2.24 | 0.56 μm | 51 and 54 |
2.1 Lattice Boltzmann method for blood flow
The incompressible flow used to model the blood plasma is governed by the continuity equation and the Navier–Stokes equation (NSE), which can be expressed as| ∇·u = 0, | (1) |
 | (2) |
 | (3) |
The advance of fi(x,t) in the above equation is split into two processes: streaming and collision. In the streaming process, the L.H.S. of eqn (3) is discretized as fi(x + ei,t + 1) − fi(x,t), in which the fi(x,t) updates in both time and spatial spaces. In the collision process that corresponds to the term  in the R.H.S of eqn (3), the particle residing at (x,t) relaxes towards its equilibrium state through collision behavior. Many collision models can be chosen, and here we adopt the most popular and simplest Bhatnagar–Gross–Krook (BGK) scheme,44 in which only one parameter-relaxation time τ is controlled. The last term Fi represents the external forcing term. In the simulation, D3Q19 model is used, which means that each point in the three-dimensional Eulerian system has 19 lattice velocities with different directions.44 The possible discrete velocities are
 | (4) |
The equilibrium distribution function feqi(x,t) in LBM can be approximated by Maxwell distribution and written as
 | (5) |
 is the sound speed, and Δx and Δt are spatial and temporal discretization sizes, respectively. The dynamic viscosity in NSE can be expressed using variables in LBM as
 | (6) |
The external forcing term can be discretized by the form45
 | (7) |
After each time step, fi in the whole domain are collected and we can calculate the fluid density and momentum according to the relations:
 | (8) |
2.2 Coarse-grained model for RBC and particles
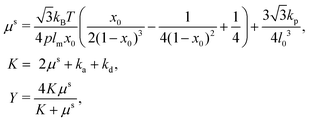
As shown in Fig. 1, both the RBC and particles (sphere and nanoworm) are modeled by coarse-grained method, in which the RBC and particles are considered as point systems linked with specific patterns, e.g., triangular or linear. The RBC is represented by a two-dimensional liquid-filled membrane immersed in the fluid. The initial shape of RBC is set as biconcave with shape function | (9) |
 | (10) |
 | (11) |
 | (12) |
 | (13) |
 | (14) |
 | (15) |
The sphere also adopts the same settings with RBC. The rigidity of the sphere is fulfilled by enlarging the spring constants in the potential functions. The coefficients involved in the potential functions for RBC are increased by one order. In particular, the shear modulus is two orders higher for the sphere. Additionally, 2% inflation of the volume for the sphere is made to generate pre-tension in the membrane network, which makes the sphere barely to deform. The nanoworm is described by a polymer chain with beads connected by harmonic springs. A linear spring and an angle spring are adopted to characterize the stretching and bending of the nanoworm, respectively.
| Unstretching = kps(l − l0)2, Unbending = κ(θ − θ0)2, | (16) |
In addition to the above potentials, inter-molecular interactions among RBCs, and between RBCs and particles, should be employed. The Morse potential has been extensively used to model the interaction among RBCs.52,53 It has the form Umorse = D0[e−2β(r−r0) − 2e−β(r−r0)], r < rc. D0 represents the energy well depth and β controls the width of the potential well, r is the distance between two points and r0 is the equilibrium distance, rc is the cutoff distance. For the interaction between RBC and particles or among particles, a short-range and pure repulsive Lennard-Jones (LJ) potential  is introduced to prevent the overlapping, ε and σ are depth of the well and zero potential distance, respectively. All the coefficients used in the current work are listed in Table 1. Among those, the coefficients associated with the model of RBC, e.g., shear modulus and Morse potential, are provided in ref. 50 and further validated in our previous work.47 The parameters introduced to maintain the rigidity of sphere are also verified in ref. 54, in which the deformation of the sphere is negligible. The LJ potential coefficients are chosen to prevent the overlapping of particles without intrusion of the interaction between particles, as only the repulsive part is applied.
2.3 Coupling of fluid and coarse-grained models: immersed boundary method
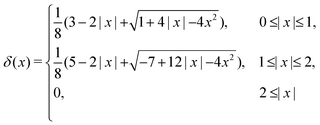
To reflect the existence of RBCs and particles immersed in a fluid flow, the immersed boundary method (IBM) is used to couple the coarse-grained model with the fluid flow. The IBM was first proposed by Peskin to study blood flow around the heart valves,58,59 and was then extensively utilized to study fluid–structure interaction problems.47,57,60–64 In IBM, the coupling is implemented by velocity interpolation and force spreading at the interface between coarse-grained networks and fluid meshes. There exist two coordinate systems: Lagrangian and Eulerian systems which describe the coarse-grained structure and the fluid flow, respectively. The Eulerian system is fixed and the Lagrangian system can move freely on top of the Eulerian system. The basic idea of IBM is to ensure the no-slip boundary condition at the interface. It requires the structures (RBCs or particles) to move with the same velocity as the ambient fluid. And conversely, the force obtained from the coarse-grained model should be spread to the nearby Eulerian fluid meshes through interpolation, which will be accepted by LBM as an external force term. We assume the Eulerian coordinates x and Lagrangian coordinates s, then the structure position can be expressed as X(s,t). The no-slip boundary condition says | (17) |
 | (18) |
 | (19) |
This stencil involves 64 fluid nodes, which has demonstrated stability and fewer artifacts,59,65 in comparison to the 2-points stencil with 8 fluid nodes. The force ffsi(x,t) is then utilized as a body force in the fluid solver. It is necessary to use the same interpolation function to obtain the velocities of the structure on the moving boundary through
 | (20) |
It should be noted that the channel wall is also considered as a stationary immersed boundary in the simulations. This fluid–structure interaction (FSI) computational framework has been validated by our previous studies.47,54,64 For example, Ye et al.47 validated the coarse-grained model of RBC together with the dynamics of a single RBC in a simple shear flow. Also, the rheology of RBCs inside a straight tube was investigated by Ye et al.64 and good consistency with previous experiments and simulations was found, such as Fahraeus–Lindqvist and Fahraeus effects. These benchmarks confirm that our FSI computational framework is accurate enough to study the circulation of particles in RBC suspension.
3 Results and discussion
The circulation of spheres with diameter 1 μm is first studied for different constriction geometries. Then we compare the distributions in the channel between nanoworms and spheres. The distribution of particles (spheres or nanoworms) ΦNP is quantified in two directions: axial and radial directions and defined as ΦNP = 〈ρ(s,t)〉, where ρ(s,t) is the number density, and s denotes either radial or axial direction. The channel along the s direction is split into small identical bins with size δs, then we count the number of particles with the center of mass locating inside these bins and denote it as nNP. Therefore, we can calculate , where V is the volume of the bin. The ensemble of number density ρ(s,t) is averaged over the steady states.
3.1 Circulation of spheres in constricted channel
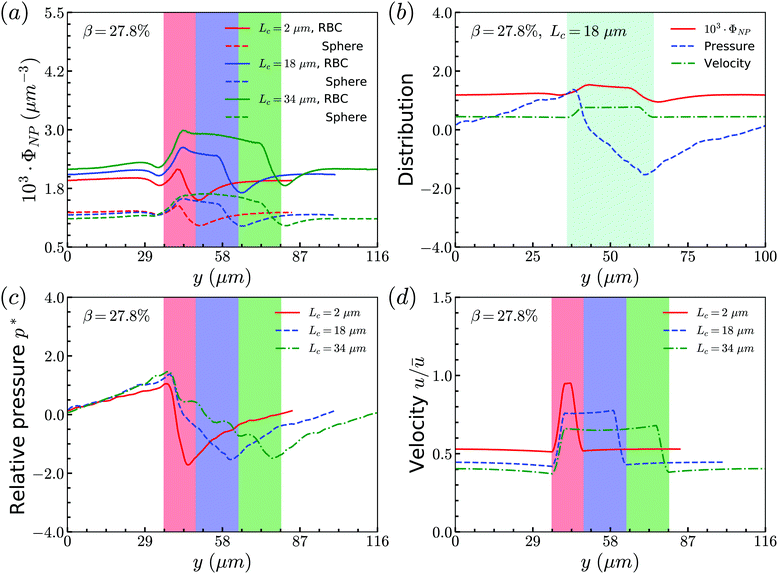
To examine effects of the constriction geometry on the circulation of spheres, the axial distribution (flow direction, y−) is investigated for constrictions with different CLs and CRs. Firstly, we fix the CR at β = 27.8% and systematically vary the CL. The axial distributions of spheres under three different CLs are shown in Fig. 2(a). The shadow regions represent the constriction including the transition zones. The axial distribution of spheres in a straight channel with length of 2L is also provided for comparison. It is found that the distribution of spheres in a straight channel is uniform, which is expected as we take the averaged value in the steady state. However, in the constricted channel, different distributions of spheres are observed in both main channel and constriction. It presents uniform distribution in the main channel as well as that in straight channel, while complex configuration of distribution is illustrated both inside and near the constriction. When the uniform distribution in the main channel approaches the entrance of the constriction, it continuously decreases. And eventually, there exists a dip in the distribution at the entrance of the constriction (∼y = 36 μm). It then continues to increase to a peak after entering the constriction. Fig. 2(a) reflects the averaged distribution of spheres. In the middle of the constriction, there is a small decrease of the distribution after the peak. However, when it comes to the rear of the constriction, the distribution dramatically decreases to the minimum at the outlet of the constriction. After leaving the constriction, the distribution gradually recovers towards the uniform distribution in the main channel. Although all the cases with different CLs demonstrate the same tendency that the distribution has a peak inside the constriction near the entrance, and two valleys at the entrance and outlet, the peak value and distribution inside the constriction vary with the CLs. We find that both the peak value and the overall distribution increase with the increment of Lc. However, the value of the two valleys are almost the same for all different CLs. Because the total number of spheres inside the channel is fixed, the increment of Lc will increase the size of the channel and lead to a lower uniform distribution of spheres in the main channels.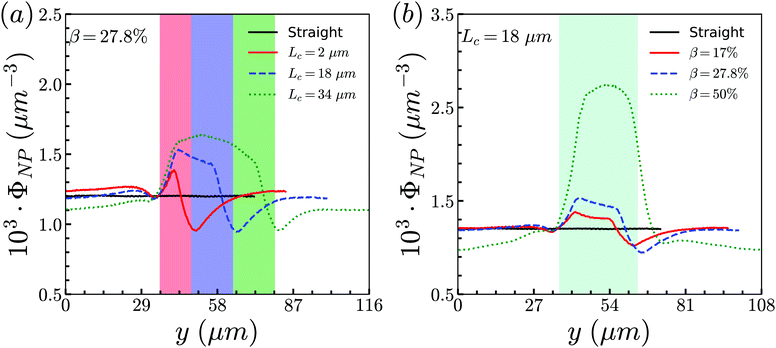 | ||
| Fig. 2 Distribution of spheres in constricted channel with different geometries: (a) length effect (CR is fixed at β = 27.8%); and (b) ratio effect (CL is fixed at Lc = 18 μm). | ||
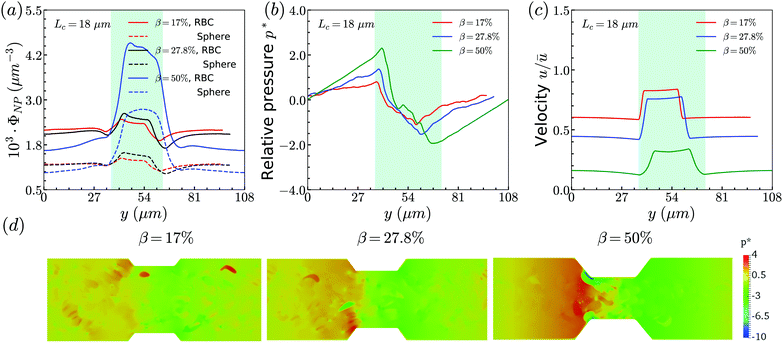
Besides, the effect of CR is further investigated by fixing the CL at Lc = 18 μm and varying the CR from 17% to 50%. Fig. 2(b) presents the results of the distribution of spheres under the constricted channel with different CRs. The shadow region represents the constriction including two transition zones with β = 27.8%. Note that the transition zones for different constrictions will be different, since the same polynomial function is applied for the transition, while the radii of the constrictions are different. Therefore, it is obvious that the valleys at the outlet are slightly different in Fig. 2(b). All the cases show the same pattern of sphere distribution along the channel: one peak inside the constriction near the entrance, and two valleys at the entrance and outlet. However, both the peak value and the overall distribution of ΦNP are found to increase with the increment of β. In particular, ΦNP increases significantly for the case β = 50%. Also, as the total number of particles is fixed, the high distribution in the constriction results in the significant reduction of distribution in main channels for the larger β.
To illustrate how the distribution of spheres depends on the geometry of constriction, two aspects are examined: RBC's distribution and flow field. Note that the spheres are surrounded by many RBCs that also circulate along with the fluid flow. The interactions between RBCs and spheres should influence the motion of spheres. In addition, the profile of the Poiseuille flow in the normal vessel is severely altered due to the existence of constriction. The perturbation of the local flow properties, such as velocity and pressure, may affect the distribution of spheres.
Firstly, the cases of channels with different CLs (β = 27.8% and Lc = 2, 18, and 34 μm) are studied. The distribution of RBCs in the flow is obtained by the same statistical method as that used for spheres, and the results are presented in Fig. 3(a) together with those of spheres. It is found that, for the same case with specific CL, the RBCs and spheres have the same distribution tendency. Due to the smaller size of spheres (Dp = 1 μm) compared to that of RBCs (DRBC = 8 μm), the interaction between spheres and RBCs has a remarkable influence on the motion of spheres, while it has a negligible effect on the motion of RBCs. Therefore, the same tendency presents that the distribution of spheres along the channel is highly dependent on that of RBCs. Instead of examining spheres, we focus on the effects of constriction geometries on the distribution of RBCs.
The distribution of RBCs is confined by the altered flow due to the existence of constriction. The velocity and pressure along the flow direction are also shown in Fig. 3(b) for the case β = 27.8%, Lc = 18 μm. The relative pressure is defined as  , where py represents the pressure at the point with coordinate y in the flow direction, Np is the number of points at the cross-section with coordinate y, and
 ![[p with combining macron]](https://www.rsc.org/images/entities/i_char_0070_0304.gif) is the averaged pressure of the flow in the corresponding straight channel. The velocity along the y direction is defined as the averaged velocity at the position with coordinate y, and ū is the averaged velocity of the flow in the corresponding straight channel. We find that the pressure and velocity profiles have the same pattern as those without RBCs and particles inside the channel presented by ref. 29. Due to the mass conservation of the flow, the compression in radial direction will be compensated by the axial acceleration of flow. It results in the faster movement of RBCs that locate at the center of the channel, and thus leads to the larger distance between RBCs inside the constriction and those in the main channel. The depletion of RBCs is characterized by the dip of RBC distribution at the entrance of constriction. Inside the constriction, the pressure quickly reaches a peak due to the accumulation of RBCs at the location near the entrance. Whereas, the effect of the acceleration of the velocity, inside the constriction, is compensated by the reduced radius of the channel, and the corresponding velocity distribution approximately reaches a plateau.
is the averaged pressure of the flow in the corresponding straight channel. The velocity along the y direction is defined as the averaged velocity at the position with coordinate y, and ū is the averaged velocity of the flow in the corresponding straight channel. We find that the pressure and velocity profiles have the same pattern as those without RBCs and particles inside the channel presented by ref. 29. Due to the mass conservation of the flow, the compression in radial direction will be compensated by the axial acceleration of flow. It results in the faster movement of RBCs that locate at the center of the channel, and thus leads to the larger distance between RBCs inside the constriction and those in the main channel. The depletion of RBCs is characterized by the dip of RBC distribution at the entrance of constriction. Inside the constriction, the pressure quickly reaches a peak due to the accumulation of RBCs at the location near the entrance. Whereas, the effect of the acceleration of the velocity, inside the constriction, is compensated by the reduced radius of the channel, and the corresponding velocity distribution approximately reaches a plateau.
When approaching the outlet of the constriction, the distribution of velocity decreases to a valley and then restores the same distribution in the main channel. It also results in a reduction of the RBC distribution near the outlet and recovery of the uniform distribution in the main channel. The corresponding distribution of the pressure follows that of RBCs closely. The slight asymmetry of the distribution for RBCs at the entrance and outlet of the constriction may be relevant to the deformation of RBCs, which is also observed in ref. 24, 28 and 29. We further plot the pressure and velocity distributions for the channels with different CLs in Fig. 3(c) and (d), respectively. From the pressure distribution, we can see that if the constriction length Lc increases from 2 μm to 18 μm, the pressure at the entrance of the constriction increases. This is caused by the larger concentration of RBCs at the entrance of the constriction. However, further increase of Lc cannot change the pressure due to the saturation of RBCs accumulated at the entrance of the constriction. Besides, an opposite effect is found on the velocity profile: the larger concentration of RBCs means more RBCs block the flow and results in a lower velocity.
Secondly, we examine the CR effect on the relationship of distributions between RBCs and spheres. From Fig. 4(a), we find the same effect as that of CL. The distribution of spheres follows the same trend as that of RBCs. In addition, the pressure and velocity distributions are presented in Fig. 4(b) and (c), respectively. With the increment of CR, the peak of the pressure occurs at the entrance of the constriction is higher, while the valley of the pressure happens at the outlet of the constriction is lower. For the velocity, the higher CR leads to the lower plateau of velocity inside the constriction. To have a better understanding of pressure distribution along the flow direction, we take the averaged value of pressure in axial direction and show them in Fig. 4(d) for channels with different CRs. It is found that the pressure at the entrance of constriction with higher CR is significantly higher than those of the constrictions with lower CRs.
To summarize the above results, we find that the flow in the channel with different geometries of constrictions will determine the distribution of RBCs. And the interaction between RBCs and spheres will alter the local flow properties around the spheres. All of them lead to the same distributions between spheres and RBCs.
3.2 Comparison between spheres and nanoworms
From the above simulations, we observe that spheres behave like passive particles and circulate along with RBCs in the channel. To confirm whether this observation also applies to the nanoparticles (NPs) with other shapes, such as filamentous nanoworms, we compare the distributions of spheres and nanoworms in a constricted channel with different CLs and CRs.Firstly, we study the distribution of nanoworms in the channels with different CLs, and compare them with those of spheres. The results are given in the Fig. 5. It is found that, for the short constriction (Lc = 2 μm, Fig. 5 (a)), the accumulation of nanoworms is slightly higher than that of spheres inside the constriction. This results in a lower concentration of nanoworms in the main channels due to the conservation of the total number of NPs. The higher accumulation of nanoworms inside the constriction becomes more significant for the case with moderate constriction (Lc = 18 μm, Fig. 5(b)). It should be noted that the distribution of nanoworms is not smooth compared to that of spheres. Two possible reasons are considered, one having to do with the statistics of the number of nanoworms inside a small bin, which is based on the center of mass of the nanoworms. The other one is the change of the volume of a small bin in the transition zone. The small bin near the main channel is larger than that near the constriction. Moreover, we find that the further increase of the CL (Lc = 34 μm, Fig. 5(c)) magnifies the difference between distributions of spheres and nanoworms. However, this difference is only significant near the entrance of the constriction. The distribution of nanoworms rapidly increases to a peak when entering the constriction, and then sharply decreases towards a plateau, the same as that of spheres. This will be discussed later in the following section.
 | ||
| Fig. 5 Comparison of distributions of spheres and nanoworms under moderate CR β = 27.8% with different CLs (a) Lc = 2 μm, (b) Lc = 18 μm and (c) Lc = 34 μm. | ||
Secondly, the distributions of nanoworms in the channels with different CRs are examined and shown in Fig. 6. The CL is fixed at Lc = 18 μm, and the CRs β vary from 17% to 50%. It is also found that the accumulations of nanoworms inside the constriction are higher than those of spheres in small (β = 17%) and moderate (β = 27.8%) CRs, and the difference is significant for the moderate one, similar to the CL effect. However, it is interesting that in the channel with high CR (β = 50%), the spheres and nanoworms manifest the same distributions in both the main channel and the constriction. Furthermore, we find that this exceptional phenomenon only exists for the channels with high CR (β = 50%) and large CL (Lc ≥ 18 μm).
 | ||
| Fig. 6 Comparison of sphere and nanoworm distributions under moderate CL Lc = 18 μm with different CRs (a) β = 17%, (b) β = 27.8% and (c) β = 50%. | ||
To unravel the higher accumulation of nanoworms inside the constriction and the exceptional phenomenon discussed above, the RBC effect is first investigated. Based on the results in Section 3.1, the spheres circulate along with RBCs in the channel like that RBCs “carry” spheres and move along with the flow. Therefore, we conduct additional simulations by removing RBCs in the channel and maintain the other conditions the same, such as flow strength and total particle numbers. The distributions of spheres and nanoworms without RBCs are presented to compare with those with RBCs inside the channel, as given in Fig. 7. Two cases are demonstrated: (i) β = 27.8%, Lc = 34 μm and (ii) β = 50%, Lc = 34 μm, which correspond to the typical cases of higher accumulation of nanoworms and an exceptional phenomenon, respectively. It is found that, in both cases, spheres and nanoworms have the same distributions without RBCs inside the channel. This indicates that the existence of RBCs results in the higher accumulation of nanoworms inside the constriction. In the following, we will further explore how RBCs affect the different behaviors of spheres and nanoworms during their circulation in the constricted channel.
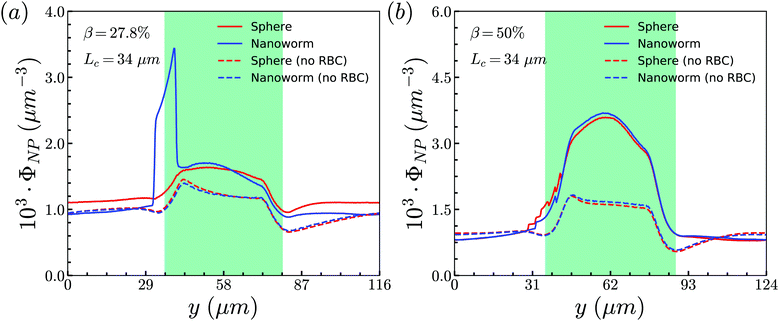 | ||
| Fig. 7 Comparison of sphere and nanoworm distributions with and without RBCs inside the channel for (a) β = 27.8%, Lc = 34 μm and (b) β = 50%, Lc = 34 μm. | ||
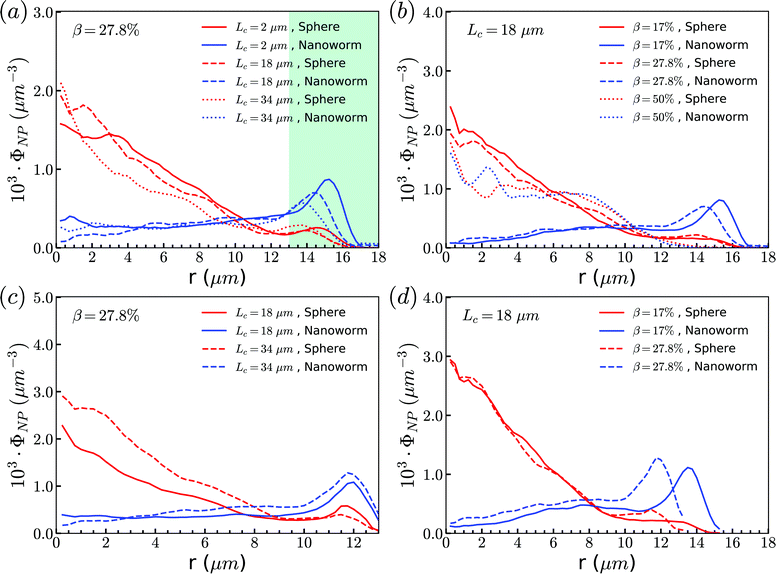
The above discussions are limited to the distribution of particles in the flow direction, while the radial distribution should be also considered. We study the radial distribution of particles in both the main channel and the constriction. Fig. 8(a) and (b) present the radial distribution in the main channel. r = 0 μm and r = 18 μm represent the center line and the wall of the channel, respectively. The shadow region is adopted to denote the extra part of the main channel compared to the constriction, and the left boundary of the shadow points to the position of constriction. We find that the spheres localize at the central part of the channel, while the nanoworms accumulate near the wall. The snapshots in Fig. 9 show the comparison of radial distribution of spheres and nanoworms under moderate CR β = 27.8% and moderate CL Lc = 18 μm. As shown by the red arrows, spheres tend to localize at the center of the channel, while nanoworms migrate towards the channel wall, leaving a nanoworm-depletion region at the center of the channel. Furthermore, for the case of moderate CR β = 27.8% (cf.Fig. 8(a)), the concentration of spheres in the main channel decreases with the increase of CL. Besides, the accumulation of nanoworms near the wall demonstrates the same tendency that it decreases with the increase of CL. In addition to the CL effect, we fix the CL at Lc = 18 μm and vary the CR. As shown in Fig. 8(b), we find that the concentration of spheres in the main channel decreases with the increase of CR. The accumulation of nanoworms near the wall with a larger CR is higher. However, the exceptional case occurs at β = 50%, in which nanoworms localize at the central part of the channel like spheres, instead of accumulating near the wall.
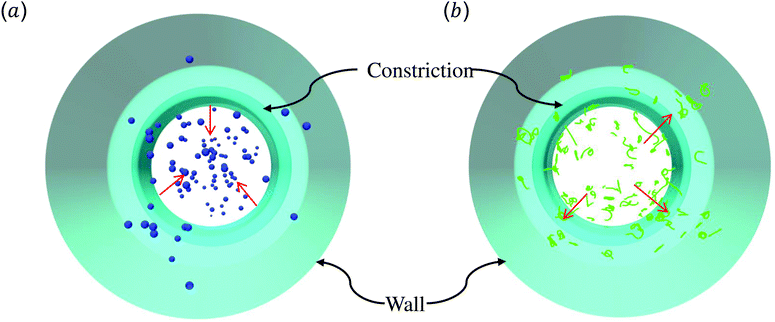 | ||
| Fig. 9 Snapshots for radial distributions of (a) spheres and (b) nanoworms under moderate CR β = 27.8% and moderate CL Lc = 18 μm. | ||
Furthermore, the radial distributions inside the constriction are examined. In the Fig. 8(c), we find that, for the case with moderate CR (β = 27.8%), the spheres localize at the central part of the constriction, while the concentration increases with the increment of CL which is different from that in the main channel. This also applies to the accumulation of nanoworms near the wall that the distribution is higher in the longer constriction. Here, we should emphasize that we ignore the case of Lc = 2 μm, since it is difficult for a very short constriction to calculate the averaged radial distribution. For the constriction with fixed length Lc = 18 μm, we find the concentration of spheres has no obvious difference between the cases with different CRs as shown in Fig. 8(d). While the distribution of nanoworms inside the constriction is found to slightly increase with the increment of CR. It should be noted that the case with β = 50% is not shown here. In this extreme case (β = 50%), RBCs aggregate together and lead to almost identical distributions between spheres and nanoworms inside the constriction. This aspect will be further discussed in the next section.
3.3 Discussion
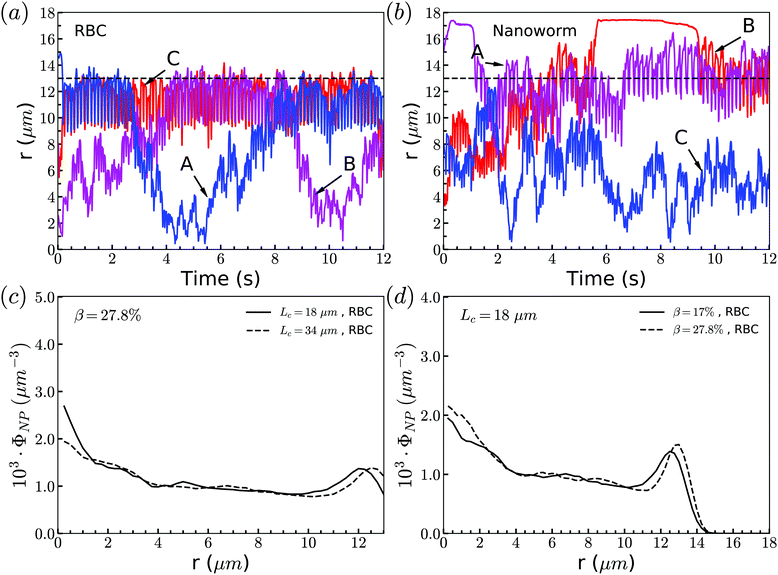
Through tracking the RBCs and nanoworms, we find three types of motion and show them in Fig. 10(a) and (b). Because the spheres and RBCs have the same distributions and they also have the same types of motion, here we only demonstrate the types of motion for RBCs. These include type A: the RBC initially near the position of constriction wall (dashed line) migrates towards the center when entering the constriction and reverts to the near-wall position after exiting the constriction; type B: the RBC initially at the center of channel moves towards the location of the constriction wall and then reverts to its initial position; and type C: the RBC stays near the position of the constriction wall. For nanoworms, the three types of motion are type A: the nanoworm initially in the near-wall region (main channel wall) enters the constriction and remains near the constriction wall for a long time after exiting the constriction; type B: the nanoworm initially at the center of the main channel migrates towards the main channel wall and stays there for a long time, eventually entering the constriction; and type C: the nanoworm stays in the central part of the channel. Among three types of motion for spheres, the migration from the central part to the wall of the main channel is also called margination, which is considered as the typical migration in the radial direction. In the straight channel, spheres in the RBC suspension are expected to marginate towards the wall of the channel.41,66 And the margination mechanisms include exclusion of RBC suspension and collision between RBCs and spheres. However, significant margination can only be observed after a long distance in the flow direction. In this work, the channel has a constriction and particles will finally pass through the constriction. Therefore, the constriction hampers the margination of spheres. Nevertheless, the exclusion of nanoworms from RBC suspension still occurs due to their filamentous shape. Compared to the spheres, nanoworms can easily escape from the RBCs cluster through the gaps. This explains why the spheres localize at the center of the channel, while nanoworms accumulate near the wall region.Although nanoworms can accumulate near the wall, they are driven by the flow and will finally enter the constriction. They will be affected by the RBCs that locate near the constriction wall, since the nanoworms accumulating at the near-wall region of the main channel will enter the constriction together with RBCs. Therefore, we also show the radial distribution of RBCs in Fig. 10(c) and (d). It is found that, for moderate CR (β = 27.8%), the longer constriction leads to more RBCs concentrating at the near-wall region, which results in the greater number of nanoworms accumulated at the near-wall region of the main channel being carried by RBCs into the constriction. This also applies to the cases with moderate CL (Lc = 18 μm). Larger CR will lead to greater accumulation of RBCs at the near-wall region of the main channel, thus carrying more nanoworms into the constriction.
The exceptional phenomenon of spheres and nanoworms having the same distribution when CR is high (β = 27.8%) and CL is large (Lc ≥ 18 μm) is observed. To understand this phenomenon, we examine the radial distribution of particles and RBCs under these circumstances. Fig. 11(a) shows the snapshots of two typical cases: moderate CR (β = 27.8%) and high ratio (β = 50%) for the longest CL (Lc = 34 μm). With moderate CR, RBCs are almost uniformly distributed inside the channel. However, for the case with high CR, RBCs concentrate at the central part of the channel and some RBCs are blocked at the entrance of the constriction. Associated with these two cases, we present the radial distribution of spheres, nanoworms and RBCs in Fig. 11(b) and (c), respectively. Under moderate CR, we observe the same results as in the previous section. The spheres localize at the central part, while nanoworms accumulate near the wall of the main channel. We also find that RBCs concentrate at the location near the wall of the constriction, thus carrying more nanoworms into the constriction. Under these circumstances, nanoworms demonstrate higher accumulation in the front of the constriction than spheres do. Fig. 11(c) shows that both spheres and nanoworms are subjected to the same distribution of RBCs that concentrate at the central part of the channel. In this case, RBCs aggregate together and the gap between RBCs is very limited. Therefore, it is not only spheres that cannot escape from the RBC cluster, but also the nanoworms cannot penetrate into the RBC-depletion layers near the channel wall. Only a small amount of spheres or nanoworms are found to accumulate at the entrance of the constriction due to the obstruction by RBCs. Although the accumulation is small, it still promotes the development of the constriction if these spheres or nanoworms are platelets, which is the main reason for the plaque accumulation.16
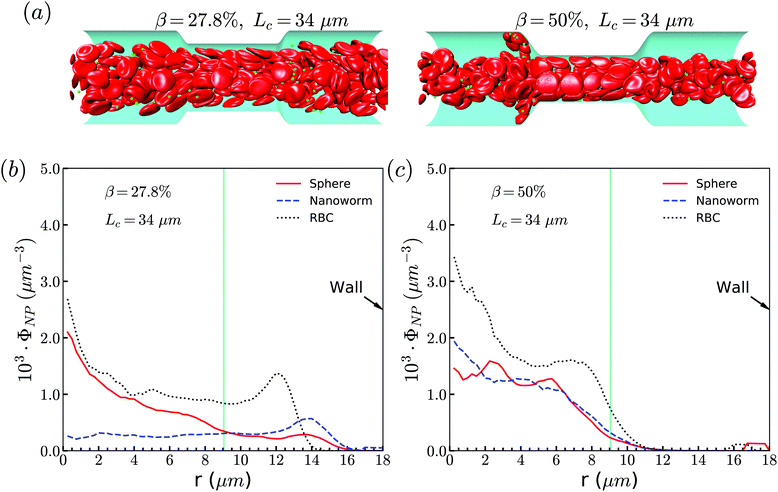 | ||
| Fig. 11 (a) Snapshots for distribution of RBCs inside the channel. The radial distribution of spheres, nanoworms and RBCs for the cases: (b) β = 27.8%, Lc = 34 μm and (c) β = 50%, Lc = 34 μm. | ||
To support our analysis that the difference between the distributions of spheres and nanoworms in the constricted channel is caused by the shape-induced penetration in RBCs suspension, we conduct more simulations for spheres with different diameters. The distributions in the flow direction are shown in Fig. 12(a). We observe that the accumulation of spheres will increase with the increment of the diameter Dp. Fig. 12(b) presents the distributions in the radial direction. It is found that the larger the sphere's diameter is, the more spheres localize at the central part of the channel. Besides, we also show the radial distribution of nanoworms in Fig. 12(b). We find that, as the diameter of the spheres decreases, the radial distribution of spheres approaches that of nanoworms. This indicates that the smaller spheres will behave like nanoworms and escape from the RBC cluster and accumulate near the main channel wall. The accumulated spheres will eventually enter the constriction, resulting in higher accumulation inside the constriction. Whereas, the larger spheres are stuck in the gaps among RBCs and they normally circulate with the RBCs in the core region of the channel.
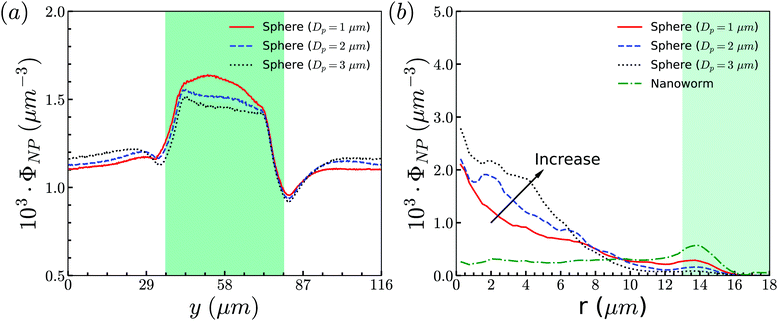 | ||
| Fig. 12 (a) Distributions of spheres with different sizes in the flow direction. (b) Comparison for radial distributions of spheres and nanoworms. The constriction geometry is β = 27.8%, Lc = 34 μm. | ||
4 Conclusion
In this work, the circulations of spheres and nanoworms in a constricted channel is systematically studied by varying the geometry of the constriction. Two characteristics, CL and CR of the constriction geometry, are investigated in detail. The circulation of spheres is first studied. We find that the accumulation of spheres in the constriction increases with the increment of both CL and CR. Through analyzing the distribution of RBCs and the local flow properties such as pressure and velocity, we find that the constriction influences the motion of RBCs and in turn, the RBC distribution alters the local hydrodynamics. The interaction between RBCs and spheres is confirmed to be responsible for the phenomenon that the distribution of spheres strongly follows that of RBCs.Secondly, we examine the distribution of nanoworms and compare it with that of spheres. It is found that nanoworms demonstrate stronger accumulation inside the constriction. This difference is explained by analyzing the radial distributions of spheres, RBCs and nanoworms. We find that RBCs uniformly distribute in the main channels with a depletion layer near the wall, and spheres move along with the RBCs. However, nanoworms can escape from RBC clusters and tend to migrate towards the channel wall. The accumulated nanoworms near the wall will eventually enter the constriction, leading to a higher accumulation of nanoworms inside the constriction. Nevertheless, an interesting and exceptional phenomenon happens for the case with a constriction of high ratio and long length. Under these circumstances, passing through the constriction makes the RBCs aggregate together and focus at the core region of the channel, as the main channel is not long enough for RBCs to disperse in the radial direction. This means that the nanoworms are hardly able to escape from the RBC clusters, like spheres can, resulting in almost the same accumulation inside the constriction as that of spheres. This mechanism is further supported by performing additional simulations of spheres with different diameters. The larger sphere is hardly to escape from the RBC cluster and demonstrates lower accumulation inside the constriction.
In the present study, we only consider the nanoworm with semi-flexibility, since the goal is to compare a spherical particle with a filamentous one. However, the flexibility of the nanoworm is also another important factor to change the dynamics of nanoworms in the blood flow.67–69 In our previous study,51 we find that the soft nanoworm collapses in the blood flow and acts as a spherical particle in terms of the margination. While the rigid nanoworm demonstrates strong accumulation on the vessel wall, due to the exclusion of RBCs. Therefore, we consider only the semi-flexible nanoworm can demonstrate the above RBC hitchhiking behavior.
For simplification, the properties of RBCs such as stiffness are fixed in all the simulations. However, in reality, the nanoparticles and the thrombo-inflammatory conditions can alter their mechanical properties, leading to different behaviors of the RBCs in the DDS.70–74 For example, the polystyrene NP can increase the RBC stiffness during the interaction,70 and a high NP loading can damage RBCs by mechanical, osmotic and oxidative stress.72 Also, during the thrombo-inflammatory process, due to the compression of activated platelets pulling on fibrin, the shape of RBCs can largely change within contracting blood clots. These biological aspects should be considered in the application of RBC hitchhiking in DDS.
This study unravels the underlying mechanism of nano- and micro-particles circulating in the constricted channel through comparing two typical shapes: spherical versus filamentous. The simulation results may guide the rationalized design of these particles with applications in biomedical engineering, such as targeting drugs at the site of stenosis in microvessels.
Conflicts of interest
There are no conflicts to declare.Acknowledgements
H. Y., Z. S., and Y. L. would like to thank the support from the National Science Foundation under the grant no. OAC-1755779. H. Y., Z. S., and Y. L. are all grateful for the support from the Department of Mechanical Engineering at the University of Connecticut. H. Y. and Z. S. were partially supported by a fellowship grant from GE's Industrial Solutions Business Unit under a GE-UConn partnership agreement. The views and conclusions contained in this document are those of the authors and should not be interpreted as necessarily representing the official policies, either expressed or implied, of Industrial Solutions or UConn. Y. L. was partially supported by ASME Robert M. and Mary Haythornthwaite Research Initiation Award and STEAM Innovation Grant from The School of Fine Arts at UConn. This research also benefited in part from the computational resources and staff contributions provided by the Booth Engineering Center for Advanced Technology (BECAT) at the University of Connecticut. Part of this work used the Extreme Science and Engineering Discovery Environment (XSEDE), which is supported by the National Science Foundation grant no. ACI-1053575. The authors also acknowledge the Texas Advanced Computing Center (TACC) at The University of Texas at Austin for providing HPC resources (Frontera project and the National Science Foundation award 1818253) that have contributed to the research results reported within this paper. Last but not least, the authors thank Sarah Shattuck for preparing the cover image of this work.References
- C. K. Glass and J. L. Witztum, Cell, 2001, 104, 503–516 CrossRef.
- D. N. Atochin, J. Murciano, Y. Gursoy-Ozdemir, T. Krasik, F. Noda, C. Ayata, A. Dunn, M. Moskowitz, P. L. Huang and V. Muzykantov, Stroke, 2004, 35, 2177–2182 CrossRef.
- R. Carnemolla, C. H. Villa, C. F. Greineder, S. Zaitsev, K. R. Patel, M. A. Kowalska, D. N. Atochin, D. B. Cines, D. L. Siegel and C. T. Esmon, et al. , FASEB J., 2017, 31, 761–770 CrossRef.
- J. M. Pisapia, X. Xu, J. Kelly, J. Yeung, G. Carrion, H. Tong, S. Meghan, O. M. El-Falaky, M. S. Grady and D. H. Smith, et al. , Exp. Neurol., 2012, 233, 357–363 CrossRef.
- S. Zaitsev, D. Spitzer, J.-C. Murciano, B.-S. Ding, S. Tliba, M. A. Kowalska, K. Bdeir, A. Kuo, V. Stepanova and J. P. Atkinson, et al. , J. Pharmacol. Exp. Ther., 2010, 332, 1022–1031 CrossRef.
- S. Zaitsev, M. A. Kowalska, M. Neyman, R. Carnemolla, S. Tliba, B.-S. Ding, A. Stonestrom, D. Spitzer, J. P. Atkinson and M. Poncz, et al. , Am. J. Hematol., 2012, 119, 4779–4785 Search PubMed.
- J.-C. Murciano, S. Medinilla, D. Eslin, E. Atochina, D. B. Cines and V. R. Muzykantov, Nat. Biotechnol., 2003, 21, 891–896 CrossRef.
- T. J. Ingall, W. M. O’Fallon, K. Asplund, L. R. Goldfrank, V. S. Hertzberg, T. A. Louis and T. J. H. Christianson, Stroke, 2004, 35, 2418–2424 CrossRef.
- N. Korin, M. Kanapathipillai, B. D. Matthews, M. Crescente, A. Brill, T. Mammoto, K. Ghosh, S. Jurek, S. A. Bencherif and D. Bhatta, et al. , Science, 2012, 337, 738–742 CrossRef.
- M. N. Holme, I. A. Fedotenko, D. Abegg, J. Althaus, L. Babel, F. Favarger, R. Reiter, R. Tanasescu, P.-L. Zaffalon and A. Ziegler, et al. , Nat. Nanotechnol., 2012, 7, 536 CrossRef.
- N. Korin, M. Kanapathipillai and D. E. Ingber, Isr. J. Chem., 2013, 53, 601–615 CrossRef.
- T. Saxer, A. Zumbuehl and B. Müller, Cardiovascular Research, 2013, 99, 328–333 CrossRef.
- X. Wang and T. M. Connolly, Advances in clinical chemistry, Elsevier, 2010, vol. 50, pp. 1–22 Search PubMed.
- G. Lanza, P. Winter, T. Cyrus, S. Caruthers, J. Marsh, M. Hughes and S. Wickline, Ann. N. Y. Acad. Sci., 2006, 1080, 451–465 CrossRef.
- A. L. Fogelson and K. B. Neeves, Annu. Rev. Fluid Mech., 2015, 47, 377–403 CrossRef.
- J. M. Tarbell, Z.-D. Shi, J. Dunn and H. Jo, Annu. Rev. Fluid Mech., 2014, 46, 591–614 CrossRef.
- L. D. Casa and D. N. Ku, Annu. Rev. Biomed. Eng., 2017, 19, 415–433 CrossRef.
- A. S. Popel and P. C. Johnson, Annu. Rev. Fluid Mech., 2005, 37, 43–69 CrossRef.
- A. R. Pries and T. W. Secomb, Am. J. Physiol.: Heart Circ. Physiol., 2005, 289, H2657–H2664 CrossRef.
- A. R. Pries, D. Neuhaus and P. Gaehtgens, Am. J. Physiol.: Heart Circ. Physiol., 1992, 263, H1770–H1778 CrossRef CAS.
- D. A. Fedosov, B. Caswell, A. S. Popel and G. E. Karniadakis, Microcirculation, 2010, 17, 615–628 CrossRef.
- L. Fan, J. Yao, C. Yang, D. Xu and D. Tang, Comput. Model. Eng. Sci, 2018, 114, 221–237 Search PubMed.
- S. Chen, B. Li, H. Yang, J. Du, X. Li and Y. Liu, Comput. Model. Eng. Sci., 2018, 116, 149–162 Search PubMed.
- K. Vahidkhah, P. Balogh and P. Bagchi, Sci. Rep., 2016, 6, 28194 CrossRef CAS.
- A. Malek, A. Hoque and M. Mohiuddin, Engineering International, 2015, 3, 87–96 CrossRef.
- T. Wang and Z. Xing, Phys. Rev. E: Stat., Nonlinear, Soft Matter Phys., 2013, 88, 042711 CrossRef CAS.
- L. Xiao, C. Lin, S. Chen, Y. Liu, B. Fu and W. Yan, Biomech. Model. Mechanobiol., 2019, 1–13 Search PubMed.
- A. Yazdani and G. E. Karniadakis, Soft Matter, 2016, 12, 4339–4351 RSC.
- C. Bächer, L. Schrack and S. Gekle, Physical Review Fluids, 2017, 2, 013102 CrossRef.
- E. J. Carboni, B. H. Bognet, D. B. Cowles and A. W. Ma, Biophys. J., 2018, 114, 2221–2230 CrossRef.
- P. M. Glassman, C. H. Villa, A. Ukidve, Z. Zhao, P. Smith, S. Mitragotri, A. J. Russell, J. S. Brenner and V. R. Muzykantov, Pharmaceutics, 2020, 12, 440 CrossRef.
- J. S. Brenner, D. C. Pan, J. W. Myerson, O. A. Marcos-Contreras, C. H. Villa, P. Patel, H. Hekierski, S. Chatterjee, J.-Q. Tao and H. Parhiz, et al. , Nat. Commun., 2018, 9, 1–14 CrossRef.
- C. H. Villa, D. C. Pan, I. H. Johnston, C. F. Greineder, L. R. Walsh, E. D. Hood, D. B. Cines, M. Poncz, D. L. Siegel and V. R. Muzykantov, Blood Advances, 2018, 2, 165–176 CrossRef.
- A. C. Anselmo, V. Gupta, B. J. Zern, D. Pan, M. Zakrewsky, V. Muzykantov and S. Mitragotri, ACS Nano, 2013, 7, 11129–11137 CrossRef.
- V. Smirnov, S. Domogatsky, V. Dolgov, V. Hvatov, A. Klibanov, V. Koteliansky, V. Muzykantov, V. Repin, G. Samokhin and B. Shekhonin, Proc. Natl. Acad. Sci. U. S. A., 1986, 83, 6603–6607 CrossRef CAS.
- G. Samokhin, M. Smirnov, V. Muzykantov, S. Domogatsky and V. Smirnov, J. Appl. Biochem., 1984, 6, 70–75 CAS.
- H. Fujiwara, T. Ishikawa, R. Lima, N. Matsuki, Y. Imai, H. Kaji, M. Nishizawa and T. Yamaguchi, J. Biomech., 2009, 42, 838–843 CrossRef CAS.
- Y. Dimakopoulos, G. Kelesidis, S. Tsouka, G. C. Georgiou and J. Tsamopoulos, Biorheology, 2015, 52, 183–210 Search PubMed.
- R. Zhao, J. N. Marhefka, F. Shu, S. J. Hund, M. V. Kameneva and J. F. Antaki, Ann. Biomed. Eng., 2008, 36, 1130 CrossRef.
- H. Ha and S.-J. Lee, Microvasc. Res., 2013, 90, 96–105 CrossRef.
- K. Müller, D. A. Fedosov and G. Gompper, Sci. Rep., 2015, 4, 4871 CrossRef.
- S. Chen and G. D. Doolen, Annu. Rev. Fluid Mech., 1998, 30, 329–364 CrossRef.
- S. Succi, The lattice Boltzmann equation: for fluid dynamics and beyond, Oxford University Press, 2001 Search PubMed.
- Y. Qian, D. d'Humières and P. Lallemand, Europhys. Lett., 1992, 17, 479 CrossRef.
- Z. Guo, C. Zheng and B. Shi, Phys. Rev. E: Stat. Phys., Plasmas, Fluids, Relat. Interdiscip. Top., 2002, 65, 046308 CrossRef.
- D. Barthes-Biesel, Advances in hemodynamics and hemorheology, Elsevier, 1996, vol. 1, pp. 31–65 Search PubMed.
- H. Ye, Z. Shen and Y. Li, Comput. Mech., 2018, 62, 457–476 CrossRef.
- M. P. Allen and D. J. Tildesley, Computer simulation of liquids, Oxford University Press, 1989 Search PubMed.
- M. Dao, J. Li and S. Suresh, Mater. Sci. Eng., C, 2006, 26, 1232–1244 CrossRef CAS.
- D. A. Fedosov, B. Caswell and G. E. Karniadakis, Biophys. J., 2010, 98, 2215–2225 CrossRef CAS.
- H. Ye, Z. Shen, L. Yu, M. Wei and Y. Li, ACS Biomater. Sci. Eng., 2018, 4, 66–77 CrossRef CAS.
- D. A. Fedosov, W. Pan, B. Caswell, G. Gompper and G. E. Karniadakis, Proc. Natl. Acad. Sci. U. S. A., 2011, 108, 11772–11777 CrossRef CAS.
- Y. Liu and W. K. Liu, J. Comput. Phys., 2006, 220, 139–154 CrossRef.
- H. Ye, Z. Shen and Y. Li, Soft Matter, 2018, 14, 7401–7419 RSC.
- E. A. Evans and R. Skalak, Mechanics and thermodynamics of biomembranes, CRC Press, 1978 Search PubMed.
- S. Suresh, J. Spatz, J. P. Mills, A. Micoulet, M. Dao, C. Lim, M. Beil and T. Seufferlein, Acta Biomater., 2005, 1, 15–30 CrossRef CAS.
- W. K. Liu, Y. Liu, D. Farrell, L. Zhang, X. S. Wang, Y. Fukui, N. Patankar, Y. Zhang, C. Bajaj and J. Lee, et al. , Comput. Methods Appl. Mech. Eng., 2006, 195, 1722–1749 CrossRef.
- C. S. Peskin, J. Comput. Phys., 1977, 25, 220–252 CrossRef.
- C. S. Peskin, Acta Numer., 2002, 11, 479–517 CrossRef.
- R. Mittal, H. Dong, M. Bozkurttas, F. Najjar, A. Vargas and A. Von Loebbecke, J. Comput. Phys., 2008, 227, 4825–4852 CrossRef CAS.
- L. Zhang, A. Gerstenberger, X. Wang and W. K. Liu, Comput. Methods Appl. Mech. Eng., 2004, 193, 2051–2067 CrossRef.
- W.-X. Huang, S. J. Shin and H. J. Sung, J. Comput. Phys., 2007, 226, 2206–2228 CrossRef.
- F.-B. Tian, H. Luo, L. Zhu, J. C. Liao and X.-Y. Lu, J. Comput. Phys., 2011, 230, 7266–7283 CrossRef.
- H. Ye, Z. Shen and Y. Li, J. Fluid Mech., 2019, 861, 55–87 CrossRef.
- H. Krüger, Computer simulation study of collective phenomena in dense suspensions of red blood cells under shear, Springer Science & Business Media, 2012 Search PubMed.
- J. Tan, A. Thomas and Y. Liu, Soft Matter, 2012, 8, 1934–1946 RSC.
- Y. Geng, P. Dalhaimer, S. Cai, R. Tsai, M. Tewari, T. Minko and D. E. Discher, Nat. Nanotechnol., 2007, 2, 249–255 CrossRef.
- P. Dalhaimer, A. J. Engler, R. Parthasarathy and D. E. Discher, Biomacromolecules, 2004, 5, 1714–1719 CrossRef.
- V. V. Shuvaev, M. A. Ilies, E. Simone, S. Zaitsev, Y. Kim, S. Cai, A. Mahmud, T. Dziubla, S. Muro and D. E. Discher, et al. , ACS Nano, 2011, 5, 6991–6999 CrossRef CAS.
- D. C. Pan, J. W. Myerson, J. S. Brenner, P. N. Patel, A. C. Anselmo, S. Mitragotri and V. Muzykantov, Sci. Rep., 2018, 8, 1–12 CrossRef.
- C. H. Villa, J. Seghatchian and V. Muzykantov, Transfus. Apheresis Sci., 2016, 55, 275–280 CrossRef.
- D. Pan, O. Vargas-Morales, B. Zern, A. C. Anselmo, V. Gupta, M. Zakrewsky, S. Mitragotri and V. Muzykantov, PLoS One, 2016, 11, e0152074 CrossRef.
- J. Weisel and R. Litvinov, J. Thromb. Haemostasis, 2019, 17, 271–282 CrossRef CAS.
- V. Tutwiler, A. R. Mukhitov, A. D. Peshkova, G. Le Minh, R. Khismatullin, J. Vicksman, C. Nagaswami, R. I. Litvinov and J. W. Weisel, Sci. Rep., 2018, 8, 1–14 CrossRef.
| This journal is © The Royal Society of Chemistry 2021 |

