 Open Access Article
Interfacial study of clathrates confined in reversed silica pores†
Paulo G. M.
Mileo
 a,
Sven M. J.
Rogge
 a,
Maarten
Houlleberghs
 b,
Eric
Breynaert
 b,
Johan A.
Martens
 b and
Veronique
Van Speybroeck
 *a
*a
aCenter for Molecular Modeling (CMM), Ghent University, Technologiepark 46, B-9052 Zwijnaarde, Belgium. E-mail: veronique.vanspeybroeck@ugent.be
bCenter for Surface Chemistry and Catalysis, Katholieke Universiteit Leuven, Celestijnenlaan 200F, 3001 Heverlee, Belgium
First published on 9th September 2021
Abstract
Storing methane in clathrates is one of the most promising alternatives for transporting natural gas (NG) as it offers similar gas densities to liquefied and compressed NG while offering lower safety risks. However, the practical use of clathrates is limited given the extremely low temperatures and high pressures necessary to form these structures. Therefore, it has been suggested to confine clathrates in nanoporous materials, as this can facilitate clathrate's formation conditions while preserving its CH4 volumetric storage. Yet, the choice of nanoporous materials to be employed as the clathrate growing platform is still rather arbitrary. Herein, we tackle this challenge in a systematic way by computationally exploring the stability of clathrates confined in alkyl-grafted silica materials with different pore sizes, ligand densities and ligand types. Based on our findings, we are able to propose key design criteria for nanoporous materials favoring the stability of a neighbouring clathrate phase, namely large pore sizes, high ligand densities, and smooth pore walls. We hope that the atomistic insight provided in this work will guide and facilitate the development of new nanomaterials designed to promote the formation of clathrates.
Introduction
In light of the growing environmental concerns in the last few decades, developing alternatives to minimize the carbon footprint is of utmost importance. Natural gas (NG) is one of the cleanest alternatives for energy generation. However, its widespread use is severely hampered by its high transportation costs, mainly due to its low density. Storing NG constituents as solidified natural gas (SNG) in the form of methane clathrates has been suggested as one of the most promising alternatives for NG transportation, mainly due to its environmentally friendly constituents and low safety risk.1 Clathrates are cage-like structures where water molecules surround usually small-sized molecules with highly directional hydrogen bonds. These materials typically present a well-defined crystallinity, represented by three main structures: I, II and H.2 Methane-containing clathrates usually form structure I (S-I) networks.3The synthesis of methane clathrates even on a laboratory scale still poses crucial challenges that need to be tackled before this technology can become economically feasible. Especially, the low nucleation kinetics and high pressure required to initiate clathrate nucleation from bulk water are severe problems increasing the production costs.4 Such conditions are usually relented by employing chemical additives (e.g. THF and surfactants)5,6 though this jeopardizes the CH4 volumetric storage in the hydrate.1,7 Alternatively, clathrate formation can be promoted under confinement in nanoporous materials. Under nanoconfinement, the CH4–water contact area is increased in comparison with bulk water, reducing the clathrate formation pressures compared to the bulk.4,8 Interestingly, storage in nanopores does not hamper the overall CH4 capacity and in some cases may even overcome the storage capacity observed in natural deposits.9
A fundamental understanding of the mechanisms involved in the promotion of clathrate formation through confinement in nanoporous environments is still rather limited due to the complex nature of this phenomenon. However, as pointed out in a recent review,10 mesoporous materials with moderate hydrophobicity are optimal candidates for promoting gas hydrate formation, as they allow a balance between (i) overcoming capillary forces, allowing the population of the pores, and (ii) preserving the preferential tetrahedral orientation of water molecules close to the pore's surface, an essential feature for the formation of clathrate cages. Besides their role in the hydrate formation, hydrophobic surfaces also seem to interact rather strongly with clathrate interfaces.11,12 These fundamental considerations have been confirmed by recent studies, which revealed clathrates to be formed at faster rates and at milder temperatures than in bulk water when confined in porous materials displaying hydrophobic surfaces, such as activated carbon9,13,14 and metal–organic frameworks.15–18
Silica matrices have also been widely studied19–21 as media for clathrate formation, mostly motivated by the need to understand how clathrates are formed in natural deposits.4 However, there seems to be some discrepancy in the literature on the role of silica surfaces in clathrate formation. While some experimental studies have revealed silica to act as an inhibitor of clathrate formation,20,22 theoretical studies have pointed out that silica pores promote clathrate growth either due to the slower mobility of water molecules next to the silica surfaces23 or due to the role of these surfaces as a source of methane molecules.24 However, a point of agreement between experimental and theoretical studies is the fact that hydrophobic silica surfaces are more effective in clathrate promotion.25,26
In this sense, it seems an interesting approach to direct the formation of clathrates in nanoporous silica materials by grafting the silica surface with hydrophobic moieties, such as alkyl groups, at the SiO2 surface. This approach is employed in the synthesis of well-known amorphous reversed silica materials, widely used in chromatography separation. However, other materials such as ordered mesoporous silica, e.g. SBA-15, could also be easily functionalized to incorporate such hydrophobic groups at their surface. Indeed, multiple experimental studies have demonstrated the outstanding clathrate promoting effects of hydrophobized silica surfaces.27–30 Nevertheless, considering the diversity of types, distribution and concentration of surface ligands available to be introduced into SiO2 matrices, as well as the different pore sizes of the parent matrix, it is important to establish clear structure–property relationships to guide the choice of high-performance materials without having to rely on serendipity-based experiments.
Earlier computational evaluations of clathrate nucleation in nanoconfinement shed light on how the interfacial interactions play a fundamental role in the organization and stabilization of confined clathrate structures. In particular, it was observed that clathrate networks grow with the support of rather unorganized water molecule layers on hydrophilic silica surfaces.8,24,31 It was also observed that the less hydrophilic such surfaces are, the more organized are the water molecules in the vicinities of the pore walls. This ultimately favours the clathrate growth.25 Moreover, the interactions of methane molecules with the pore wall seem to be also of importance by favouring the formation of half cages as observed next to the siloxane surface of kaolinites.32
Considering the fundamental role of interfacial interactions between the clathrate and the pore walls in the structural stabilization of clathrate structures, we judge it necessary to obtain fundamental insight into the interfacial characteristics of different alkyl-grafted SiO2 surfaces. Therefore, we created SiO2 models in which various parameters such as the pore size, ligand density and ligand type are systematically varied to obtain insight into their role in the stability of clathrate structures. For each of the obtained structural models, we investigate the structural stability of the formed clathrate phase and examine whether the clathrate structure is retained when increasing the temperature above the equilibrium temperature.
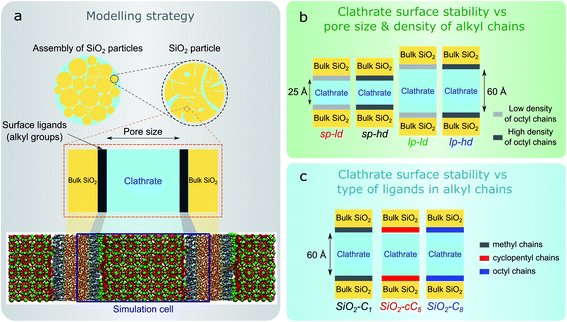
In this work, we computationally studied the interfacial configurations of clathrate structures at the microscopic level by systematically changing the pore size of the silica matrix as well as the density and type of alkyl groups. Using an octyl-functionalized silica surface as a starting point, we first studied the impact of pore size and ligand density on the stability of clathrates. This was followed by a comparative study of the effect of different SiO2 ligands on the stability of adjacent clathrate phases. In Fig. 1, we summarize the main modelling strategy used in this work.
Methods
Modelling strategy
We started the construction of our reversed silica microscopic models by cleaving a bulk glass-like silica lattice along the (0 0 1) plane and saturating uncoordinated Si and O atoms with –OH and –H atoms respectively. This procedure resulted in a 21 Å-thick 60.15 Å × 60.15 Å surface SiO2 slab containing a silanol density of 10.8 μmol m−2. Although this value is somewhat higher than the usual silanol surface concentration reported in silica (8.0 ± 1.0 μmol m−2),33 such an extensive array of silanol groups facilitates the random placement of ligands in different densities.34Some of these silanol groups were then replaced by monomeric ligands positioned orthogonally with respect to the SiO2 surface. Initially, dimethyloctylsilane (C8) was selected for an extensive investigation on the effect of different ligand concentrations and pore sizes on the interactions between reversed silica and clathrate surfaces. To perform this study, we generated two microscopic models with different C8 chain concentrations: one with 2.7 μmol m−2 and another with 5.6 μmol m−2. Such C8 concentrations were respectively in agreement with lower (2–3.5 μmol m−2) and higher (5–6 μmol m−2) bond density C8-terminated silica.35 From these structural models, four different simulation cells were created by introducing two void zones (25 Å and 60 Å) perpendicular (z direction) to the C8-terminated SiO2 surfaces. Subsequently, 5 × 5 × 2 and 5 × 5 × 5 CH4 clathrate super cells constructed from an experimentally derived structure I clathrate unit cell obtained from the literature3 were cleaved along the (0 0 1) plane and introduced into the 25 Å and 60 Å void zones of the reversed silica models. For convenience, the resulting microscopic models, which presented either small (sp) or large pores (lp) and either a low (ld) or high density (hd) of C8 chains, were renamed sp-hd, sp-ld, lp-hd, and lp-ld, as shown in Fig. 1b and S1.†
To study the effect of different alkyl groups on the interactions between the reversed silica and clathrate phases, the preceding structural model with a larger pore and a higher concentration of alkyl terminations (lp-hd) was selected and later used as a template for the construction of two new models by replacing its terminal C8 ligands with either cyclopentyl (cC5) or trimethylsilane (C1) ligands. For simplicity, each of these models were respectively named SiO2-C8, SiO2-cC5, and SiO2-C1. A non-grafted (i.e. silanol terminated) SiO2 model36 was also constructed as a reference for the hydrophobically grafted pores. Finally, a 60 Å void zone was created perpendicular to the reversed silica surfaces for the introduction of a 5 × 5 × 5 CH4 clathrate super cell. A comparison between these different structural models is displayed in Fig. 1c and S2.† In Table S1† we report the volumetric methane capacities associated with each of these models.
Bonded interactions were taken into account by harmonic and cosine potentials and non-bonded interactions were described by Lennard-Jones (LJ) and coulombic potentials representing respectively the dispersive and electrostatic interactions. The bonded and non-bonded parameters attributed to the SiO2 atoms were taken from the literature,37 while the corresponding parameters assigned to the alkyl chains were obtained from the OPLS-AA model.38 Atomic point charges were obtained from single point energy calculations using the ChelpG method (see Fig. S3†) with the PBE functional39,40 and the 6-311g(d,p) basis set41–43 as implemented in the Gaussian 16 software.44
Water molecules were described by the 4-site TIP4P/Ice model, which was designed to represent the experimental liquid-ice P-T diagram.45 CH4 molecules are represented by the TRAPPE united atom model.46 The same combination of water and methane potentials was recently successfully employed for the study of clathrates' aggregation.8
Molecular simulations
Molecular dynamics calculations were carried out for all the aforementioned structural models using the LAMMPS software47 in an isothermal-isobaric (NPT) ensemble using a Nose–Hoover48,49 thermostat and barostat with respective temperature and pressure relaxation constants of 0.1 ps and 1 ps. A timestep of 1 fs was used to solve Newton's equation of motion. Tail corrections were not used since they were reported8,50 to induce non-realistic clathrate behaviour. The systems were equilibrated for 500 ps during which the temperature was slowly increased from 100 K to 260 K at a pressure of 100 bar. Thereafter, 10 ns runs were carried out at 60 bar and 260 K. Such temperature and pressure values are consistent with the range of moderate operating conditions employed in confined methane clathrates.8,51 We extended this simulation time up to 100 ns for some selected systems and observed no structural changes, confirming that 10 ns was enough to achieve equilibration (see the ESI†). Complementary calculations to test the stability of the clathrate structures out of their stable conditions were carried out at 60 bar and 300 K. A spherical cut-off of 12 Å was used to evaluate the dispersive interactions, whilst the electrostatic interactions were computed using a particle–particle particle–mesh (PPPM) solver52 with a 10−5 tolerance.Results and discussion
Impact of pore size and ligand concentration on the clathrate interface
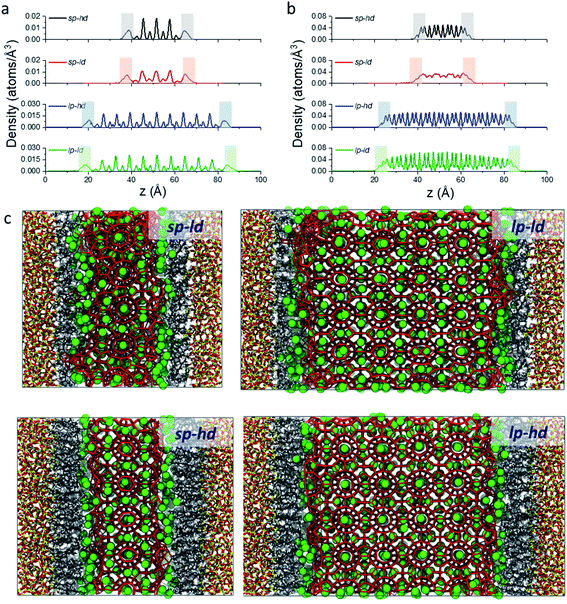
As a first step in our description of clathrate structures confined in reversed silica materials, we evaluated the effect of the silica pore size and the concentration of alkyl ligands on the interfacial clathrate organization by carrying out 10 ns force field based molecular dynamics (MD) calculations on the four structural models (sp-hd, sp-ld, lp-hd, and lp-ld) created by introducing structure I (S-I) CH4 clathrate structures into either small (∼25 Å, sp) or large (∼60 Å, lp) pores of octyl-bonded silica slabs (SiO2-C8) containing either a low (ld) or high (hd) density of alkyl chains (see Fig. 1b). Silica-based materials are characterized by a diversity of pore sizes, varying between a few to hundreds of nanometers. We decided to consider systems with relatively small pore ranges in order to maximize the surface effects on the confined clathrate phase. Meanwhile, the ld and hd configurations correspond to average ligand density values usually reported in low and high density alkyl-grafted silicas.35Fig. 2a and b demonstrate the density of methane and water molecules in the clathrate phase nanoconfined in the four reversed silica models. Whereas their distribution shows periodic peaks in the bulk clathrate, the organisation of these molecules is considerably modified near the SiO2-C8 surface, where they assume a smoother distribution. This can be directly correlated with the local disruption of the hydrogen bonded clathrate networks due to the interactions of its individual components with the SiO2-C8 surface (cf.Fig. 2c). In Fig. 2, it is also possible to notice that, compared to the water molecules, methane molecules are more delocalized in the vicinities of the octyl groups, because of their further penetration into the space delimited by the octyl chains.
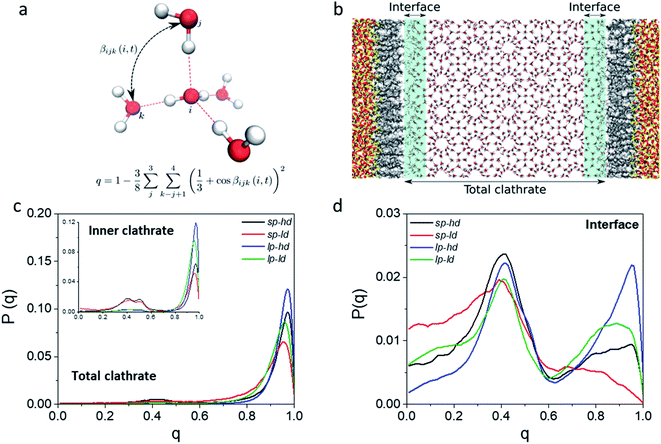
In order to better track the effect of such modifications on the organization of the whole clathrate structure and the clathrate/wall interface, we compared the distribution of the orientational tetrahedral order (OTO) parameter (cf.Fig. 3a and ESI†) of the water molecules in both regions. To this end, we defined the clathrate/SiO2-C8 interfacial region as an 8 Å wide zone extending from the water molecules closest to the pore's walls into the clathrate (see Fig. 3b). As observed in the shaded areas of Fig. 2a and b, 8 Å corresponds to the furthest distance where we observed a relevant disruption of the water structure in all clathrate models. The remainder of the clathrate structure is defined as the inner clathrate region.
Fig. 3c and d show the extracted OTO distributions for the whole clathrate phase as well as for the inner and interfacial regions separately. For the total and inner clathrate regions (Fig. 3c), the OTO distribution is strongly peaked around 1. This is expected in an ideal S-I CH4 clathrate structure, as each water molecule is hydrogen bonded to four other water molecules. However, also a broader but smaller peak around an OTO value of 0.4 is present, typical of more disorganized systems, such as liquid water. In contrast, at the clathrate–wall interface (Fig. 3d), the OTO parameter assumes a bimodal distribution, which shows that some of the water molecules keep the tetrahedral environment observed in the bulk clathrate structure (i.e. with an OTO = 1) and some form a liquid-like organization, with an OTO centred around 0.4.
Furthermore, from Fig. 3d we can observe that a higher proportion of molecules in the interfacial region assume a liquid-like configuration when smaller pores and lower alkyl densities are considered. While these effects are induced by the interface, they are also reflected in the overall organization of the inner clathrate phase (Fig. 3c), leading to an overall destabilization of the clathrate phase.
The aforementioned interfacial water disordering is reflected not only in the global ordering of the hydrogen bonded scaffold formed by the water molecules but also in their local environment. As one can see in the radial distribution functions (RDFs) and the corresponding cumulative distribution functions in Fig. S6,† the first solvation shell surrounding the water molecules is much more disorganized in the clathrate/pore wall interfacial region compared to the bulk clathrate. Consequently, each water molecule at this surface is, on average, surrounded by fewer neighbouring molecules. Instead of the typical arrangement of four other molecules surrounding each molecule observed at the core of the clathrate phase, in the lp-hd interfacial region about three water molecules surround each H2O molecule while in the other configurations only about two H2O molecules form this first solvation shell.
From these observations, it seems that models displaying smaller pore sizes and a lower density of alkyl chains covering the SiO2 substrate perturb the clathrate phase more strongly. While the effect of pore size is a direct result of the proportionally larger interfacial region in small-pore structures, the effect of alkyl densities on the clathrate structure is not directly clear at this point. Therefore, to understand why lower alkyl surface concentrations favour the local disruption of the clathrate structure, we will take a closer look at the alkyl chains' configurations when present in either high or low density on the SiO2 surfaces. Two representative snapshots are shown in Fig. 4, which demonstrate that the octyl chains assume different configurations according to their relative concentration. At high density the alkyl chains keep their initial configurations orthogonal to the SiO2 matrix and extend into the clathrate phase (cf.Fig. 4a), whereas at lower density they curl and tilt (cf.Fig. 4b and S7†) due to the high pressure exerted by the adjacent clathrate phase. In the low-density configuration, this pressure cannot be withstood in a configuration orthogonal to the surface due to the lack of mutual support and repulsion of neighbouring alkyl chains. This change in the alkyl chain configuration in ld configurations strongly disrupts the clathrate in the interfacial region due to (i) the shrinking of the alkyl zone atop the SiO2 matrix, as shown in Fig. S8,† and (ii) the formation of void zones where both water and CH4 molecules can further penetrate (cf.Fig. 4b).
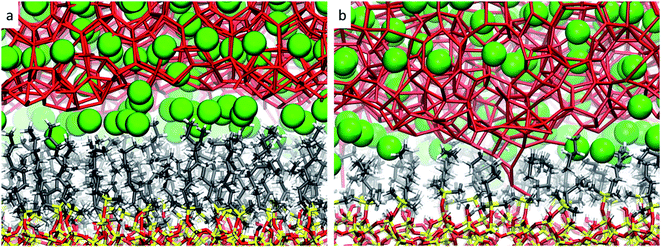 | ||
| Fig. 4 Representative snapshots taken from the microscopic models sp-hd (a) and sp-ld (b), displaying the configuration of the octyl chains when in respectively high or low densities over the SiO2 matrix. The same colour code as in Fig. 2 is used. | ||
Summarizing this first part on the influence of the pore size and the ligand density, we can conclude that large pores and high alkyl densities are beneficial to stabilize a well-structured clathrate phase.
Impact of ligand choice on local clathrate organization
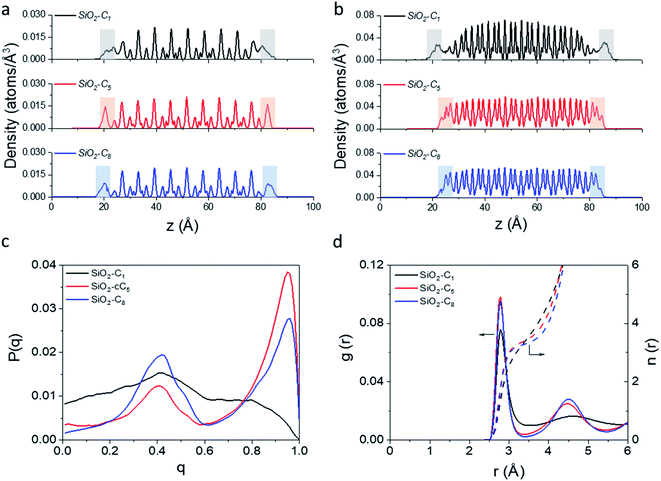
In light of the results obtained in the previous subsection, we will extend our discussion by evaluating the impact of different alkyl ligands on the water interfacial organization with high ligand density and large-pore configurations. In this sense, we constructed two other structural models, one containing trimethylsilane (SiO2-C1) and another one containing cyclopentyl (SiO2-cC5) as surface ligands. A similar analysis of the atomic-level interactions in these models were explored using MD calculations (see Fig. 1c and computational details in the ESI†).As observed previously in the lp-hd SiO2-C8 model (henceforth simply called SiO2-C8), the distribution of the methane and water molecules in the interfacial regions of the newly constructed structural models (cf.Fig. 5a and b) show a clear disruption compared to the bulk of the clathrate phase with the methane molecules being relatively less ordered in the vicinities of the organic ligands, consistent with what we reported in the previous sections. In order to further quantify the degree of interfacial water organization, we also compared the probability distribution of the orientational tetrahedral order parameter (Fig. 5c) in the interfacial region. With respect to the OTO distribution observed in the SiO2-C8 model, the SiO2-C1 model is considerably less ordered, while the SiO2-cC5 model displays a similar OTO pattern, showing a higher degree of organization. This is also confirmed by the RDFs and their respective cumulative distribution function in Fig. 5d, which respectively show a less structured second solvation shell and a smaller number of neighbouring water molecules in the first solvation shell in the clathrate/wall interfacial region of the SiO2-C1 model. This is consistent with Raman spectroscopy measurements which showed a better water organization next to longer alkane chains at low temperatures.53Fig. 5c also unveils a similar local organization of the interfacial water molecules in the SiO2-cC5 and SiO2-C8 structures.
However, while the SiO2-cC5 and SiO2-C8 models exhibit some similarity in terms of the water organisation pattern, the interactions between the alkyl ligands and the interfacial methane molecules are substantially different. The RDFs between the interfacial methane molecules and the carbon atoms of the alkyl chains (Calkyl), shown in Fig. 6a, indicate that the interactions between these species are considerably weaker in the SiO2-C8 model than in the SiO2-cC5 model. This is a very counterintuitive result, as one might imagine that the larger amount of carbon atoms in the octyl chains would imply stronger dispersive interactions with the methane molecules of the clathrate phase. Nevertheless, observing the surface contour plots of Fig. S9,† we can notice that the surface of the SiO2-cC5 slab is much less rugged than the SiO2-C8 surface. This smoother cyclopentyl distribution would be the origin of the stronger interactions between this alkyl group and the CH4 molecules. Such superior performance of cyclopentyl groups in the stabilization of the confined clathrate phase is in line with recent experimental observations confirming the potential of cyclopentane as an efficient clathrate promoter molecule.54–56
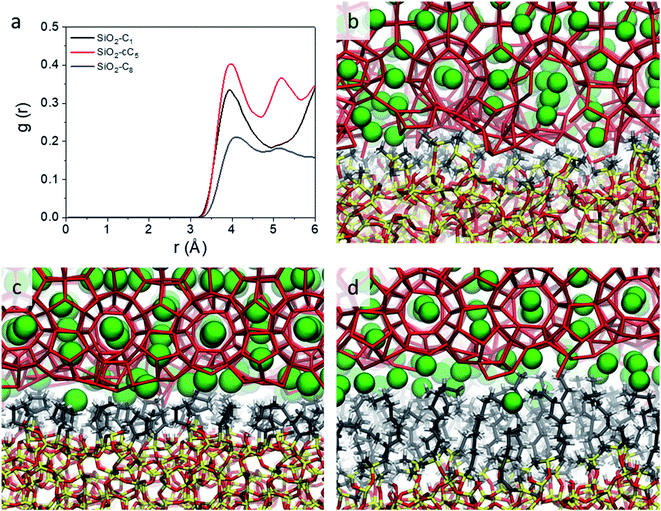 | ||
| Fig. 6 Radial distribution functions representing the CH4–Calkyl interactions (a) and representative snapshots displaying the organization of water and CH4 molecules at the interface of the clathrates in interaction with C1 (b), cC5 (c) and C8 (d) groups. The same colour code as in Fig. 2 is used. | ||
As a consequence of the dissimilar surface roughness and alkyl–CH4 interaction patterns observed in SiO2-C8 and SiO2-cC5, we observed a considerable difference in the CH4 distribution at the clathrate interface. In Fig. 6, one can notice that the CH4 molecules close to the octyl surface are not as well organized as when they are in the vicinity of the cyclopentyl groups, with CH4 having more space to move on the interstices formed by the linear octyl chains. By measuring the mean square displacement of the methane molecules at the clathrate interfaces in contact with the C1, cC5 and C8 ligands (Fig. S10†), we confirmed this much higher mobility of the methane molecules close to the octyl surfaces.
From a practical viewpoint, this is an interesting result. Having a layer of rather mobile methane molecules at the clathrate–solid interface would imply faster CH4 recovery kinetics and also give more room to the introduction of other gases into the clathrate matrix, as recently suggested.57
Comparison with ungrafted SiO2
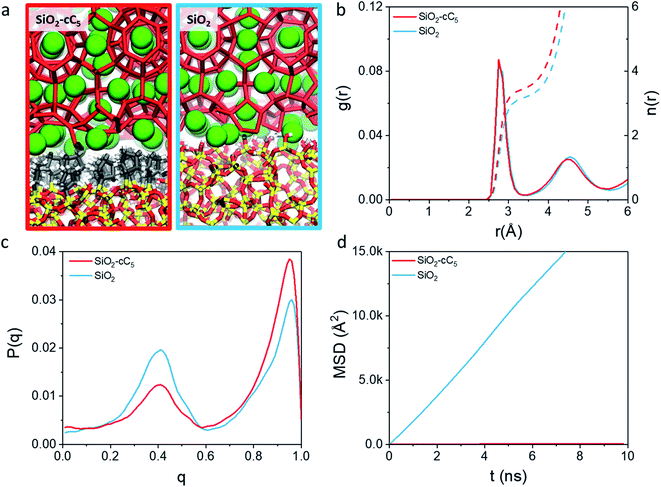
Having analysed the influence of different alkyl groups grafted onto the surfaces of SiO2 pores on the stability of a clathrate matrix, we decided to extend our investigation by studying how a pristine SiO2 surface compares to these hydrophobized silica models in terms of the stabilization of confined clathrate matrices.For this purpose, we analyzed the water organization and CH4 mobility of the clathrate/pore wall interface in the best structural model in terms of clathrate stabilization, i.e. the SiO2-cC5 model, with those obtained in a typical SiO2 slit pore model (cf.Fig. 7a). As seen in the integration of water donor–acceptor (Ow–Ow) RDF curves (Fig. 7b), there is a smaller degree of association among water molecules in the interfacial clathrate/pore wall region of the pristine SiO2 pore. Besides, as observed in the OTO plot (Fig. 7c), the clathrate matrix neighbouring an ungrafted SiO2 model displayed a larger proportion of molecules in a liquid-like organization, with an OTO value close to 0.4. These results show that the clathrate scaffold is considerably better preserved next to a hydrophobic surface compared to the ungrafted structure. Such better preservation of the interfacial clathrate backbone is also reflected in a much smaller CH4 mobility predicted in the SiO2-cC5 model in comparison with the pristine SiO2 model (Fig. 7d).
This further preservation of the clathrate structure next to hydrophobic ligands is explained by the similarity of the hydrogen bond network around hydrophobic and amphiphilic groups (usually referred to as hydrophobic hydration) and the structure of hydrate groups, as confirmed both experimentally and computationally.58–61
Nevertheless, we observed that the interfacial water molecules next to the pristine SiO2 pore showed a higher degree of organization than the one observed in the SiO2-C1 model (cf.Fig. 5c), which suggests that the clathrate-promoting effect of the hydrophobic hydration is very dependent on the alkyl chain length. Besides, the relative preservation of the clathrate scaffold next to the SiO2 surface shows that there is a relative interfacial compatibility of typical SiO2 surfaces and clathrates, as observed elsewhere.25,62
Qualitative implications on clathrate metastability
In the previous sections, we detailed the effects of different hydrophobic surfaces on the organization of the water molecules belonging to interfacial layers of confined clathrates under moderate operating conditions. We related this aspect to the inherent stability of the whole confined clathrate phase. Here, we will reinforce this link between stability and water surface organization by evaluating the preservation of clathrate phases in metastable states under unfavourable external conditions.Bulk clathrates are known for their unexpected stability under conditions out of their structural equilibrium, the so-called “self-preservation” phenomenon.63,64 Similar to what is observed for the clathrate nucleation, confinement effects have shown to further potentialize this phenomenon.65
We decided to emulate such metastable clathrate configurations by carrying out 10 ns long MD calculations at 60 bar and 300 K using the different models listed in the previous sections. This allowed for a qualitative observation of the importance of pore size as well as the density and type of ligands for the preservation of clathrates out of their thermodynamic equilibrium.
Fig. S11† clearly shows a complete melting of the clathrate structure in smaller reversed silica pores regardless of the concentration of grafted ligands. Meanwhile, in larger pores, the clathrate bulk is observed to partially retain its configuration. Comparing the ld and hd configurations of the SiO2-C8 model, we can clearly notice in the former a larger disruption of the clathrate network, with a consequent higher concentration of CH4 molecules at the surface of the C8-grafted silica slab. This is observed on a much larger scale when methyl groups are used as grafting ligands, with the formation of methane bubbles next to the clathrate edges and the preservation of solely a thin clathrate layer at the center of the pore for the SiO2-C1 model. In contrast, in the SiO2-cC5 model, the clathrate structure is completely preserved despite the unfavourable external temperature and pressure conditions.
From these observations, we notice a coincidence of the metastable clathrate stability here and the patterns of water interfacial organization discussed in the previous sections. This, along with our discussions on water organization and interfacial interactions between methane molecules and the ligands, suggests an unequivocal link between pore size/surface ligands and the clathrate stability.
Conclusions
In this work, we constructed molecular models to study the association of clathrate surfaces in reversed phase silica pores. By evaluating the water tetrahedral ordering and RDFs in the vicinities of the pore walls, we observed that pores containing larger pores and a higher density of hydrophobic ligands have a clearer clathrate stabilizing role. Moreover, we ascertained that different hydrophobic linkers may substantially alter the vicinal water microstructure and the CH4 organization. Therefore, ligands with a certain degree of rigidity and displaying a moderate chain length appeared to be more suitable for stabilizing clathrate surfaces. These results provide substantial insights for the experimental conception of new materials allowing the stabilization of clathrates at higher rates and milder temperatures.Conflicts of interest
There are no conflicts to declare.Acknowledgements
The authors acknowledge VLAIO for Moonshot funding (ARCLATH, No. HBC.2019.0110). S. M. J. R. acknowledges the Fund for Scientific Research Flanders (FWO) for a junior postdoctoral fellowship (grant no. 12T3519N). M. H. and E. B. acknowledge FWO Flanders for an FWO-SB fellowship and a research grant (1506118N) respectively. J. A. M. acknowledges the Flemish Government for long-term structural funding (Methusalem) and the European Research Council (ERC) for an Advanced Research Grant under the European Union's Horizon 2020 programme – Grant agreement No. 834134 (WATUSO). V. V. S. acknowledges the ERC for a Consolidator Research Grant under the European Union's Horizon 2020 programme – Grant agreement No. 647755 (DYNPOR) as well as the Research Board of Ghent University (BOF). The computational resources (Stevin Supercomputer Infrastructure) and services used in this work were provided by the VSC (Flemish Supercomputer Centre), funded by Ghent University, the Research Foundation – Flanders (FWO), and the Flemish Government – department EWI.Notes and references
- H. P. Veluswamy, A. Kumar, Y. Seo, J. D. Lee and P. Linga, Appl. Energy, 2018, 216, 262–285 CrossRef CAS.
- E. D. Sloan Jr, Nature, 2003, 426, 353–359 CrossRef PubMed.
- F. Takeuchi, M. Hiratsuka, R. Ohmura, S. Alavi, A. K. Sum and K. Yasuoka, J. Chem. Phys., 2013, 138, 124504 CrossRef PubMed.
- L. Borchardt, M. E. Casco and J. Silvestre-Albero, ChemPhysChem, 2018, 19, 1298–1314 CrossRef CAS PubMed.
- P. J. Herslund, K. Thomsen, J. Abildskov, N. von Solms, A. Galfré, P. Brântuas, M. Kwaterski and J.-M. Herri, Int. J. Greenhouse Gas Control, 2013, 17, 397–410 CrossRef CAS.
- U. Karaaslan and M. Parlaktuna, Energy Fuels, 2000, 14, 1103–1107 CrossRef CAS.
- J. Lee and J. W. Kenney III, Clathrate Hydrates, in Solidification, InTech, 2018 Search PubMed.
- K. Bin Yu and A. O. Yazaydin, J. Phys. Chem. C, 2020, 124, 11015–11022 Search PubMed.
- M. E. Casco, J. Silvestre-Albero, A. J. Ramírez-Cuesta, F. Rey, J. L. Jordá, A. Bansode, A. Urakawa, I. Peral, M. Martínez-Escandell, K. Kaneko and F. Rodríguez-Reinoso, Nat. Commun., 2015, 6, 6432 CrossRef CAS PubMed.
- N. N. Nguyen, M. Galib and A. V. Nguyen, Energy Fuels, 2020, 34, 6751–6760 CrossRef CAS.
- A. A. Bertolazzo, P. M. Naullage, B. Peters and V. Molinero, J. Phys. Chem. Lett., 2018, 9, 3224–3231 CrossRef CAS PubMed.
- T. Head-Gordon, Proc. Natl. Acad. Sci. U. S. A., 1995, 92, 8308–8312 CrossRef CAS PubMed.
- L. Yan, G. Chen, W. Pang and J. Liu, J. Phys. Chem. B, 2005, 109, 6025–6030 CrossRef CAS PubMed.
- L. Borchardt, W. Nickel, M. Casco, I. Senkovska, V. Bon, D. Wallacher, N. Grimm, S. Krause and J. Silvestre-Albero, Phys. Chem. Chem. Phys., 2016, 18, 20607–20614 RSC.
- C. Cuadrado-Collados, G. Mouchaham, L. Daemen, Y. Cheng, A. Ramirez-Cuesta, H. Aggarwal, A. Missyul, M. Eddaoudi, Y. Belmabkhout and J. Silvestre-Albero, J. Am. Chem. Soc., 2020, 142, 13391–13397 CrossRef CAS PubMed.
- D. Kim, Y.-H. Ahn and H. Lee, J. Chem. Eng. Data, 2015, 60, 2178–2185 CrossRef CAS.
- L. Mu, B. Liu, H. Liu, Y. Yang, C. Sun and G. Chen, J. Mater. Chem., 2012, 22, 12246 RSC.
- M. E. Casco, F. Rey, J. L. Jordá, S. Rudić, F. Fauth, M. Martínez-Escandell, F. Rodríguez-Reinoso, E. V. Ramos-Fernández and J. Silvestre-Albero, Chem. Sci., 2016, 7, 3658–3666 RSC.
- Z. Pan, Z. Liu, Z. Zhang, L. Shang and S. Ma, J. Nat. Gas Sci. Eng., 2018, 56, 266–280 CrossRef CAS.
- T. Uchida, T. Ebinuma and T. Ishizaki, J. Phys. Chem. B, 1999, 103, 3659–3662 CrossRef CAS.
- D.-L. Zhong, S.-Y. He, D.-J. Sun and C. Yang, Energy Procedia, 2014, 61, 1573–1576 CrossRef CAS.
- Y. P. Handa and D. Y. Stupin, J. Phys. Chem., 1992, 96, 8599–8603 CrossRef CAS.
- S. A. Bagherzadeh, P. Englezos, S. Alavi and J. A. Ripmeester, J. Phys. Chem. C, 2012, 116, 24907–24915 CrossRef CAS.
- S. Liang, D. Rozmanov and P. G. Kusalik, Phys. Chem. Chem. Phys., 2011, 13, 19856 RSC.
- D. Bai, G. Chen, X. Zhang, A. K. Sum and W. Wang, Sci. Rep., 2015, 5, 12747 CrossRef CAS PubMed.
- S. Baek, J. Min, Y. Ahn, M. Cha and J. W. Lee, Energy Fuels, 2019, 33, 523–530 CrossRef CAS.
- Y. Guo, W. Xiao, W. Pu, J. Hu, J. Zhao and L. Zhang, Langmuir, 2018, 34, 10181–10186 CrossRef CAS PubMed.
- B. O. Carter, W. Wang, D. J. Adams and A. I. Cooper, Langmuir, 2010, 26, 3186–3193 CrossRef CAS PubMed.
- S. Fan, L. Yang, Y. Wang, X. Lang, Y. Wen and X. Lou, Chem. Eng. Sci., 2014, 106, 53–59 CrossRef CAS.
- W. Wang, C. L. Bray, D. J. Adams and A. I. Cooper, J. Am. Chem. Soc., 2008, 130, 11608–11609 CrossRef CAS PubMed.
- D. Bai, G. Chen, X. Zhang and W. Wang, Langmuir, 2011, 27, 5961–5967 CrossRef CAS PubMed.
- Y. Li, M. Chen, H. Song, P. Yuan, D. Liu, B. Zhang and H. Bu, Appl. Clay Sci., 2020, 186, 105439 CrossRef CAS.
- J. Nawrocki, J. Chromatogr. A, 1997, 779, 29–71 CrossRef CAS.
- K. A. Lippa, L. C. Sander and R. D. Mountain, Anal. Chem., 2005, 77, 7852–7861 CrossRef CAS PubMed.
- L. C. Sander, K. A. Lippa and S. A. Wise, Anal. Bioanal. Chem., 2005, 382, 646–668 CrossRef CAS PubMed.
- F. S. Emami, V. Puddu, R. J. Berry, V. Varshney, S. V. Patwardhan, C. C. Perry and H. Heinz, Chem. Mater., 2016, 28, 406–407 CrossRef CAS.
- C. D. Lorenz, E. B. Webb, M. J. Stevens, M. Chandross and G. S. Grest, Tribol. Lett., 2005, 19, 93–98 CrossRef CAS.
- W. L. Jorgensen, D. S. Maxwell and J. Tirado-Rives, J. Am. Chem. Soc., 1996, 118, 11225–11236 CrossRef CAS.
- J. P. Perdew, K. Burke and M. Ernzerhof, Phys. Rev. Lett., 1996, 77, 3865–3868 CrossRef CAS PubMed.
- J. P. Perdew, K. Burke and M. Ernzerhof, Phys. Rev. Lett., 1997, 78, 1396 CrossRef CAS.
- M. M. Francl, W. J. Pietro, W. J. Hehre, J. S. Binkley, M. S. Gordon, D. J. DeFrees and J. A. Pople, J. Chem. Phys., 1982, 77, 3654–3665 CrossRef CAS.
- R. Krishnan, J. S. Binkley, R. Seeger and J. A. Pople, J. Chem. Phys., 1980, 72, 650–654 CrossRef CAS.
- A. D. McLean and G. S. Chandler, J. Chem. Phys., 1980, 72, 5639–5648 CrossRef CAS.
- M. J. Frisch, G. W. Trucks, H. B. Schlegel, G. E. Scuseria, M. A. Robb, J. R. Cheeseman, G. Scalmani, V. Barone, G. A. Petersson, H. Nakatsuji, X. Li, M. Caricato, A. V Marenich, J. Bloino, B. G. Janesko, R. Gomperts, B. Mennucci, H. P. Hratchian, J. V Ortiz, A. F. Izmaylov, J. L. Sonnenberg, D. Williams-Young, F. Ding, F. Lipparini, F. Egidi, J. Goings, B. Peng, A. Petrone, T. Henderson, D. Ranasinghe, V. G. Zakrzewski, J. Gao, N. Rega, G. Zheng, W. Liang, M. Hada, M. Ehara, K. Toyota, R. Fukuda, J. Hasegawa, M. Ishida, T. Nakajima, Y. Honda, O. Kitao, H. Nakai, T. Vreven, K. Throssell, J. A. Montgomery Jr, J. E. Peralta, F. Ogliaro, M. J. Bearpark, J. J. Heyd, E. N. Brothers, K. N. Kudin, V. N. Staroverov, T. A. Keith, R. Kobayashi, J. Normand, K. Raghavachari, A. P. Rendell, J. C. Burant, S. S. Iyengar, J. Tomasi, M. Cossi, J. M. Millam, M. Klene, C. Adamo, R. Cammi, J. W. Ochterski, R. L. Martin, K. Morokuma, O. Farkas, J. B. Foresman and D. J. Fox, Gaussian Inc., Wallingford CT, 2016.
- J. L. F. Abascal, E. Sanz, R. García Fernández and C. Vega, J. Chem. Phys., 2005, 122, 234511 CrossRef CAS PubMed.
- M. G. Martin and J. I. Siepmann, J. Phys. Chem. B, 1998, 102, 2569–2577 CrossRef CAS.
- S. Plimpton, J. Comput. Phys., 1995, 117, 1–19 CrossRef CAS.
- W. G. Hoover, Phys. Rev. A, 1986, 34, 2499–2500 CrossRef PubMed.
- S. Nosé, J. Chem. Phys., 1984, 81, 511–519 CrossRef.
- V. K. Michalis, J. Costandy, I. N. Tsimpanogiannis, A. K. Stubos and I. G. Economou, J. Chem. Phys., 2015, 142, 044501 CrossRef PubMed.
- P. S. R. Prasad, B. S. Kiran and K. Sowjanya, RSC Adv., 2020, 10, 17795–17804 RSC.
- R. W. Hockney and J. W. Eastwood, Computer Simulation Using Particles, IOP Publishing Ltd, 1st edn, 1988 Search PubMed.
- J. G. Davis, K. P. Gierszal, P. Wang and D. Ben-Amotz, Nature, 2012, 491, 582–585 CrossRef CAS PubMed.
- J. Zhang, P. Yedlapalli and J. W. Lee, Chem. Eng. Sci., 2009, 64, 4732–4736 CrossRef CAS.
- L. C. Ho, P. Babu, R. Kumar and P. Linga, Energy, 2013, 63, 252–259 CrossRef CAS.
- J. Zheng, B.-Y. Zhang, Q. Wu and P. Linga, ACS Sustainable Chem. Eng., 2018, 6, 11913–11921 CrossRef CAS.
- M. Cha, K. Shin, H. Lee, I. L. Moudrakovski, J. A. Ripmeester and Y. Seo, Environ. Sci. Technol., 2015, 49, 1964–1971 CrossRef CAS PubMed.
- F. Jiménez-Ángeles and A. Firoozabadi, ACS Cent. Sci., 2018, 4, 820–831 CrossRef PubMed.
- N. Galamba, J. Phys. Chem. B, 2013, 117, 2153–2159 CrossRef CAS PubMed.
- N. Galamba, J. Phys. Chem. B, 2014, 118, 4169–4176 CrossRef CAS PubMed.
- J. Grdadolnik, F. Merzel and F. Avbelj, Proc. Natl. Acad. Sci. U. S. A., 2017, 114, 322–327 CrossRef CAS PubMed.
- Z. He, P. Linga and J. Jiang, Langmuir, 2017, 33, 11956–11967 CrossRef CAS PubMed.
- C. Giavarini and F. Maccioni, Ind. Eng. Chem. Res., 2004, 43, 6616–6621 CrossRef CAS.
- L. A. Stern, S. Circone, S. H. Kirby and W. B. Durham, J. Phys. Chem. B, 2001, 105, 1756–1762 CrossRef CAS.
- S. Y. Misyura, Sci. Rep., 2016, 6, 30324 CrossRef CAS PubMed.
Footnote |
| † Electronic supplementary information (ESI) available: Modelling and simulation strategies adopted for the reversed silica and clathrate microscopic models. See DOI: 10.1039/d1ta03105h |
| This journal is © The Royal Society of Chemistry 2021 |

