Platinum-free photoelectrochromic devices working with copper-based electrolytes for ultrastable smart windows†
Luca
Lavagna
 ab,
George
Syrrokostas
 c,
Lucia
Fagiolari
 a,
Julia
Amici
 ab,
Carlotta
Francia
 ab,
Silvia
Bodoardo
 ab,
George
Leftheriotis
 *c and
Federico
Bella
 *ab
*ab
aDepartment of Applied Science and Technology, Politecnico di Torino, Corso Duca degli Abruzzi 24, 10129 Torino, Italy. E-mail: federico.bella@polito.it
bNational Interuniversity Consortium of Material Science and Technology (INSTM), Via Giuseppe Giusti 9, 50121 Firenze, Italy
cPhysics Department, Renewable Energy Lab, University of Patras, 26500 Rion, Greece. E-mail: glefther@physics.upatras.gr
First published on 18th June 2021
Abstract
Photoelectrochromic systems are devices designed for large-scale manufacturing of smart windows, capable of changing their transmittance according to external environmental conditions. This communication proposes the replacement of the two most critical photoelectrochemical device components studied so far, namely the counter electrode and the redox mediator. Regarding the first, graphene nanoplatelets are used to replace platinum, maintaining both its optical and electrocatalytic properties, and at the same time reducing the device cost. Secondly, a copper-based redox pair was chosen to solve the corrosion problems typically encountered with the iodine-based mediator. The combination of the above components led to devices with high performance (coloration speeds in the order of seconds, with a maximum contrast ratio of 10.4![[thin space (1/6-em)]](https://www.rsc.org/images/entities/char_2009.gif) :
:![[thin space (1/6-em)]](https://www.rsc.org/images/entities/char_2009.gif) 1), as well as the achievement of a long-term stability record (over 400 days) for these photoelectrochromic systems.
1), as well as the achievement of a long-term stability record (over 400 days) for these photoelectrochromic systems.
Introduction
Smart windows, as particular glazing components able to tune the quantity of light and heat transmitted in a building, thus alleviating air conditioning costs, are becoming indispensable when designing new urban or industrial areas.1–6 To this purpose, photoelectrochromic devices (PECDs), as a commingling of a dye-sensitized solar cell (DSSC) and an electrochromic device (ECD), represent one of the most reliable technologies for smart windows development.7–9 They are generally fabricated placing a dye-covered nanostructured TiO2 layer over a porous WO3 anode deposited onto a conductive glass, while the counter electrode (CE) is a thin platinum film and the electrolyte is a I−/I3− solution containing lithium salts as additives.10,11 The working principle of this device is based on sunlight absorption by chemisorbed dye molecules, followed by electron injection into the conduction band of TiO2, electron diffusion into WO3 and simultaneous intercalation of Li+ in the latter.12,13 As a result, WO3 switches from transparent to blue color and, if the irradiance is attenuated or the device is short-circuited, the transparency is reversibly regenerated.14Although the scientific community has worked hard to develop new materials for PECDs in the last 10 years,15,16 also including the integration with perovskite-based photovoltaics17 and large-area deposition techniques,18 two major limitations are still present and constitute a relevant obstacle for the scale-up of this technology. The first is related to the use of critical raw materials or expensive elements, such as platinum (used as a PECD and ECD CE)19 or cobalt (used for high voltage DSSC electrolytes).20 The second limitation concerns the long-term stability, mainly affected by the evaporation of the organic solvents-based liquid electrolyte and the degradation of photosensitive components present in the cell (e.g., molecular sensitizer, iodine-based redox shuttle, etc.).21–23
With the aim of designing efficient, stable and cobalt/platinum-free PECDs, we identified graphene nanoplatelets (GNPs) and copper complexes as key components, both of them never explored before in this field. GNPs are raising a huge interest in the materials science field due to their superior mechanical, thermal and barrier properties, ascribed to their peculiar high aspect ratio and plate-like shape.24–26 In PECDs, GNPs could represent a winning choice as platinum-free CEs, guaranteeing good electrical conductivity and electrocatalytic activity for the redox couple regeneration and electrons transport, as recently demonstrated in the DSSCs field.27,28 As regards tetra-coordinated copper(I/II) complexes, they revolutionized the DSSCs field due to their unique characteristics as redox shuttles, i.e. high open-circuit voltage (Voc, >1 V) and fast regeneration at low driving force, due to a minimized internal reorganization energy derived from the preservation of the complex geometry during the change of oxidation state.29–31 In this study, we demonstrate an extremely efficient PECD exploiting GNPs as the cathodic material and Cu(dmp)2TFSI/Cu(dmp)2(TFSI)2 as redox shuttle; a record long-term stability exceeding 400 days was achieved by jellifying the redox mediator in poly(ethylene oxide) (PEO), thus avoiding liquid electrolyte leakage and easing device fabrication at the same time.
Results and discussion
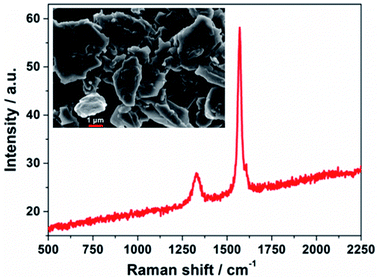
PECDs were prepared through three steps. First, TiO2/WO3 mesoporous electrodes were fabricated, where a WO3 layer (≈75% transmittance in the visible range, thickness between 400 and 600 nm, packing density calculated of 0.795) was partially covered with a TiO2 film (thickness = 8 μm). 3-{6-{4-[bis(2′,4′-dihexyloxybiphenyl-4-yl)amino-]phenyl}-4,4-dihexyl-cyclopenta-[2,1-b:3,4-b′]dithiphene-2-yl}-2-cyanoacrylic acid (Y123 dye) was chosen as metal-free molecule to sensitize the TiO2 film. Second, bis-(2,9-dimethyl-1,10-phenanthroline)copper(I) bis(trifluoromethanesulfonyl)imide (Cu(dmp)2TFSI) and bis-(2,9-dimethyl-1,10-phenanthroline)copper(II) bis(bis(trifluoromethanesulfonyl)imide) (Cu(dmp)2(TFSI)2) were chosen as reduced and oxidized species of the copper-based redox mediator, respectively. Their concentration in acetonitrile was fixed at 0.10 and 0.03 M, respectively, while 4-tert-butylpyridine 0.20 M and lithium bis(trifluoromethanesulfonyl)imide 0.20 M were used as additives. The so-obtained liquid electrolyte was jellified by PEO, added at a concentration equal to 45 wt%, and spread onto the TiO2/WO3 electrode. Third, CEs were prepared by slowly dispensing a dilute GNPs suspension onto conductive glasses, followed by a drying process. The dimension of the resulting devices was 3.0 × 4.0 cm2; the two electrodes were arranged facing each other, slightly displaced along their longitudinal axis to preserve space for electrical contacts. A thermoplastic film with a thickness equal to 25 μm was placed between the two electrodes in order to peripherally seal the PECD.GNPs successfully and homogeneously covered the conductive glass, remaining rather invisible at human eye and preserving the PECD transmittance. The field emission scanning electron microscopy (FESEM) micrograph, shown in the inset of Fig. 1, depicts a GNPs morphology characterized by the presence of few single/multi-layer sheets and agglomerates of sheets, the dimensions of which are in good agreement with the data reported by the supplier.32 The Raman spectrum (Fig. 1) presents two characteristic bands, namely the D-band at ≈1300 cm−1, arising from the disorder-induced phonon mode (A1g-band), and the G-band at ≈1600 cm−1, assigned to the Raman-allowed phonon mode (E2g-band). For graphitic materials, the ratio of the D and G band intensities (ID/IG) decreases with the degree of order of the graphitic structure;33 however, for very small in-plane correlation length (<20 Å), corresponding to small hexagonally ordered carbon clusters, the ID/IG ratio decreases again, reaching zero. After baseline correction and peak deconvolution, an average ID/IG = 0.54 was calculated for our samples. Zeta potential measurements led to a value equal to −12.9 ± 0.2 mV, indicative of good stability for a colloidal system. As regards the hydrodynamic size, a value of 2502 ± 13 nm was determined. The thermal stability of the GNPs after deposition is shown in Fig. S1.†
 | ||
| Fig. 1 Raman spectrum of GNPs used as CE material. Inset: FESEM micrograph of GNPs onto the PECD conductive glass, just after deposition and solvent evaporation. | ||
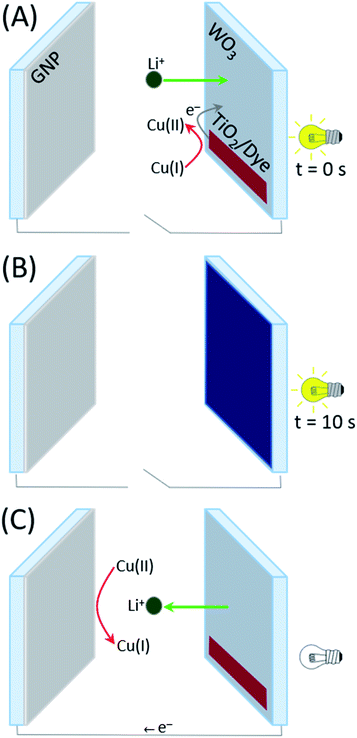
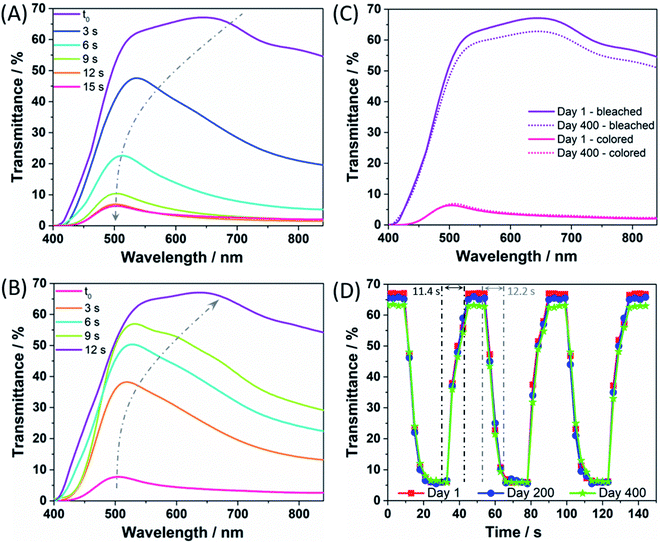
After assembly, the coloration and bleaching processes were carried out by repeatedly illuminating the PECD in open-circuit conditions and keeping it short-circuited in the dark, respectively. The overall schematic diagram of the PECD is given in Fig. 2 for both open- and short-circuit conditions. The PECD showed a fast coloration step, i.e. its transmittance was halved after just 5 s of exposure under simulated sunlight, as shown in Fig. 3A. The bleaching process – with reference to Fig. 3B – was rather rapid as well, even during the first cycles when the devices typically have to reach equilibrium conditions (e.g., when complete wettability of the WO3 electrode by the electrolyte is achieved).
The light response of the PECD in the visible range was studied under an illumination of 1000 W m−2, and Fig. 3C shows the transmittance spectra under bleached and colored conditions, respectively. At the first cycle, the highest transmittance value was 67.1% when bleached, while it decreased up to 5.5% at 530 nm when colored. The PECD was cycled 5 times per day from Monday to Friday for 400 days, i.e. the longest ever reported ageing test for PECDs – to the best of our knowledge (a detailed comparison is given in Table S1†); between measurements, the devices were kept in open-circuit conditions onto laboratory benches. After 400 days of activity, no significant degradation was detected for transmittance modulation, i.e. the final bleached/colored values were 62.8% and 6.0%, respectively, implying a robust cycle stability of the device and a very slight decrease of transmittance under bleached conditions, due to minor device fabrication defects (typical of lab-scale prototypes). Data shown in Fig. 3C refer to the best PECD over a batch of 5 prototypes; anyway, the chosen device well represents the overall trend, for which the average transmittance values at day 400 were 61.1 ± 1.7% and 5.7 ± 0.3% under bleached and colored conditions, respectively.
When assessing the performance of PECDs, the response time represents a key figure of merit, measured by adjusting the circuit open and closed for a fixed amount of time under continuous illumination. Fig. 3D shows that the response time for the PECD was around 12 s for the coloring process, while the bleaching step took ≈11 s. The experiment was repeated in a long-term stability test and the response time profiles detected after 200 and 400 days are also shown in the plot. Overall, no significant performance degradation was found (in agreement with Fig. 3C), thus consolidating the excellent stability of the newly proposed copper- and GNPs-based redox shuttle and CE for PECDs application, respectively.
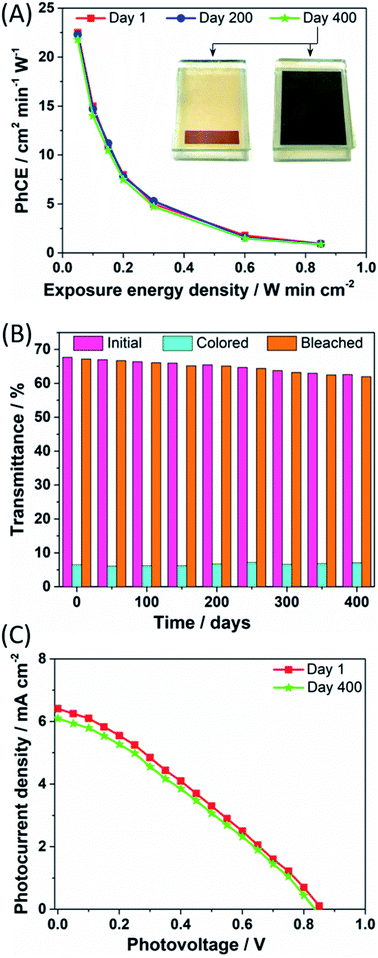
Photocoloration efficiency (PhCE), i.e. the change in the optical density of the PECD per unit light intensity applied per minute, was calculated during the coloration process and the results are shown in Fig. 4A. The highest value occurred during the first seconds, then PhCE values showed a gradual drop, overall indicating that the PECD underwent a rapid coloration process in a relative short exposure time. Indeed, the particular form of the PhCE curves is directly related to the coloration kinetics. As it can be seen in Fig. 3A, coloration progresses fast in the first few seconds of exposure. However, the rate of coloration decreases progressively as the WO3 film gets saturated with lithium ions, while the incoming energy density (denominator) continuously increases with time. Thus, PhCE also exhibits a continuous reduction with time. The evolution of PhCE values upon time was consistent with the long-term stability data previously discussed. The inset images represent the corresponding pictures taken under bleached and colored states, respectively.
The change in luminous transmittance of the PECD in its transparent, fully colored and bleached states versus days post fabrication is shown in Fig. 4B. A very limited gradual decrease in the color depth of the devices over time was detected, being – to the best of our knowledge – superior in terms of stability compared to all the previously published PECD ageing tests.7–11 Besides minimal imperfections occurring during device assembly, the soft lowering in performance could be attributed to the progressive penetration of the copper-based electrolyte in the WO3/TiO2 electrode. If – on the one hand – this improves the PECD working area, it also enhances recombination phenomena between the oxidized species of the redox shuttle with the electrons of the semiconductor conduction band, thus lowering the overall PECD performance. The quality of the GNPs-based CE was preserved upon the whole ageing test, as shown by the FESEM micrographs (Fig. S2†) recorded after cell disassembly.
The photocurrent density vs. photovoltage curves for the DSSC portion of the PECD were measured under simulated sunlight (AM 1.5G, 1 sun), and the resulting plots at days 1 and 400 are shown in Fig. 4C. An overall power conversion efficiency (PCE) of 2.43% was measured just after device fabrication, with Voc, short-circuit current density (Jsc) and fill factor (FF) equal to 0.86 V, 6.41 mA cm−2 and 44%, respectively. Overall, the J–V can be considered satisfactory, considering the fact that the TiO2-based photoanodes were annealed at a low temperature, i.e. 120 °C, in order to preserve the quality of the underlying WO3 electrode (their FESEM images and X-ray diffraction spectra are shown in Fig. S3 and S4,† respectively). Also, the molar concentration of the reduced and oxidized species of the redox shuttle were kept at 0.10 and 0.03 M, respectively, i.e. lower than those commonly adopted in the DSSCs field,29–31 in order to achieve high transparency of the PECD in the bleached state. The DSSC performance were kept rather stable (≈95%) upon ageing, with PCE, Voc, Jsc and FF values equal to 2.13%, 0.83 V, 6.10 mA cm−2 and 42%, respectively. Furthermore, given that DSSCs typically show very good operation under diffused sunlight, we carried out the transient transmittance response time study for the PECD under 0.5 sun. The plot shown in Fig. S5† clearly highlights that the coloration kinetics was slightly lowered when halving the sun simulator power output, but the PECD was able to reach the same colored state with a rather low delay, i.e. 9 s.
Conclusions
PECDs manufactured with GNPs CEs and copper-based redox electrolytes have made it possible to overcome the use of platinum and iodine, respectively, thus solving two of the main drawbacks of this renewable energy-related technology, in terms of corrosion resistance and use of cheaper/abundant raw materials.The fabricated PECDs exhibit an excellent performance combining a very fast coloration speed and an outstanding contrast ratio of 10.4![[thin space (1/6-em)]](https://www.rsc.org/images/entities/char_2009.gif) :
:![[thin space (1/6-em)]](https://www.rsc.org/images/entities/char_2009.gif) 1. Furthermore, a record stability exceeding 400 days was reached, thus confirming the proper choice of the novel PECD components, included the jellification of the copper-based redox couple solution to avoid evaporation issues. The present findings pave the way to platinum-free smart windows suitable for energy saving applications, and the road towards the 70% transmittance target for building-integrated products is getting closer.
1. Furthermore, a record stability exceeding 400 days was reached, thus confirming the proper choice of the novel PECD components, included the jellification of the copper-based redox couple solution to avoid evaporation issues. The present findings pave the way to platinum-free smart windows suitable for energy saving applications, and the road towards the 70% transmittance target for building-integrated products is getting closer.
Conflicts of interest
The authors declare no competing financial interest.References
- H. Zhang, J. Hao, X. Yu, J. Wu, J. Li, M. H. Li and J. Hu, J. Mater. Chem. A, 2020, 8, 17800–17807 RSC.
- S. J. Lee, S. H. Lee, H. W. Kang, S. Nahm, B. H. Kim, H. Kim and S. H. Han, Chem. Eng. J., 2021, 416, 129028 CrossRef CAS.
- Y. Zhou, X. Dong, Y. Mi, F. Fan, Q. Xu, H. Zhao, S. Wang and Y. Long, J. Mater. Chem. A, 2020, 8, 10007–10025 RSC.
- A. K. Chowdhary and D. Sikdar, Sol. Energy Mater. Sol. Cells, 2021, 222, 110921 CrossRef CAS.
- S. Huang, Q. Zhang, F. Yang, D. T. Gangadharan, P. Li, F. Ren, B. Sun and D. Ma, J. Mater. Chem. A, 2020, 8, 8620–8628 RSC.
- S. W. Oh, S. M. Nam, S. H. Kim, T. H. Yoon and W. S. Kim, ACS Appl. Mater. Interfaces, 2021, 13, 5028–5033 CrossRef CAS PubMed.
- A. Cannavale, P. Cossari, G. E. Eperon, S. Colella, F. Fiorito, G. Gigli, H. J. Snaith and A. Listorti, Energy Environ. Sci., 2016, 9, 2682–2719 RSC.
- A. Dokouzis, F. Bella, K. Theodosiou, C. Gerbaldi and G. Leftheriotis, Mater. Today Energy, 2020, 15, 100365 CrossRef.
- A. Dokouzis, D. Zoi and G. Leftheriotis, Materials, 2020, 13, 2565 CrossRef CAS PubMed.
- A. Cannavale, F. Martellotta, F. Fiorito and U. Ayr, Energies, 2020, 13, 1929 CrossRef CAS.
- Z. Tong, Y. Tian, H. Zhang, X. Li, J. Ji, H. Qu, N. Li, J. Zhao and Y. Li, Sci. China: Chem., 2017, 60, 13–37 CrossRef CAS.
- Z. Wang, H. C. Chiu, A. Paolella, K. Zaghib and G. P. Demopoulos, ChemSusChem, 2019, 12, 2220–2230 CrossRef CAS.
- C. Costa, I. Mesquita, L. Andrade and A. Mendes, Electrochim. Acta, 2016, 219, 99–106 CrossRef CAS.
- A. Kolay, N. T. Z. Potts, K. Sardar, E. A. Gibson and M. Deepa, Sustainable Energy Fuels, 2019, 3, 514–528 RSC.
- E. Pulli, E. Rozzi and F. Bella, Energy Convers. Manage., 2020, 219, 112982 CrossRef.
- F. G. Cai, D. Zhou, Q. Q. Xiong, J. H. Zhang, X. L. Wang, C. D. Gu and J. P. Tu, Sol. Energy Mater. Sol. Cells, 2013, 117, 231–238 CrossRef.
- X. Xia, Z. Ku, D. Zhou, Y. Zhong, Y. Zhang, Y. Wang, M. J. Huang, J. Tu and H. J. Fan, Mater. Horiz., 2016, 3, 588–595 RSC.
- G. Cai, P. Darmawan, X. Cheng and P. S. Lee, Adv. Energy Mater., 2017, 7, 1602598 CrossRef.
- S. Yun, P. D. Lund and A. Hinsch, Energy Environ. Sci., 2015, 8, 3495–3514 RSC.
- N. Mariotti, M. Bonomo, L. Fagiolari, N. Barbero, C. Gerbaldi, F. Bella and C. Barolo, Green Chem., 2020, 22, 7168–7218 RSC.
- F. Bella, A. Lamberti, A. Sacco, S. Bianco, A. Chiodoni and R. Bongiovanni, J. Membr. Sci., 2014, 470, 125–131 CrossRef CAS.
- M. Gerosa, A. Sacco, A. Scalia, F. Bella, A. Chiodoni, M. Quaglio, E. Tresso and S. Bianco, IEEE J. Photovoltaics, 2016, 6, 498–505 Search PubMed.
- R. Shanti, F. Bella, Y. S. Salim, S. Y. Chee, S. Ramesh and K. Ramesh, Mater. Des., 2016, 108, 560–569 CrossRef CAS.
- M. Bahiraei and N. Mazaheri, Energy, 2021, 218, 119395 CrossRef CAS.
- A. D. Pendergast, Z. Deng, F. Maroun, C. Renault and J. E. Dick, ACS Nano, 2021, 15, 1250–1258 CrossRef CAS PubMed.
- R. Moreno Araújo Pinheiro Lima and H. P. de Oliveira, J. Energy Storage, 2020, 28, 101284 CrossRef.
- D. H. Kweon and J. B. Baek, Adv. Mater., 2019, 31, 1804440 CrossRef PubMed.
- C. K. Kim, H. M. Kim, M. Aftabuzzaman, I. Y. Jeon, S. H. Kang, Y. K. Eom, J. B. Baek and H. K. Kim, Mater. Today Energy, 2018, 9, 67–73 CrossRef.
- Y. Saygili, M. Stojanovic, H. Michaels, J. Tiepelt, J. Teuscher, A. Massaro, M. Pavone, F. Giordano, S. M. Zakeeruddin, G. Boschloo, J. E. Moser, M. Grätzel, A. B. Muñoz-García, A. Hagfeldt and M. Freitag, ACS Appl. Energy Mater., 2018, 1, 4950–4962 CrossRef CAS.
- Y. Wang and T. W. Hamann, Chem. Commun., 2018, 54, 12361–12364 RSC.
- Y. Saygili, M. Söderberg, N. Pellet, F. Giordano, Y. Cao, A. B. Munoz-García, S. M. Zakeeruddin, N. Vlachopoulos, M. Pavone, G. Boschloo, L. Kavan, J. E. Moser, M. Grätzel, A. Hagfeldt and M. Freitag, J. Am. Chem. Soc., 2016, 138, 15087–15096 CrossRef CAS PubMed.
- Graphene Nanoplatelets by Cheaptubes, accessed May 2021, https://www.cheaptubes.com/product-category/graphene-nanoplatelets.
- M. S. Dresselhaus, A. Jorio and R. Saito, Annu. Rev. Condens. Matter Phys., 2010, 1, 89–108 CrossRef CAS.
Footnote |
| † Electronic supplementary information (ESI) available. See DOI: 10.1039/d1ta03544d |
| This journal is © The Royal Society of Chemistry 2021 |


