 Open Access Article
Creative Commons Attribution 3.0 Unported Licence
Ca4Sb2O and Ca4Bi2O: two promising mixed-anion thermoelectrics†
Warda
Rahim
 *ab,
Jonathan M.
Skelton
 c and
David O.
Scanlon
 abd
abd
aDepartment of Chemistry, University College London, 20 Gordon Street, London, WC1H 0AJ, UK. E-mail: d.scanlon@ucl.ac.uk
bThomas Young Centre, University College London, Gower Street, London, WC1E 6BT, UK
cDepartment of Chemistry, University of Manchester, Oxford Road, Manchester, M13 9PL, UK
dDiamond Light Source Ltd., Diamond House, Harwell Science and Innovation Campus, Didcot, Oxfordshire, OX11 0DE, UK
First published on 2nd August 2021
Abstract
The environmental burden of fossil fuels and the rising impact of global warming have created an urgent need for sustainable clean energy sources. This has led to widespread interest in thermoelectric (TE) materials to recover part of the ∼60% of global energy currently wasted as heat as usable electricity. Oxides are particularly attractive as they are thermally stable, chemically inert, and formed of earth-abundant elements, but despite intensive efforts there have been no reports of oxide TEs matching the performance of flagship chalcogenide materials such as PbTe, Bi2Te3 and SnSe. A number of ternary X4Y2Z mixed-anion systems, including oxides, have predicted band gaps in the useful range for several renewable-energy applications, including as TEs, and some also show the complex crystal structures indicative of low lattice thermal conductivity. In this study, we use ab initio calculations to investigate the TE performance of two structurally-similar mixed-anion oxypnictides, Ca4Sb2O and Ca4Bi2O. Electronic-structure and band-alignment calculations using hybrid density-functional theory (DFT), including spin–orbit coupling, suggest that both materials are likely to be p-type dopable with large charge-carrier mobilities. Lattice-dynamics calculations using third-order perturbation theory predict ultra-low lattice thermal conductivities of ∼0.8 and ∼0.5 W m−1 K−1 above 750 K. Nanostructuring to a crystal grain size of 20 nm is predicted to further reduce the room temperature thermal conductivity by around 40%. Finally, we use the electronic- and thermal-transport calculations to estimate the thermoelectric figure of merit ZT, and show that with p-type doping both oxides could potentially serve as promising earth-abundant oxide TEs for high-temperature applications.
1 Introduction
Recovering the ∼60% of global energy currently wasted as heat is critical to tackling the environmental and economic issues emerging from climate change. Despite years of research in the field, current state-of-the-art thermoelectrics (TEs) are not suitable for widespread commercial use due to either a low efficiency or compositions based on rare or toxic elements such as lead and tellurium.1,2 Their use has therefore been largely confined to niche applications, e.g. in batteries to power space equipment or in electronic cooling.3,4 The thermoelectric efficiency of a material is commonly defined using the dimensionless figure of merit ZT = S2σT/κ where S is the Seebeck coefficient, σ is the electrical conductivity, T is the absolute temperature, and κ is the sum of the electronic and lattice thermal conductivity κe + κl. One of the biggest challenges in the field is thus the discovery of new materials with the required balance of physical properties to obtain a high ZT.5 The ZT can be enhanced either by optimising the electronic transport properties or by minimizing the lattice thermal conductivity. Doping and band-engineering techniques, either to tune the carrier effective masses or to increase the valley degeneracy, are often employed to optimise the electrical properties.6–10 The interdependency of S, σ and κe however makes this quite a complex task. The dominant thermal transport mechanism in semiconductors is through the phonons (i.e. κl), and high-performance TEs therefore tend to be materials with low intrinsic lattice thermal conductivity. To reduce κl further, nanostructuring, for example by grain-size engineering, can be employed to scatter phonons with medium and long mean free paths to increase the overall thermal resistance.1,11–13 However, this usually fails to scatter the phonons with short and long mean free paths, which has led to the concept of multi-scale “hierarchical” materials-engineering strategies to scatter phonons on different length scales.14A viable mass-market thermoelectric needs to be cost-effective, stable under the temperature gradients in operating devices, should maintain a high average ZT over a wide operating temperature range, and should be chemically inert to avoid the risk of device deterioration and to avoid problems with end-of-life disposal. The current industry-standard thermoelectric materials, which include PbTe, PbSe and Bi2Te3, contain rare or toxic elements.15–17 However, many promising alternatives have failed to succeed them due to poor thermal stability.18,19 Given these requirements, there has been much effort focused toward oxides, as these often show the required thermal and chemical stability, are easy to synthesise, and are formed of earth-abundant and non-toxic elements.20,21 Though there has been considerable progress in this area, the maximum ZT of even the best materials remain quite low compared to other thermoelectrics, typically due to a moderate electrical conductivity and/or a high thermal conductivity.22,23 Recently, we reported the promising thermoelectric properties of the room temperature polymorph of Bi2Sn2O7, which we found to have an ultralow intrinsic lattice thermal conductivity of ∼0.4 W m−1 K−1 and a ZT of 0.18 with n-type doping.24 Although this ZT is the highest ever obtained for an oxide material at room temperature, Bi2Sn2O7 may not be suitable for high-temperature applications as it undergoes a phase transition above 390 K.
It is also noteworthy that both n- and p-type materials with high thermoelectric figures of merit are needed to form a TE couple, and oxides are in general usually not p-type dopable.25 However, systems which contain O2− and another anion, for example BiCuOSe, show good p-type dopability and have emerged as promising p-type thermoelectrics.26–28 In a recent computational study,29 X4Y2Z mixed-anion compounds (X = Mg, Ca, Sr, Ba; Y = P, As, Sb, Bi; and Z = S, Se, Te) have been predicted to possess band gaps in the range suitable for many renewable-energy applications including as thermoelectrics. The study also revealed high band degeneracies, indicative of high power factors, and the complex crystal structures were found to yield low lattice thermal conductivities, with the room temperature κl of Ba4Sb2Se being comparable to the flagship thermoelectric SnSe.30,31 Moreover, quite recently ferroelectric and antiferroelectric behaviours and applications to ferroelectric photovoltaics have been reported for this family of anti-Ruddlesden–Popper phases.32 Inspired by this, we have investigated the p-type thermoelectric properties of two experimentally-reported mixed-anion oxypnictides with similar composition, viz. Ca4Sb2O and Ca4Bi2O.
Ca4Sb2O and Ca4Bi2O are isotypes of the anti-K2NiF4 structure type, belonging to the series of compounds A4M2O (A = Ca, Sr, Ba; M = P, As, Sb, Bi).34–36 Both compounds crystallise into a body-centred tetragonal structure with the I4/mmm space group (139), which is illustrated in Fig. 1. The crystal structure can be considered as an infinite network of layers comprising oxygen-centred Ca octahedra stacked along the c-axis in an ABAB fashion. The structure consists of two crystallographically unique Ca sites with different coordination environments: the Ca1 site is surrounded by four coplanar M ions (M = Sb/Bi) and two O ions, and the Ca2 site is surrounded by four equidistant M ions, one apical M ion and one O ion. Ca2 forms a stronger (shorter) bond to the apical M anion compared to those in the equatorial plane, which results in the Ca2–O bond being longer than the Ca1–O bond. This complex crystal structure and inhomogenous bonding could lead to large phonon anharmonicity and thus low lattice thermal conductivity. Moreover, the presence of the heavy elements Sb and Bi will result in low group velocities and weak chemical bonding within the structures, features which both often predicate low κl. In addition, the low-frequency vibrations of these weakly-bonded heavy atoms are likely to enable a high density of scattering channels for the acoustic phonon modes which, provided these modes make the largest contribution to the κl, should result in enhanced thermal resistance.
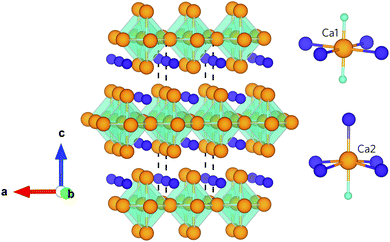 | ||
| Fig. 1 Crystal structure of Ca4Sb2O and Ca4Bi2O showing the O-centred Ca octahedra stacked along the crystallographic c axis. The insets show the coordination polyhedra around the two distinct Ca atoms. The atoms are coloured as follows: Ca – orange, O – cyan, Sb/Bi – purple. The images were generated using the VESTA software.33 | ||
In this work, we investigate the electronic structure and transport properties using hybrid density-functional theory (DFT) with spin–orbit coupling and we study the lattice thermal transport using lattice-dynamics calculations. We find good agreement between our electronic density of states (DoS) calculations and previous work by Xia et al.36 with the valence band maxima and conduction band minima consisting predominantly of Sb/Bi p-states and Ca 3d states respectively. Both materials are found to have favourable electrical properties for thermoelectric applications, with low carrier effective masses and suitable band gaps, and an assessment of the valence band energies indicate native p-type semiconducting behaviour. Thermal-conductivity calculations show that the acoustic modes and low-frequency optic modes primarily responsible for the bulk of thermal transport in both structures are short-lived, leading to ultra-low κl. These short lifetimes are found to arise from both a high density of low-frequency optic phonon modes, providing a large number of energy-conserving scattering channels, together with strong phonon–phonon interactions. To the best of our knowledge this represents the first comprehensive investigation of the electronic and thermal transport properties of Ca4Sb2O and Ca4Bi2O, and the fundamental understanding from this modelling study will help to provide guiding principles to identify and improve oxide-based TEs suitable for widespread use.
2 Computational methodology
Our calculations were performed within the framework of pseudopotential plane-wave DFT as implemented in the Vienna Ab initio Simulation Package (VASP) code.37–40 Projector augmented wave (PAW) pseudopotentials41,42 were used to describe the core electrons, with Ca 3s23p64s2, Sb 5s25p3, Bi 5d106s26p3 and O 2s22p4 electrons treated as valence. Explicit convergence testing with criteria of 5 meV per atom for the plane-wave kinetic-energy cutoff and 1 meV per atom for the k-point sampling mesh suggested a 400 eV cutoff for both structures and Γ-centred k-point meshes with 5 × 5 × 7 and 5 × 5 × 6 subdivisions for Ca4Sb2O and Ca4Bi2O respectively (Fig. S1†). During the geometry optimisations the cutoff was increased to 520 eV to avoid Pulay stress.43 The cell parameters and atomic positions were fully relaxed using the variant of the Perdew–Burke–Ernzerhof (PBE)44 generalised-gradient approximation functional for solids (PBEsol).45 The optimisations were performed to a force tolerance < 1 × 10⁻⁴ eV Å−1.Electronic-structure calculations were performed using the screened hybrid HSE06 functional46,47 including spin–orbit coupling (SOC) effects. The effective masses at the band edges were calculated according to:
 | (1) |
The electronic transport properties were calculated using the AMSET software package.48 The code uses the momentum relaxation time approximation (MRTA)49 to calculate the scattering rates and carrier mobilities, and has demonstrated excellent agreement both to experimental measurements of the electron mobilities and Seebeck coefficients of several semiconductors and to highly-accurate theoretical calculations using the electron-phonon Wannier approach.48,50–52 Unlike the widely-used BoltzTraP approach,53 this method does not assume a constant relaxation time and instead estimates one by considering a range of scattering processes. We considered three scattering processes in this work, viz. the acoustic deformation potential (ADP), ionized impurity (IMP), and polar-optical phonon (POP) scattering. The characteristic scattering τe is then calculated following Matthiessen's rule:
 | (2) |
The mode dependent scattering rates for each process are obtained within the Born approximation using common materials parameters, with differential scattering rates from state |nk〉 to state |mk + q〉 calculated using Fermi's golden rule:48
 | (3) |
The material parameters required as input to the method, including high-frequency and static dielectric constants, elastic constants, phonon frequencies and deformation potentials, were all obtained using first-principles calculations. To obtain the high-frequency dielectric constants and deformation potentials, calculations were performed using HSE06 with SOC. The ionic dielectric constants, elastic constants and the “effective polar phonon frequency” were obtained using density-functional perturbation theory (DFPT)54 with the PBEsol functional. The transport properties need to be converged with respect to an interpolation factor which controls the number of k-points in the interpolated band structures. Convergence results are provided in Fig. S2 and S3,† based on which a dense Fourier interpolated mesh of 69 × 69 × 93 was chosen (the original input k-point mesh used for the electronic band structures computed using DFT was 14 × 14 × 18).
Harmonic lattice dynamics calculations were performed using the finite-displacement method55,56 implemented in the Phonopy package.57,58 The accuracy of phonon frequencies is dependent on the range of the real-space interatomic force constants (IFCs) evaluated with the chosen supercell expansion. We, therefore checked the convergence of the harmonic phonon dispersions with respect to the supercell size. Although the dispersions were found to be reasonably converged with a small 84-atom cubic supercell created from the primitive cell (Fig. S4†), for greater accuracy we opted to use a 4 × 4 × 4 expansion of the primitive with 448 atoms. The dispersion curves of the two structures were evaluated along a path passing through the high-symmetry wavevectors in the I4/mmm Brillouin zones. To obtain atom-projected phonon density of states (pDoS) curves, Fourier interpolation was used to obtain frequencies on a uniform Γ-centred q-point mesh with 48 × 48 × 48 subdivisions.
The lattice thermal conductivity κl was computed within the single-mode relaxation time approximation (SM-RTA) as a sum of contributions from individual phonon modes λ according to:
 | (4) |
The Cλ and νλ are obtained within the harmonic approximation. The τλ are obtained as the inverse of the phonon linewidths Γλ, with τλ = 1/(2Γλ). The Γλ are calculated using the imaginary part of the phonon self-energy, which can be computed perturbatively to third order by considering energy- and momentum-conserving three-phonon scattering processes.59 This requires the third-order force constants, which we computed using the finite-displacement approach implemented in the Phono3py code.59 This perturbative treatment of the linewidths/lifetimes has been used to successfully model the κl of many materials.60–63
Due to the larger number of pairwise interactions that must be considered for the third-order IFCs, the calculation of the phonon linewidths is 1–2 orders of magnitude more expensive than obtaining the second order IFCs. Moreover, it has been shown that the real-space range of the third-order IFCs is generally smaller than the second-order IFCs.64 The third-order IFCs were therefore calculated using 84-atom cubic supercell expansions of the primitive cells using the transformation matrix shown in eqn (5).
 | (5) |
The PBEsol exchange–correlation functional was used for the force calculations, as it has shown to give a good description of lattice dynamics.65–69 The cutoff of 520 eV used for structural relaxation was also used for the force calculations to ensure accurate forces. SOC effects were not taken into account as they often have a negligible impact on phonon frequencies but greatly increase the computational cost. The k-point meshes used for the primitive cells were scaled appropriately for the supercell calculations. The κl of both structures were computed using Γ-centred q-point meshes with 15 × 15 × 15 subdivisions (Fig. S5†), using the linear tetrahedron method for the BZ integration.70–72
3 Results and discussion
3.1 Equilibrium geometry and electronic structure
A comparison of the calculated and experimental lattice parameters for the two systems is given in Table 1. The lattice parameters are systematically underestimated with PBEsol, consistent with previous trends,73,74 but are within 1.5% of the experimental structures, indicating that the PBEsol functional provides a good description of the equilibrium geometries.67,68,74–77| Compound | a (Å) | c (Å) |
|---|---|---|
| Ca4Sb2O | 4.648 | 16.141 |
| (−0.62%) | (−1.23%) | |
| Ca4Bi2O | 4.697 | 16.369 |
| (−0.46%) | (−0.82%) |
Selected interatomic distances in Ca4Sb2O and Ca4Bi2O are given in Table 2. The bond lengths are relatively longer in Ca4Bi2O compared to Ca4Sb2O due to the larger ionic radius of Bi.
| Bonds | Ca4Sb2O | Ca4Bi2O |
|---|---|---|
| Ca1–O1 | 2.324 (−0.6%) | 2.349 (−0.5%) |
| Ca2–O1 | 2.661 (−2.4%) | 2.664 (−2.2%) |
| Ca1–Sb1/Bi1 | 3.236 (−0.6%) | 3.292 (−0.3%) |
| Ca2–Sb1/Bi1 | 3.312 (−0.8%) | 3.341 (−0.7%) |
| Ca2–Sb1/Bi1 | 3.158 (−0.7%) | 3.214 (−0.2%) |
| Ca1–Ca1 | 3.287 (−0.6%) | 3.322 (−0.4%) |
| Ca1–Ca2 | 3.533 (−1.6%) | 3.552 (−1.4%) |
The calculated total and partial electronic density of states (DoS) of Ca4Sb2O and Ca4Bi2O are shown in Fig. 2 together with expanded views of the valence band maxima (VBM) and conduction band minima (CBM).
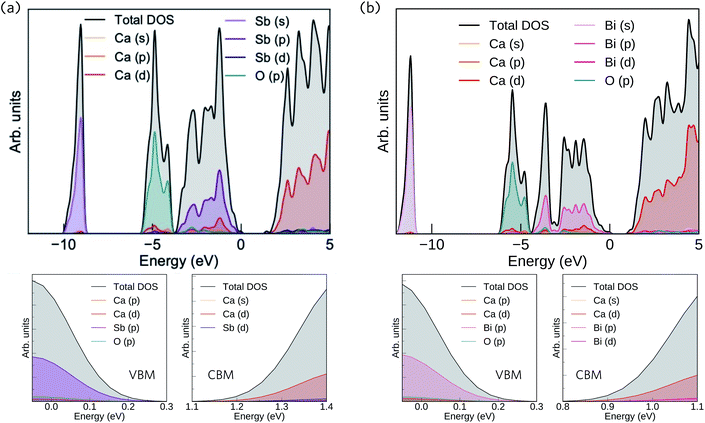 | ||
| Fig. 2 Calculated total and partial electronic density of states (DoS) curves of Ca4Sb2O (a) and Ca4Bi2O (b), both obtained at the HSE06 + SOC level of theory. The top of the valence band (VB) is set to 0 eV. The subplots below each DoS show expanded views of the valence band maxima (VBM) and conduction band minima (CBM). The plots were generated using the Sumo code, an open source command-line plotting tool for first-principles calculations.78 | ||
From 0 to −4 eV the valence band (VB) of Ca4Sb2O is mainly dominated by Sb 5p states, with some mixing with Ca 3d and 4p, and O 2p states. From −4 to −6 eV, the VB consists predominantly of O 2p states with small contributions from Ca 4s, 4p and 3d, and Sb 5p states. Towards the valence band maximum (VBM) at 0 eV the contribution from Sb 5p states increases and they undergo hybridisation with O 2p and Ca 4p and 3d states. The conduction band minimum (CBM) consists primarily of Ca d states, with a small amount of mixing with Ca s and Sb d states. Away from the CBM, the conduction band again consists mainly of Ca d states, with small contributions from Sb s, p and d, and O p states.
For Ca4Bi2O, the top of the VB from 0 to −2 eV is dominated by Bi 6p states with some contribution from Ca 3d states. The region of the VB from −2 and −4 eV is again mainly dominated by Bi 6p states, but this time mixed with Ca 4p and 3d, and O 2p states. (Around −3 eV the DoS predominantly consists of Bi 6p states only.) From around −4.5 eV to −6 eV, a large density of O 2p states is observed with a small of mixing with Ca 4s, 4p and 3d, and Bi 6p states. The VBM consists of Bi 6p states showing minimal hybridisation with O 2p and Ca 4p and 3d states. The CBM is again mainly dominated by Ca d states and shows a small amount of mixing with Bi p and d, and Ca s states. Again similarly to Ca4Sb2O, the rest of the CB is also predominately Ca d states with small amounts of Bi s, p and d, Ca s and p, and O p states.
Our calculated HSE06 + SOC electronic DoS curves are in agreement with previous calculations using the tight-binding linear-muffin-tin orbital method in the LDA and atomic-sphere approximations, where Bi/Sb p and O 2p were found to be the dominant contributors to the VB between 0 to −3.1 and −4.2 eV, respectively, and Ca 3d states were found to dominate the CB above the Fermi level.36 The two compounds have the same structure and are isoelectronic, resulting in similar total and partial DoS curves.
The electronic structures suggest predominantly ionic bonding in both compounds, although the small amount of mixing between states is suggestive of some covalent character. A key difference between the materials is the wider (more dispersive) VB in Ca4Bi2O, which indicates that the Bi p orbitals are better matched in energy with the unoccupied Ca states, allowing for better mixing than in the Sb analogue. The other main difference is in the position of Sb 5s and Bi 6s, which occur from −9 to −10 eV and −11 to −12 eV below the Fermi level, respectively, indicating that the latter have a higher binding energy.
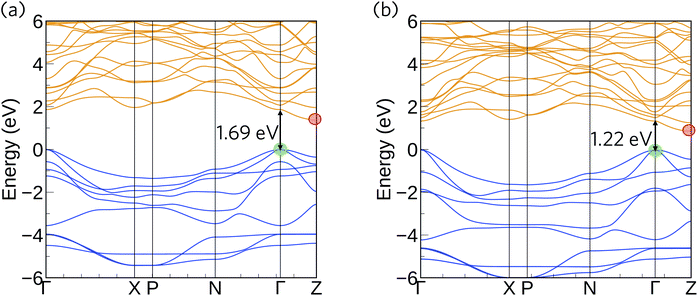
The HSE06 + SOC calculated band structures for Ca4Sb2O and Ca4Bi2O are shown in Fig. 3. The CBM shows negligible SOC effects, as it is dominated by states from the lighter Ca atoms, whereas the correction gave rise to substantial upward shifts of around 0.18 and 0.55 eV in the VBM of Ca4Sb2O and Ca4Bi2O, respectively, due to the dominant contributions of states from the heavy Bi/Sb atoms. As a result, the inclusion of SOC results in a net band gap reduction in both compounds, illustrating the important role of relativistic effects on the electronic structure of these materials. Both compounds are indirect band gap semiconductors, with the VBM and CBM situated at the symmetry points Γ and Z, respectively. Ca4Sb2O has an indirect band gap of 1.38 eV, and a direct fundamental gap at Γ of 1.69 eV. Ca4Bi2O has an indirect band gap of 0.85 eV and a direct fundamental gap, again at Γ, of 1.22 eV. The smaller gap of Ca4Bi2O is due to the higher-lying Bi p states undergoing a stronger orbital interaction with Ca states, leading to a more dispersive VB and higher-energy VBM.
In both compounds, the VB and CB are very dispersive around the band edges, indicating high charge carrier mobilities. For Ca4Sb2O, the top of the valence band shows a larger dispersion along the Γ–X direction compared to the Γ–N and Γ–Z directions. This increased dispersion leads to a smaller hole effective mass of 0.269 me compared to the larger effective masses of 0.425 and 0.735 me along the other directions, as indicated in Table 3. The Γ–X direction is along the c axis in real space, and the lower effective masses can be attributed to the linear coordination around Ca and consequent improved mixing of the Ca dz2 with O and Sb states. The remaining Ca d states forming the CB are non-bonding and hence have a relatively flat dispersion compared to the VB, resulting in a comparatively larger electron effective mass of ∼0.949 me along the Z–Γ direction. These electron effective masses are still low, albeit larger than the hole effective masses.
| System | VBM/me | CBM/me |
|---|---|---|
| Ca4Sb2O | 0.269 (Γ–X) 0.425 (Γ–N) 0.735 (Γ–Z) | 0.949 (Z–Γ) |
| Ca4Bi2O | 0.168 (Γ–X) 0.268 (Γ–N) 0.558 (Γ–Z) | 0.969 (Z–Γ) |
The band structure of Ca4Bi2O exhibits similar characteristics to Ca4Sb2O around the CBM, with an electron effective mass of ∼0.969 me along the Z–Γ direction. The top of the VB, however, shows increased dispersion in all three directions relative to Ca4Sb2O, resulting in lighter hole effective masses of 0.168, 0.268 and 0.558 me along the Γ–X, Γ–N and Γ–Z directions, respectively. The CBM is dominated by Ca 3d states in both compounds, which makes the electron effective mass relatively insensitive to the metal anion. On the other hand, the VBM has large contributions from the Sb/Bi p states, and the lower hole effective masses suggest stronger orbital interactions in Ca4Bi2O. Provided the system is dopable, these low hole and electron effective masses would result in high carrier mobilities, suggesting the possibility of high electrical conductivity with both p- and n-type doping.
Unfortunately, we were unable to find any experimental data on the electronic structures of these compounds to compare our calculations to. While theoretical electronic structures and band gaps have been reported by Xia et al.,36 these are likely not a good reference point for comparison because of the methods used – in particular, the local density approximation (LDA) is known to severely underestimate band gaps.
To provide a point of direct comparison to future experiments, we used our calculated total and partial density of states curves to simulate VB photoelectron spectra using the GALORE software package,79 which are shown in Fig. 4. The code computes the spectra by weighting the components of the atom-projected DoS according to their photoionization cross-sections,80 which depend on the probe radiation, orbital energies and orbital shapes. The calculated cross-sections do not however take into account the relativistic effects that would be exhibited by the heavy elements, which may result in a discrepancy between the simulated and measured spectra.81 Nonetheless, this method has proven to give good agreement with measured XPS spectra for many structures.24,82–86
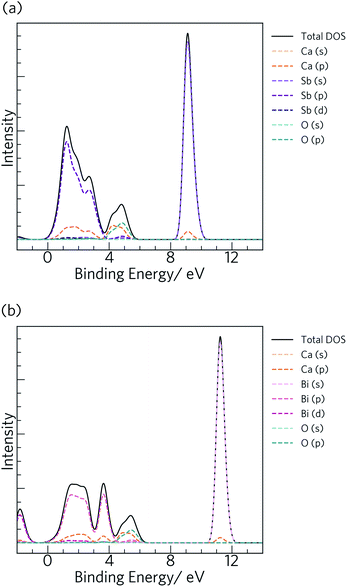 | ||
| Fig. 4 Simulated X-ray photoelectron spectra (0.3–2 keV) for Ca4Sb2O (a) and Ca4Bi2O (b), obtained from electronic density-of-states calculations performed at the HSE06 + SOC level of theory. | ||
3.2 Band alignment
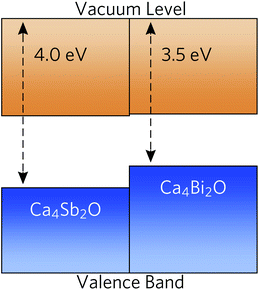
To predict whether the materials are more likely to be native p- or n-type semiconductors, we generated band-alignment diagrams using a slab model.87 The band alignment was performed using the core-level alignment approach,88 relative to the bulk O 1s core levels, at the HSE06 + SOC level of theory. The results are shown in Fig. 5.Both compounds have high-lying valence-band maxima (VBM) relative to the vacuum level, which is a characteristic feature of native p-type semiconductors such as Si, Cu2O and ScN.89–92 The lower ionisation potential (lower-lying VBM) of Ca4Bi2O can be attributed to better overlap between the Bi p and Ca states and the resulting stronger orbital interactions and larger band dispersion. The high-lying VBM and conduction-band minima (CBM) in the two materials would result in low ionisation potentials and low electron affinities. Since many defect levels tend to lie within a certain absolute range of energies, band alignments also allow us to make an educated guess as to the p/n-type dopability of a material. Low ionisation potentials drive the formation of holes in semiconductors, and low electron affinites lead to limited n-type dopability due to charge compensation from the higher concentration of holes, resulting in a preference for p-type semiconducting behaviour.93 It is, however, important to conduct a full defect study in order to assess the position of the Fermi level.
3.3 Electronic transport properties
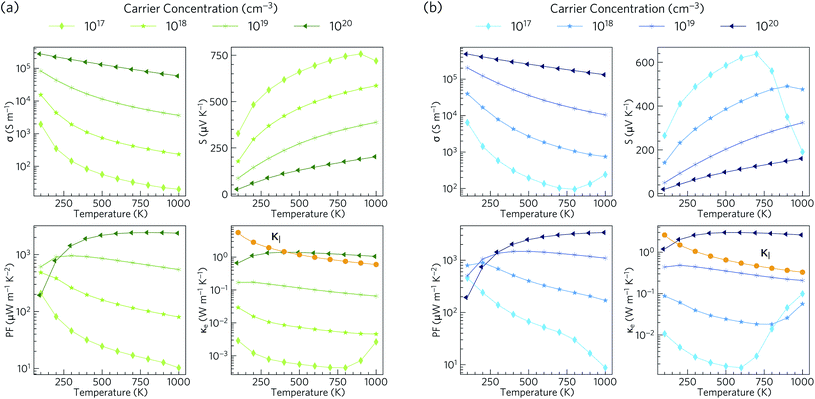
Electronic transport properties for Ca4Sb2O and Ca4Bi2O obtained using our HSE06 + SOC electronic structures under p-type doping conditions, with carrier conentrations in the range of 1017 to 1020 cm−3, are presented in Fig. 6.The electrical conductivity (σ) is given by σ = neμ, where n is the carrier concentration, e is the elementary charge and μ is the mobility. σ is therefore directly proportional to the concentrations of the charge carriers and their mobility. For Ca4Sb2O, the p-type electrical conductivities range from ∼20 S m−1 to ∼2.8 × 10⁵ S m−1. For Ca4Bi2O the electrical conductivities are larger and range from ∼95 to ∼4.9 × 10⁵ S m−1, which can be attributed to lower hole effective masses leading to higher mobilities. The room temperature electrical conductivities at a high hole concentration of 1020 cm−3 are 1.9 × 10⁵ and 3.5 × 10⁵ S m−1. These are larger than the value reported for polycrystalline NaxCoO2−δ (5 × 10⁴ S m−1)94 and are comparable to NaxCoO2−δ single crystals (5 × 10⁵ S m−1),94,95 which are among the highest reported electrical conductivities of oxide thermoelectrics.
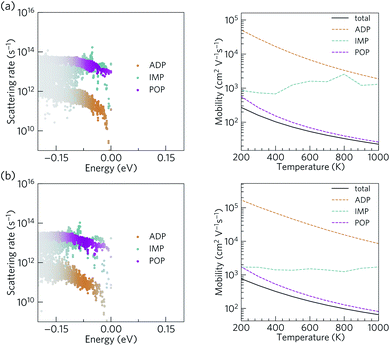
The scattering rates and mobilities are compared in Fig. 7 and indicate larger total mobilities in Ca4Bi2O than in Ca4Sb2O due to its lower m*. The hole mobilities in both Ca4Sb2O and Ca4Bi2O are found to be limited by polar optical phonon scattering, in agreement with the behaviour exhibited by other polar semiconductors.48,96,97 Polar optical scattering has also been identified as the dominant scattering mechanism in many of the current best-performing thermoelectrics including PbTe98 and SnSe.99 On the other hand, acoustic deformation scattering is found to have the least impact on the hole mobilities of both Ca4Sb2O and Ca4Bi2O. This can be attributed to the small absolute valence band edge deformation potentials of both materials (∼1.2 and ∼0.9 eV respectively).
The Seebeck coefficient (S) corresponds to the voltage induced in response to a temperature gradient, and can be either positive or negative depending on the dominant charge carrier type (+ve for holes and −ve for electrons). The p-type Seebeck coefficients for Ca4Sb2O range from about 26 μV K−1 at low T and high carrier concentration (1020 cm−3) to ∼757 μV K−1 at high temperature and low carrier concentration (1017 cm−3). A similar range of 20–638 μV K−1 is obtained for Ca4Bi2O.
The Seebeck coefficient depends on the electronic structure, and the difference could be related to the hole effective masses. In Ca4Sb2O, the larger hole inertial effective masses along the conduction direction would lead to higher band effective masses m*band and, as a result, higher density of states effective masses m*DoS, due to the relationship:100
| m*DoS = NV2/3m*band | (6) |
 | (7) |
The room-temperature Seebeck coefficients at low carrier concentrations of ≤1019 cm−3 for Ca4Sb2O and ≤1018 cm−3 for Ca4Bi2O are larger than the ∼176 μV K−1 at 300 K reported for dual-doped Zn0.96Al0.02Ga0.02O,101 which is reported to possess the highest ZT among n-type bulk oxide thermoelectrics. The maximum Seebeck coefficients of Ca4Sb2O and Ca4Bi2O are also higher than those reported for the majority of oxide thermoelectric materials.95,101–106
The power factors PF = S2σ are the numerator of the ZT expression and thus large PFs are essential for high thermoelectric performance. The combination of high σ and large S result in p-type PFs in the ranges of 10–2441 and 9–3389 μW m−1 K−2 for Ca4Sb2O and Ca4Bi2O respectively. These values are higher than the 810 μW m−1 K−1 reported for polycrystalline NaxCoO2−δ at 800 K.94
The thermal conductivity, which appears in the denominator of the ZT equation, consists of two components: the electronic thermal conductivity κe, which corresponds to heat conduction by charge carriers, and the lattice thermal conductivity κl, which corresponds to heat transport through lattice vibrations (phonons). We show the κl values obtained from our calculations, (discussed in the following subsections) against the κe obtained from the electronic-structure calculations in Fig. 6. At carrier concentrations less than and equal to 1019 cm−3, the κe is smaller than the κl and the latter would therefore dominate the thermal transport, whereas at higher doping concentrations around 1020 cm−3 the electronic contribution becomes dominant above 400 and 170 K for Ca4Sb2O and Ca4Bi2O respectively.
3.4 Phonon dispersion and density of states
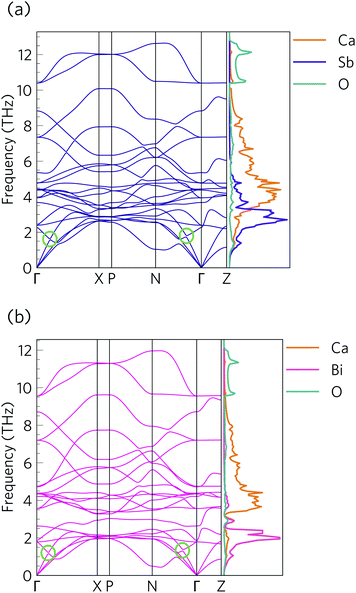
The phonon dispersions of Ca4Sb2O and Ca4Bi2O are shown together with the atom-projected phonon density of states (pDoS) curves in Fig. 8.The primitive cells of both materials contain 7 atoms, resulting in 3N = 21 phonon bands at each wavevector. Both structures are dynamically stable, indicated by the absence of imaginary phonon modes in the dispersions.
Due to the inverse relationship between the reduced mass and frequency, the lower, mid and high-frequency phonon modes in both materials mostly comprise motions of the Sb/Bi, Ca and O atoms respectively. The Ca4Sb2O phonon spectrum is spread over a wider frequency range than that of Ca4Bi2O, which can be attributed to the heavier Bi atoms downshifting the frequencies.
The dispersion curves show relatively flat optic branches in the low-frequency region, which would result in low group velocities (νλ). Both phonon dispersion curves also show avoided crossings between a low-lying optic mode and an acoustic mode along the Γ–X and N–Γ directions, which is a characteristic feature of “rattling” behaviour associated with heavy, weakly-bound atoms and suppressed thermal transport.107–109 Given that the low-frequency optic modes are dominated by Sb/Bi motion, we can infer that these atoms behave as rattlers. The large gap at the avoided crossing is indicative of strong hybridisation between the acoustic and optic modes, which modifies the dispersion and reduces the group velocity of the acoustic modes and, as these are the primary heat carriers, also reduces the thermal transport. Avoided crossings can also increase the phonon scattering rates and further suppress the heat transport. Due to the comparatively small unit cells, parts of the phonon spectrum are relatively sparse, which may limit the number of energy- and momentum-conserving scattering channels in these materials, in contrast to materials with large and complex unit cells such as Bi2Sn2O7.24 However, there is a relatively high density of optic modes in the low-frequency part of the spectrum, which may enable a large number of scattering channels for the heat-carrying acoustic modes.
3.5 Lattice thermal conductivity
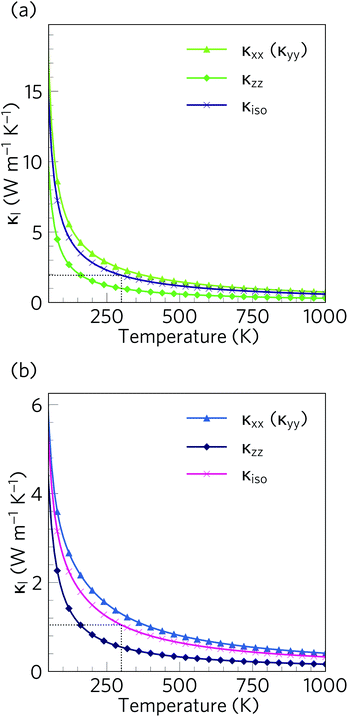
The calculated lattice thermal conductivity κl of Ca4Sb2O and Ca4Bi2O as a function of temperature are compared in Fig. 9. As a result of the tetragonal symmetry of both structures, the thermal-conductivity tensors have two unique diagonal components, viz. κxx/κyy, corresponding to transport along the a and b axes, and κzz, corresponding to transport along the c axis. The lower lattice thermal conductivity along the c-axis can be ascribed to weaker Ca–Sb/Ca–Bi chemical bonding (bond lengths ≈ 3.18 and 3.22 Å, respectively) compared to the stronger Ca–O bonds (≈2.34 and 2.36 Å) in the ab plane.The κl of Ca4Sb2O is higher than that of Ca4Bi2O, with the room temperature average value of 1.93 W m−1 K−1 in the former being almost double the 1.05 W m−1 K−1 in the latter. The average κl approaches 0.79 and 0.45 W m−1 K−1 at 750 K, and decreases further to 0.60 and 0.33 W m−1 K−1 at 1000 K. The room temperature κl are comparable to the industry-standard PbTe,110 and are much lower than the majority of oxide thermoelectrics.94,101,105,111 At higher temperatures, the κl fall below 1 W m−1 K−1, and such “ultra-low” thermal conductivities are a feature of high-efficiency thermoelectrics. At 1000 K, the κl along the c direction falls to 0.16 W m−1 K−1, which is lower than the 0.20 W m−1 K−1 reported for SnSe along the layering direction.
The κl calculated using the relaxation-time approximation (RTA) only takes into account three-phonon scattering mechanisms, and does not account for other scattering processes such as electron–phonon and phonon-defect scattering. The model also neglects higher-order anharmonic terms, for example the fourth-order interactions, which are less restricted by the laws of energy and momentum conservation and can in some cases make a substantial contribution to the κl. However, the RTA also does not account for the collective phonon excitations present in a full solution of the linearised Boltzmann transport equation (LBTE), and as such tends to underestimate the κl,112–115 which partially compensates for the neglect of other scattering mechanisms and often gives good agreement with experiments. We also investigated the effect of isotope scattering and found only a very minor effect (Fig. S6†).
3.6 Modal contributions to the lattice thermal transport
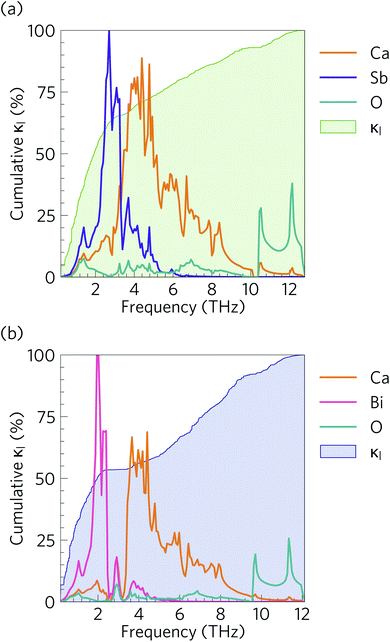
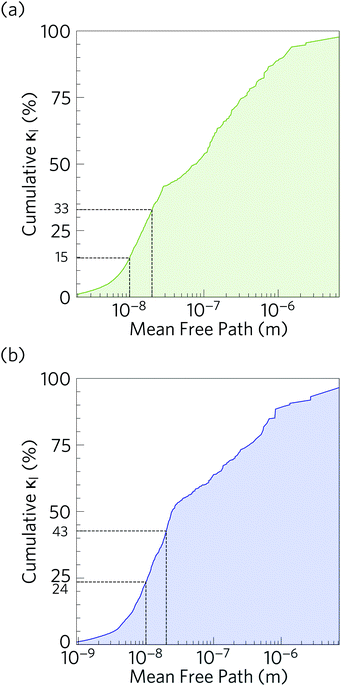
Fig. 10 compares the cumulative lattice thermal conductivity of Ca4Sb2O and Ca4Bi2O as a function of phonon frequency at 300 K. This analysis shows that the majority of the heat transport in both materials is through low-frequency phonon modes from 0–2.8 and 0–2.1 THz in Ca4Sb2O and Ca4Bi2O respectively. Comparing the accumulation with the phonon spectra in Fig. 8 shows that these upper limits correspond to the maximum frequencies of the acoustic modes along the Γ–X and Γ–P directions plus some low-lying optic modes. In Ca4Sb2O these modes make up 64% of the overall κl, whereas the equivalent modes in Ca4Bi2O account for only ∼53% of the total lattice thermal conductivity. Analysing the cumulative κl along the a/b and c axes (Fig. S7†) produces a similar result. The majority of the heat transport in the two materials therefore occurs through acoustic and low-frequency optic modes.It is also instructive to examine the cumulative κl as a function of the phonon mean free path Λλ = νλτλ (Fig. 11). In both structures, the κl increases to ∼10 μm, which would correspond to the longest mean free paths of the heat carrying modes in the two structures. We find that 85 and 76% of the thermal transport in Ca4Sb2O and Ca4Bi2O is through modes with mean free paths above 10 nm, while 67 and 57% is through modes with Λλ > 20 nm. This therefore indicates that the low lattice thermal conductivity of these materials could likely be further reduced by nanostructuring, a topic which we return to below.
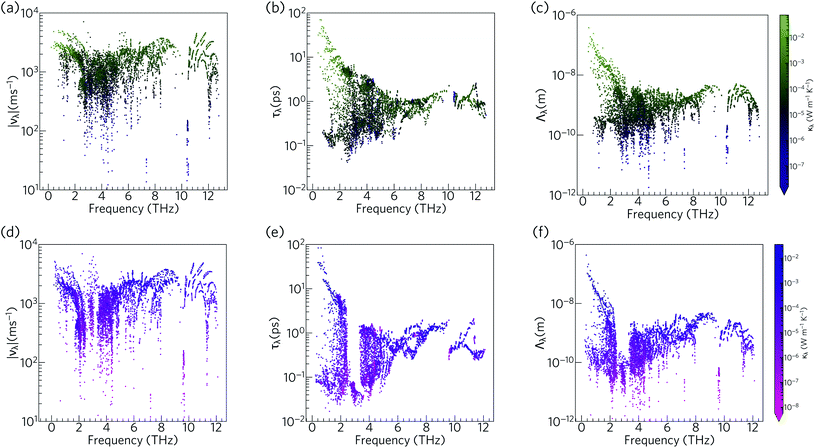
To further understand the range of modal contributions to the κl, we plot the frequency spectra of the modal group velocity norms |νλ|, lifetimes τλ, and mean free path norms Λλ = |νλ|τλ at 300 K (Fig. 12). We also investigated the directional anisotropy in the thermal transport by analysing separately the contributions of the modes making the dominant contributions to the transport along the a/b and c axes (Fig. S8†).
The group velocities of both Ca4Sb2O and Ca4Bi2O fall into a range of ∼101 to 104 m s−1. The fastest modes are seen around 1–2 THz, 6 THz, and 10–12 THz, reflecting the more dispersive phonon bands at these frequencies (νλ ≡ ∂ωλ/∂q). The overall spectra of the νλ is comparable to the hybrid perovskite (CH3NH3)PbI3 (MAPbI3), for which an ultralow lattice thermal conductivity of about 0.086 W m−1 K−1 has been predicted,61 and the generally low group velocities can be attributed to the presence of heavy elements in the structure and the consequent weak chemical bonding.
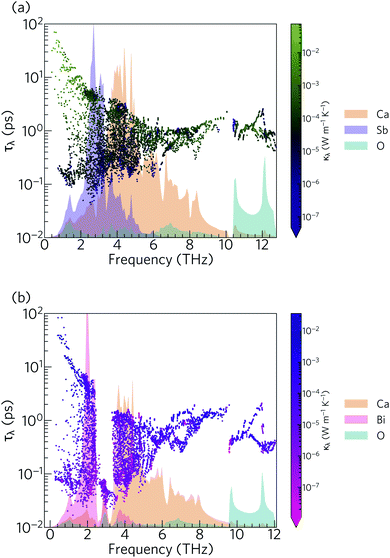
The phonon lifetimes in Ca4Sb2O span a range of 10−1 to 102 ps, whereas for Ca4Bi2O a notable number of modes have τλ below 10−1 ps. Quantitatively, ∼17% of the modes in Ca4Bi2O have lifetimes smaller than 10−1 ps, compared to just 1.2% in Ca4Sb2O. Comparing the spectra of τλ with the phonon DoS (Fig. 13) shows that in Ca4Bi2O the modes with substantial Bi character have very short τλ compared to the Sb-based modes in Ca4Sb2O. In particular, there is a group of modes at around 3 THz in Ca4Bi2O for which the lifetimes are all below 0.1 ps, indicative of strong phonon scattering and large anharmonicity. The high-frequency O-based modes also have shorter lifetimes in Ca4Bi2O than in Ca4Sb2O, whereas the lifetimes of the mid-frequency Ca-based modes are quite similar in both materials.
The analysis in Fig. 12 shows that the lower-frequency modes generally have faster group velocities and longer lifetimes, and hence longer mean-free paths. This is consistent with the accumulations of the κl with respect to frequency and mean-free path (Fig. 10 and 11), which show that these modes contribute most to the thermal transport. The similar spread of group velocities but shorter mode lifetimes in Ca4Bi2O compared to Ca4Sb2O result in 73% of the modes having mean free paths less than 1 nm, as opposed to 55% in Ca4Sb2O. The majority of the Λλ are therefore less than 10 nm in both structures. The longest Λλ in Ca4Sb2O are 132 nm and 1.06 μm for transport in the ab plane and along the c-axis, respectively, while for Ca4Bi2O the maximum mean-free paths are 125 nm and 1.15 μm along the two directions. Although the longest Λλ for transport along the c axis is larger in Ca4Bi2O than in Ca4Sb2O, the average is shorter, at 902 pm compared to 1.07 nm.
Overall, the phonon modes in Ca4Sb2O and Ca4Bi2O are characterised by low group velocities and short phonon lifetimes, leading to short mean-free paths. While the group velocities in both materials span a similar range, the lower density of long-lived modes in Ca4Bi2O results in shorter average mean-free paths and thus a lower κl.
3.7 Microscopic origin of short phonon mode lifetimes
The analysis in the previous section indicates that the phonon lifetimes in Ca4Sb2O and Ca4Bi2O are unusually short and are also the main origin of the lower κl of Ca4Bi2O. To understand the origin of the short lifetimes, and of the difference between the two materials, we performed the analysis outlined in ref. 59.The τλ are calculated from the phonon linewidths Γλ from the relationship τλ = 1/2Γλ. The Γλ are obtained as the imaginary part of the phonon self-energy by summing over contributions from energy- and (crystal) momentum-conserving three-phonon interactions between the reference mode λ and pairs of interacting modes λ′ and λ′′. The contribution of each scattering event to the overall linewidth depends on the three-phonon interaction strengths Φλλ′λ′′, which describe the physical coupling between modes and depends on the third-order force constants, and a term that captures the temperature dependence of the linewidth via changes in the mode occupation numbers nλ.
An approximate Γλ can be written as the product of an averaged phonon interaction strength Pλ and a two-phonon weighted joint density of states N2(q, ω) (w-JDoS):59
 | (8) |
The Pλ are the averaged phonon–phonon interaction strengths for each mode calculated as:
 | (9) |
N 2(q, ω) counts the number of energy-conserving scattering pathways available to a mode with wavevector q and frequency ω, and is the sum of two separate functions corresponding to collision (Type 1) and decay (Type 2) processes:
| N2(q,ω) = N(1)2(q,ω) + N(2)2(q,ω) | (10) |
 | (11) |
 | (12) |
![[N with combining macron]](https://www.rsc.org/images/entities/i_char_004e_0304.gif) 2(ω) = 2(ω) = ![[N with combining macron]](https://www.rsc.org/images/entities/i_char_004e_0304.gif) (1)2(ω) + (1)2(ω) + ![[N with combining macron]](https://www.rsc.org/images/entities/i_char_004e_0304.gif) (2)2(ω) (2)2(ω) | (13) |
 | (14) |
Fig. 14 compares the mode linewidths of Ca4Sb2O and Ca4Bi2O at 300 K with the averaged three-phonon interaction strengths Pλ and the w-JDoS functions ![[N with combining macron]](https://www.rsc.org/images/entities/i_char_004e_0304.gif) 2(ω). For both compounds, the low-frequency modes show narrower linewidths (longer lifetimes) than the high-frequency modes, and the shorter lifetimes of Ca4Bi2O are reflected in the broader linewidths compared to Ca4Sb2O. Notably, Ca4Bi2O has a group of modes with broad linewidths at around 3 THz, which coincides with the very short lifetimes in this region of the spectrum (c.f.Fig. 12).
2(ω). For both compounds, the low-frequency modes show narrower linewidths (longer lifetimes) than the high-frequency modes, and the shorter lifetimes of Ca4Bi2O are reflected in the broader linewidths compared to Ca4Sb2O. Notably, Ca4Bi2O has a group of modes with broad linewidths at around 3 THz, which coincides with the very short lifetimes in this region of the spectrum (c.f.Fig. 12).
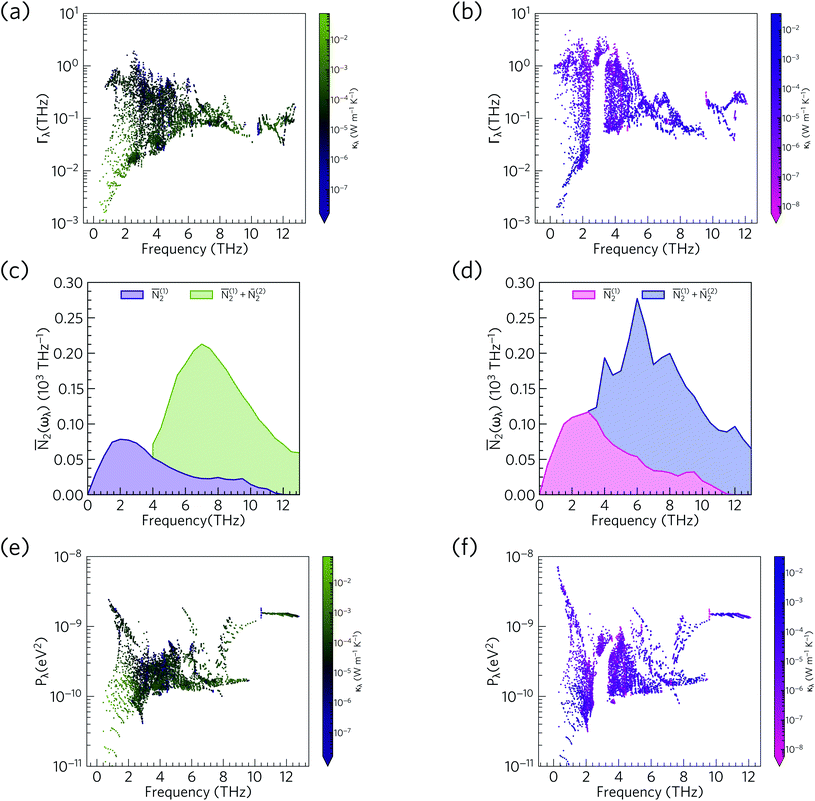 | ||
Fig. 14 Comparison of the phonon linewidths Γλ (a/b), weighted two-phonon density of states ![[N with combining macron]](https://www.rsc.org/images/entities/i_char_004e_0304.gif) 2(ω) (c/d) and averaged phonon–phonon interaction strengths Pλ (e/f) in Ca4Sb2O (left-hand panel) and Ca4Bi2O (right-hand panel). The Γλ and 2(ω) (c/d) and averaged phonon–phonon interaction strengths Pλ (e/f) in Ca4Sb2O (left-hand panel) and Ca4Bi2O (right-hand panel). The Γλ and ![[N with combining macron]](https://www.rsc.org/images/entities/i_char_004e_0304.gif) 2(ω) are shown at T = 300 K and 2(ω) are shown at T = 300 K and ![[N with combining macron]](https://www.rsc.org/images/entities/i_char_004e_0304.gif) 2(ω) are shown separately for collision ( 2(ω) are shown separately for collision (![[N with combining macron]](https://www.rsc.org/images/entities/i_char_004e_0304.gif) (1)2) and decay processes ( (1)2) and decay processes (![[N with combining macron]](https://www.rsc.org/images/entities/i_char_004e_0304.gif) (2)2). As in Fig. 12, the data points are colour coded by κl from purple to green (small to large κl) for Ca4Sb2O and from pink to blue (small to large κl) for Ca4Bi2O. Note that the y axes in subplots a/b and e/f are on a logarithmic scale, whereas subplots c/d are on a linear scale. (2)2). As in Fig. 12, the data points are colour coded by κl from purple to green (small to large κl) for Ca4Sb2O and from pink to blue (small to large κl) for Ca4Bi2O. Note that the y axes in subplots a/b and e/f are on a logarithmic scale, whereas subplots c/d are on a linear scale. | ||
From the N2(ω), it can be seen that the at low frequencies collision events dominate the phonon scattering, whereas at high frequencies decay processes dominate, and a combination of the two are active at intermediate frequencies. Comparing the ![[N with combining macron]](https://www.rsc.org/images/entities/i_char_004e_0304.gif) 2(ω) of Ca4Sb2O and Ca4Bi2O to α-Bi2Sn2O7
2(ω) of Ca4Sb2O and Ca4Bi2O to α-Bi2Sn2O7![[thin space (1/6-em)]](https://www.rsc.org/images/entities/char_2009.gif) 24 (Fig. 15) and scaling by 1/3na2 to account for the different sizes of the respective primitive cells, shows that there are a comparable number of scattering pathways for low- and medium-frequency modes in Ca4Bi2O, but not Ca4Sb2O. The N2(ω) is determined purely by the phonon spectrum, and a high density of energy- and momentum-conserving scattering pathways is generally favoured by a dense phonon spectrum with a narrow band dispersion. In α-Bi2Sn2O7, the large and complex unit cell and weak chemical bonding produces a large number of scattering channels across the frequency spectrum. In Ca4Bi2O, the
24 (Fig. 15) and scaling by 1/3na2 to account for the different sizes of the respective primitive cells, shows that there are a comparable number of scattering pathways for low- and medium-frequency modes in Ca4Bi2O, but not Ca4Sb2O. The N2(ω) is determined purely by the phonon spectrum, and a high density of energy- and momentum-conserving scattering pathways is generally favoured by a dense phonon spectrum with a narrow band dispersion. In α-Bi2Sn2O7, the large and complex unit cell and weak chemical bonding produces a large number of scattering channels across the frequency spectrum. In Ca4Bi2O, the ![[N with combining macron]](https://www.rsc.org/images/entities/i_char_004e_0304.gif) 2(ω) is comparable to that of Bi2Sn2O7 at low frequencies because of the significant overlap between the acoustic and low-frequency optic modes, and the avoided crossing between the acoustic and optic modes visible in the dispersion curves (c.f.Fig. 8) is also expected to play a role in increasing the acoustic-mode scattering phase space. This difference can be attributed to the fact that the low-frequency optic modes are dominated by motion of the heavier Sb/Bi atoms, and therefore occur at lower frequencies in Ca4Bi2O. In contrast to α-Bi2Sn2O7, the phonon dispersions of Ca4Sb2O and Ca4Bi2O are less dense and more dispersive at high frequencies, which results in the high-frequency modes having longer lifetimes. However, this does not have a significant impact on the thermal transport, as the majority of the heat transport is through the acoustic and the low-frequency optic modes (c.f.Fig. 10).
2(ω) is comparable to that of Bi2Sn2O7 at low frequencies because of the significant overlap between the acoustic and low-frequency optic modes, and the avoided crossing between the acoustic and optic modes visible in the dispersion curves (c.f.Fig. 8) is also expected to play a role in increasing the acoustic-mode scattering phase space. This difference can be attributed to the fact that the low-frequency optic modes are dominated by motion of the heavier Sb/Bi atoms, and therefore occur at lower frequencies in Ca4Bi2O. In contrast to α-Bi2Sn2O7, the phonon dispersions of Ca4Sb2O and Ca4Bi2O are less dense and more dispersive at high frequencies, which results in the high-frequency modes having longer lifetimes. However, this does not have a significant impact on the thermal transport, as the majority of the heat transport is through the acoustic and the low-frequency optic modes (c.f.Fig. 10).
 | ||
Fig. 15 Comparison of the ![[N with combining macron]](https://www.rsc.org/images/entities/i_char_004e_0304.gif) 2(ω) of Ca4Sb2O (a), Ca4Bi2O (b) and α-Bi2Sn2O724 (c). Each function is scaled by a factor of 1/3na2 to account for the larger primitive cell of α-Bi2Sn2O7. 2(ω) of Ca4Sb2O (a), Ca4Bi2O (b) and α-Bi2Sn2O724 (c). Each function is scaled by a factor of 1/3na2 to account for the larger primitive cell of α-Bi2Sn2O7. | ||
The w-JDoS functions do not completely explain the frequency dependence of the mode linewidths, as the modes also depend on the phonon interaction strengths Pλ as per eqn (8). The averaged phonon–phonon interaction strengths in Ca4Sb2O and Ca4Bi2O are comparable to the GaAs and CdTe61 and are considerably stronger than in α-Bi2Sn2O7.24 In Ca4Sb2O, the interactions generally span a range of 10−10 to 10−9 eV2, with notable spikes between 1 and 3 THz, at ∼6 Thz and above 8 THz. In Ca4Bi2O, the Pλ for some of the low-frequency modes are an order of magnitude stronger than in Ca4Sb2O. Comparison of the Γλ, ![[N with combining macron]](https://www.rsc.org/images/entities/i_char_004e_0304.gif) 2(ω) and Pλ shows that at low frequencies the strong physical coupling between modes compensates for the relatively low number of scattering pathways in the low-frequency region to produce broad linewidths. We therefore conclude that intrinsic anharmonicity is a key contributor to the short mode lifetimes in Ca4Sb2O and Ca4Bi2O. We attribute the stronger low-frequency phonon–phonon interaction strengths in Ca4Bi2O to the larger and more polarisable Bi anion giving rise to larger third-order force constants and stronger phonon–phonon interaction strengths.
2(ω) and Pλ shows that at low frequencies the strong physical coupling between modes compensates for the relatively low number of scattering pathways in the low-frequency region to produce broad linewidths. We therefore conclude that intrinsic anharmonicity is a key contributor to the short mode lifetimes in Ca4Sb2O and Ca4Bi2O. We attribute the stronger low-frequency phonon–phonon interaction strengths in Ca4Bi2O to the larger and more polarisable Bi anion giving rise to larger third-order force constants and stronger phonon–phonon interaction strengths.
Overall, from this analysis we can attribute the short phonon lifetimes and low κl of Ca4Sb2O and Ca4Bi2O to strong acoustic-mode scattering: (1) due to strong anharmonic phonon–phonon interactions; and (2) to a high density of energy and momentum-conserving scattering pathways produced by overlap between the acoustic and low-frequency optic modes. Both effects are enhanced in Ca4Bi2O compared to Ca4Sb2O, resulting in the latter having a ∼50% smaller κl.
3.8 Nanostructuring
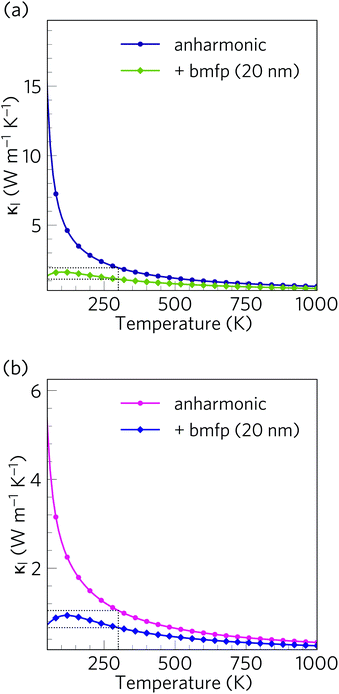
Alloying and nanostructuring are both widely-employed strategies to lower the κl and enhance the ZT of thermoelectric materials. Whereas alloying can often be detrimental to the electrical conductivity by decreasing carrier mobility,21 provided the length scale is designed to only scatter phonons the ‘bottom-up’ nanostructuring approach can decrease the κl while largely preserving the electronic transport properties. Grain-boundary scattering in particular is a useful strategy for selectively scattering fast, long-wavelength acoustic phonon modes.62,116We investigated the effect of nanostructuring on the κl in Ca4Sb2O and Ca4Bi2O using the simple boundary-scattering model implemented in the Phono3py code, which limits the mean-free paths of modes which have |Λλ| larger than a cutoff value. We tested a grain size of 20 nm to coincide with the level of nanostructuring attained by Hsu et al. with AgPb18SbTe20.117 As shown in Fig. 16, this decreases the room temperature average κl of Ca4Sb2O and Ca4Bi2O by around 42% and 37% to 1.11 and 0.66 W m−1 K−1, respectively. This is a considerable reduction, and indicates that nanostructuring can be efficiently used to further increase the thermal resistance in both materials.
3.9 Thermoelectric figure of merit
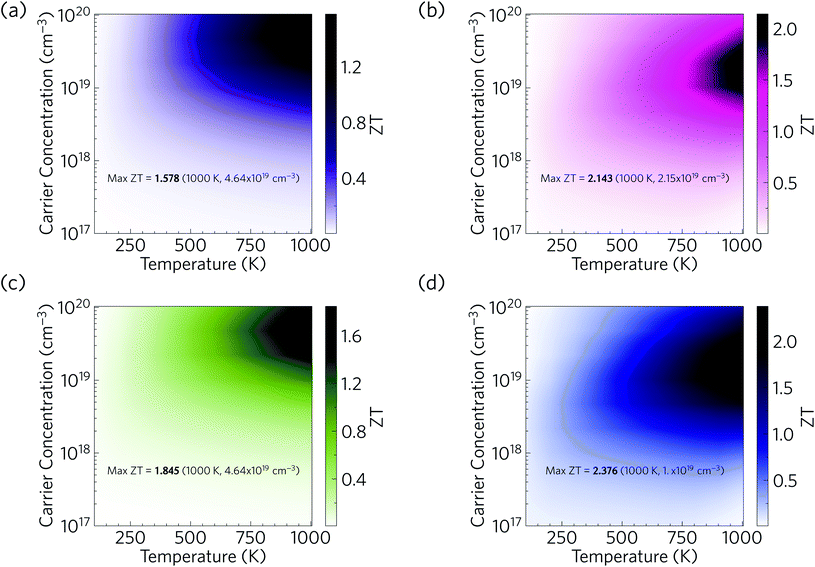
We now combine our calculated electrical properties and lattice thermal conductivity to predict the thermoelectric figure of merit ZT for Ca4Sb2O and Ca4Bi2O (Fig. 17). We predict a maximum p-type ZT of 1.58 for Ca4Sb2O at T = 1000 K and a carrier concentration of 4.64 × 1019 cm−3, and 2.14 for Ca4Bi2O at T = 1000 K and a carrier concentration of 2.15 × 1019 cm−3. At room temperature (300 K), we predict a maximum ZT of 0.16 and 0.31 for Ca4Sb2O and Ca4Bi2O respectively, at carrier concentrations of 2.15 × 10¹⁹ and 4.64 × 1018 cm−3. The room-temperature κl of 1.93 and 1.05 W m−1 K−1 are substantially reduced to 0.60 and 0.33 W m−1 K−1 at 1000 K, which, if κe remains negligible, would produce a ∼6× increase in the ZT with the additional 3× increase coming from the increase in temperature. The remainder of the enhancement comes from an improvement in the electrical properties at elevated temperatures. As noted earlier, Ca4Bi2O has slightly higher PFs than Ca4Sb2O, which along with its lower κl (∼2 times lower) are responsible for its higher ZT.Comparing the predicted ZT with other oxide thermoelectrics indicates that both materials may have comparable or slightly larger room temperature figures of merit than the majority of existing p-type oxide thermoelectrics and potentially larger ZT at elevated temperatures. Single crystals of NaxCoO2−δ, one of the earliest p-type oxide thermoelectrics discovered, have been reported to show a ZT of 0.03 at 300 K and 1.2 at 800 K.94 Single crystals of Ca3Co4O9 have been reported to have a ZT of ∼0.07 at 300 K and 0.87 at 973 K.102 Bi2Sr2Co2Oy, another p-type oxide thermoelectric, was reported to have a ZT of less than 0.1 at room temperature and about 1.1 at 973 K.104 The main reason for the higher ZT values of Ca4Sb2O and Ca4Bi2O is their low lattice thermal conductivity. Our predicted values of <2 W m−1 K−1 at room temperature and <1 W m−1 K−1 at higher T are considerably smaller than the 19 and 5 W m−1 K−1 of single-crystal NaxCoO2−δ at 300/800 K,94 the 3/2 W m−1 K−1 of Ca3Co4O9 measured at 300 K and higher temperature,102 and the >2 W m−1 K−1 of Bi2Sr2Co2Oy even at elevated temperature.104
Our predictions therefore suggest that, provided they can be doped, Ca4Sb2O and Ca4Bi2O could potentially serve as very promising p-type thermoelectric materials. We also note that there is also potential to further enhance the ZT by nanostructuring to further reduce the κl. As depicted in Fig. 17, nanostructuring to 20 nm is predicted to further increase the maximum ZT of Ca4Sb2O and Ca4Bi2O to 1.85 and 2.38 respectively, which amount to modest increases of 17 and 11% over the bulk values.
4 Conclusions
In summary, we have performed a detailed investigation of the thermoelectric properties of two mixed-anion oxide systems, Ca4Sb2O and Ca4Bi2O.Both Ca4Sb2O and Ca4Bi2O possess good electronic transport properties, comparable to other known oxide thermoelectric materials. Despite the predominantly ionic bonding, the inhomogenous chemical bonding and heavy metals produce a combination of low phonon group velocities and short phonon lifetimes. These together result in room-temperature lattice thermal conductivities of 1.93 and 1.05 W m−1 K−1, which are considerably lower than most other oxide thermoelectrics. Analysis of the κl shows that the majority of the heat transport occurs through acoustic and low-frequency optic modes for which the mean-free paths are heavily limited by suppressed phonon lifetimes. The heavy metals in the mixed-anion structures produce relatively flat, low-frequency optic bands that modify the dispersion by avoided crossings with the acoustic modes and also provide a high density of phonon scattering channels for the heat-carrying modes. These effects are further enhanced by strong physical coupling between modes, indicative of large phonon anharmonicity. The heavier and more polarisable Bi anions in Ca4Bi2O result in stronger phonon–phonon interactions than in Ca4Sb2O and an approx. two-fold reduction in the κl.
We predict high p-type thermoelectric figures of merit approaching ∼1–2 at high temperatures, which can be attributed both to the good electronic transport properties and to the low lattice thermal conductivity. Our calculations also highlight the possibility of further lowering the thermal conductivity and enhancing the ZT by nanostructuring.
Despite there being no upper limit to ZT, most thermoelectric materials, including some of the industry standards, attain a maximum ZT of ∼1 at the operating temperature. Breaking this threshold is challenging due to the interdependence of the electrical properties S, σ and κe, and to the difficulty of finding materials with intrinsically low κl. The latter requirement has historically led to materials made from heavy elements such as Pb and Te which are, unfortunately, often also rare and/or toxic. The mixed-anion systems investigated in this study consist of earth-abundant and non-toxic elements with the added advantages of high chemical and thermal stability, and have the potential to reach a ZT above 1 at elevated temperature. This suggests they are viable candidates for large-scale applications, and thus warrant further investigation. Future theoretical work should extend this study to establish the defect chemistry of the two materials to confirm whether they are dopable and to identify suitable dopants.
Provided this is the case, mixed-anion systems such as Ca4Sb2O and Ca4Bi2O could constitute a new class of high-performance oxide thermoelectrics and provide an interesting new direction for future research.
Conflicts of interest
The authors declare no competing financial interests.Acknowledgements
Via our membership of the UK's HEC Materials Chemistry Consortium, which is funded by the UK Engineering and Physical Sciences Research Council (EPSRC; EP/L000202, EP/R029431, EP/T022213), this work used the ARCHER and ARCHER2 UK National Supercomputing Services. We are also grateful to the UK Materials and Molecular Modelling Hub (MMM Hub), which is partially funded by the EPSRC (EP/P020194, EP/T022213), for computational resources on the Thomas and Young supercomputers, and to UCL for access to the Legion (Legion@UCL), Myriad (Myriad@UCL) and Kathleen (Kathleen@UCL) supercomputers. WR is grateful to University College London for the award of a PhD scholarship. JMS is currently supported by a UK Research and Innovation Future Leaders Fellowship (MR/T043121/1), and previously held a University of Manchester Presidential Fellowship. DOS acknowledges support from the European Research Council (ERC; grant no. 758345).Notes and references
- M. G. Kanatzidis, Chem. Mater., 2010, 22, 648 CrossRef CAS.
- J. He, M. G. Kanatzidis and V. P. Dravid, Mater. Today, 2013, 16, 166 CrossRef CAS.
- T. M. Tritt and M. A. Subramanian, MRS Bull., 2006, 31, 188 CrossRef.
- T. M. Tritt, Annu. Rev. Mater. Res., 2011, 41, 433 CrossRef CAS.
- G. J. Snyder and E. S. Toberer, Nat. Mater., 2008, 7, 105 CrossRef CAS PubMed.
- H. Wang, Y. Pei, A. D. LaLonde and G. J. Snyder, Adv. Mater., 2011, 23, 1366 CrossRef CAS PubMed.
- Y. Pei, A. D. Lalonde, H. Wang and G. J. Snyder, Energy Environ. Sci., 2012, 5, 7963 RSC.
- Y. Tang, Z. M. Gibbs, L. A. Agapito, G. Li, H. S. Kim, M. B. Nardelli, S. Curtarolo and G. J. Snyder, Nat. Mater., 2015, 14, 1223 CrossRef CAS.
- G. Tan, X. Zhang, S. Hao, H. Chi, T. P. Bailey, X. Su, C. Uher, V. P. Dravid, C. Wolverton and M. G. Kanatzidis, ACS Appl. Mater. Interfaces, 2019, 11, 9197 CrossRef CAS PubMed.
- Z. Huang, D. Wang, C. Li, J. Wang, G. Wang and L. D. Zhao, J. Mater. Chem. A, 2020, 8, 4931 RSC.
- J.-F. Li, W.-S. Liu, L.-D. Zhao and M. Zhou, NPG Asia Mater., 2010, 2, 152 CrossRef.
- M. Hong, Z. G. Chen, L. Yang and J. Zou, Nanoscale, 2016, 8, 8681 RSC.
- L. Yang, Z. G. Chen, M. Hong, L. Wang, D. Kong, L. Huang, G. Han, Y. Zou, M. Dargusch and J. Zou, Nano Energy, 2017, 31, 105 CrossRef CAS.
- K. Biswas, J. He, I. D. Blum, C.-I. Wu, T. P. Hogan, D. N. Seidman, V. P. Dravid and M. G. Kanatzidis, Nature, 2012, 489, 414 CrossRef CAS.
- M. Saleemi, M. S. Toprak, S. Li, M. Johnsson and M. Muhammed, J. Mater. Chem., 2012, 22, 725 RSC.
- Y. Pei, A. D. LaLonde, N. A. Heinz and G. J. Snyder, Adv. Energy Mater., 2012, 2, 670 CrossRef CAS.
- K. Kurosaki, A. Yusufu, Y. Miyazaki, Y. Ohishi, H. Muta and S. Yamanaka, Mater. Trans., 2016, 57, 1018 CrossRef CAS.
- T. Dasgupta, C. Stiewe, A. Sesselmann, H. Yin, B. B. Iversen and E. Mueller, J. Appl. Phys., 2013, 113, 103708 CrossRef.
- Y. Mozharivskyj, Y. Janssen, J. L. Harringa, A. Kracher, A. O. Tsokol and G. J. Miller, Chem. Mater., 2006, 18, 822 CrossRef CAS.
- Y. Feng, X. Jiang, E. Ghafari, B. Kucukgok, C. Zhang, I. Ferguson and N. Lu, Adv. Compos. Hybrid Mater., 2018, 1, 114 CrossRef CAS.
- K. Koumoto, Y. Wang, R. Zhang, A. Kosuga and R. Funahashi, Annu. Rev. Mater. Res., 2010, 40, 363 CrossRef CAS.
- J. W. Fergus, J. Eur. Ceram. Soc., 2012, 32, 525 CrossRef CAS.
- K. B. Spooner, A. M. Ganose and D. O. Scanlon, J. Mater. Chem. A, 2020, 8, 11948 RSC.
- W. Rahim, J. M. Skelton and D. O. Scanlon, J. Mater. Chem. A, 2020, 8, 16405 RSC.
- P. Ágoston, K. Albe, R. M. Nieminen and M. J. Puska, Phys. Rev. Lett., 2009, 103, 245501 CrossRef PubMed.
- L. D. Zhao, D. Berardan, Y. L. Pei, C. Byl, L. Pinsard-Gaudart and N. Dragoe, Appl. Phys. Lett., 2010, 97, 092118 CrossRef.
- Y. Liu, L.-D. Zhao, Y. Liu, J. Lan, W. Xu, F. Li, B.-P. Zhang, D. Berardan, N. Dragoe, Y.-H. Lin, C.-W. Nan, J.-F. Li and H. Zhu, J. Am. Chem. Soc., 2011, 133, 20112 CrossRef CAS PubMed.
- M. Einhorn, B. A. D. Williamson and D. O. Scanlon, J. Mater. Chem. A, 2020, 8, 7914 RSC.
- M. Amsler, L. Ward, V. I. Hegde, M. G. Goesten, X. Yi and C. Wolverton, Phys. Rev. Mater., 2019, 3, 035404 CrossRef CAS.
- L.-D. Zhao, S.-H. Lo, Y. Zhang, H. Sun, G. Tan, C. Uher, C. Wolverton, V. P. Dravid and M. G. Kanatzidis, Nature, 2014, 508, 373 CrossRef CAS PubMed.
- C. W. Li, J. Hong, A. F. May, D. Bansal, S. Chi, T. Hong, G. Ehlers and O. Delaire, Nat. Phys., 2015, 11, 1063 Search PubMed.
- M. Markov, L. Alaerts, H. P. C. Miranda, G. Petretto, W. Chen, J. George, E. Bousquet, P. Ghosez, G.-M. Rignanese and G. Hautier, Proc. Natl. Acad. Sci. U.S.A., 2021, 118, e2026020118 CrossRef CAS PubMed.
- K. Momma and F. Izumi, J. Appl. Crystallogr., 2011, 44, 1272 CrossRef CAS.
- B. Eisenmann, H. Limartha, H. Schäfer and H. A. Graf, Z. Naturforsch., 1980, 35, 1518 CrossRef.
- C. Röhr and R. George, Z. Kristallogr., 1996, 478 Search PubMed.
- S. Xia and S. Bobev, J. Alloys Compd., 2007, 427, 67 CrossRef CAS.
- G. Kresse and J. Hafner, Phys. Rev. B: Condens. Matter Mater. Phys., 1993, 47, 558 CrossRef CAS PubMed.
- G. Kresse and J. Hafner, Phys. Rev. B: Condens. Matter Mater. Phys., 1994, 49, 14251 CrossRef CAS.
- G. Kresse and J. Furthmuller, Comput. Mater. Sci., 1996, 6, 15 CrossRef CAS.
- G. Kresse and J. Furthmüller, Phys. Rev. B: Condens. Matter Mater. Phys., 1996, 54, 11169 CrossRef CAS.
- P. E. Blöchl, Phys. Rev. B: Condens. Matter Mater. Phys., 1994, 50, 17953 CrossRef PubMed.
- G. Kresse and D. Joubert, Phys. Rev. B: Condens. Matter Mater. Phys., 1999, 59, 1758 CrossRef CAS.
- P. Pulay, Mol. Phys., 1969, 17, 197 CrossRef CAS.
- J. P. Perdew, K. Burke and M. Ernzerhof, Phys. Rev. Lett., 1996, 77, 3866 CrossRef.
- J. P. Perdew, A. Ruzsinszky, G. I. Csonka, O. A. Vydrov, G. E. Scuseria, L. A. Constantin, X. Zhou and K. Burke, Phys. Rev. Lett., 2008, 100, 136406 CrossRef PubMed.
- A. V. Krukau, O. A. Vydrov, A. F. Izmaylov and G. E. Scuseria, J. Chem. Phys., 2006, 125, 224106 CrossRef PubMed.
- J. Heyd, G. E. Scuseria and M. Ernzerhof, J. Chem. Phys., 2003, 118, 8207 CrossRef CAS.
- A. M. Ganose, J. Park, A. Faghaninia, R. Woods-Robinson, K. A. Persson and A. Jain, Nat. Commun., 2021, 12, 2222 CrossRef CAS PubMed.
- S. Poncé, W. Li, S. Reichardt and F. Giustino, Rep. Prog. Phys., 2020, 83, 036501 CrossRef PubMed.
- J. Noffsinger, F. Giustino, B. D. Malone, C. H. Park, S. G. Louie and M. L. Cohen, Comput. Phys. Commun., 2010, 181, 2140 CrossRef CAS.
- A. Faghaninia, G. Yu, U. Aydemir, M. Wood, W. Chen, G.-M. Rignanese, G. J. Snyder, G. Hautier and A. Jain, Phys. Chem. Chem. Phys., 2017, 19, 6743 RSC.
- J. H. Pohls, S. Chanakian, J. Park, A. M. Ganose, A. Dunn, N. Friesen, A. Bhattacharya, B. Hogan, S. Bux, A. Jain, A. Mar and A. Zevalkink, Mater. Horiz., 2021, 8, 209 RSC.
- G. K. H. Madsen and D. J. Singh, Comput. Phys. Commun., 2006, 175, 67 CrossRef CAS.
- S. Baroni, S. De Gironcoli, A. D. Corso and P. Giannozzi, Rev. Mod. Phys., 2001, 73, 515 CrossRef CAS.
- K. Parlinski, Z. Q. Li and Y. Kawazoe, Phys. Rev. Lett., 1997, 78, 4063 CrossRef CAS.
- G. Kresse, J. Furthmüller and J. Hafner, Europhys. Lett., 1995, 32, 729 CrossRef CAS.
- A. Togo, F. Oba and I. Tanaka, Phys. Rev. B: Condens. Matter Mater. Phys., 2008, 78, 134106 CrossRef.
- A. Togo and I. Tanaka, Scr. Mater., 2015, 108, 1 CrossRef CAS.
- A. Togo, L. Chaput and I. Tanaka, Phys. Rev. B: Condens. Matter Mater. Phys., 2015, 91, 094306 CrossRef.
- J. M. Skelton, A. J. Jackson, M. Dimitrievska, S. K. Wallace and A. Walsh, APL Mater., 2015, 3, 41102 CrossRef.
- L. D. Whalley, J. M. Skelton, J. M. Frost and A. Walsh, Phys. Rev. B, 2016, 94, 220301 CrossRef.
- S. N. H. Eliassen, A. Katre, G. K. H. Madsen, C. Persson, O. M. Løvvik and K. Berland, Phys. Rev. B, 2017, 95, 045202 CrossRef.
- C. Lee, S. Kim, W. J. Son, J. H. Shim and M. H. Whangbo, RSC Adv., 2020, 10, 14415 RSC.
- W. Li and N. Mingo, Phys. Rev. B: Condens. Matter Mater. Phys., 2014, 89, 184304 CrossRef.
- M. F. M. Taib, M. K. Yaakob, O. H. Hassan and M. Z. A. Yahya, Integr. Ferroelectr., 2013, 142, 119 CrossRef CAS.
- A. Jain and A. J. McGaughey, Comput. Mater. Sci., 2015, 110, 115 CrossRef CAS.
- J. M. Skelton, D. Tiana, S. C. Parker, A. Togo, I. Tanaka and A. Walsh, J. Chem. Phys., 2015, 143, 64710 CrossRef PubMed.
- J. M. Skelton, L. A. Burton, S. C. Parker, A. Walsh, C. E. Kim, A. Soon, J. Buckeridge, A. A. Sokol, C. R. A. Catlow, A. Togo and I. Tanaka, Phys. Rev. Lett., 2016, 117, 075502 CrossRef PubMed.
- J. M. Skelton, L. A. Burton, A. J. Jackson, F. Oba, S. C. Parker and A. Walsh, Phys. Chem. Chem. Phys., 2017, 19, 12452 RSC.
- A. H. Macdonald, S. H. Voskot and P. T. Coleridges, J. Phys. C Solid State Phys., 1979, 12, 2991 CrossRef CAS.
- P. E. Blochl, O. Jepsen and O. K. Andersen, Phys. Rev. B: Condens. Matter Mater. Phys., 1994, 49, 16223 CrossRef CAS PubMed.
- T. Tadano, Y. Gohda and S. Tsuneyuki, J. Phys. Condens. Matter, 2014, 26, 225402 CrossRef CAS PubMed.
- P. Haas, F. Tran and P. Blaha, Phys. Rev. B: Condens. Matter Mater. Phys., 2009, 79, 085104 CrossRef.
- C. N. Savory, A. M. Ganose and D. O. Scanlon, Chem. Mater., 2017, 29, 5156 CrossRef CAS.
- A. M. Ganose, M. Cuff, K. T. Butler, A. Walsh and D. O. Scanlon, Chem. Mater., 2016, 28, 1980 CrossRef CAS PubMed.
- A. M. Ganose, K. T. Butler, A. Walsh and D. O. Scanlon, J. Mater. Chem. A, 2016, 4, 2060 RSC.
- M. A. Tumelero, L. C. Benetti, E. Isoppo, R. Faccio, G. Zangari and A. A. Pasa, J. Phys. Chem. C, 2016, 120, 11797 CrossRef CAS.
- A. M Ganose, A. J Jackson and D. O Scanlon, J. Open Source Softw., 2018, 3, 717 CrossRef.
- A. J. Jackson, A. M. Ganose, A. Regoutz, R. G. Egdell and D. O. Scanlon, J. Open Source Softw., 2018, 3, 773 CrossRef.
- J. J. Yeh and I. Lindau, At. Data Nucl. Data Tables, 1985, 32, 1 CrossRef CAS.
- A. Walsh, G. W. Watson, D. J. Payne, G. Atkinson and R. G. Egdell, J. Mater. Chem., 2006, 16, 3452 RSC.
- C. N. Savory, A. M. Ganose, W. Travis, R. S. Atri, R. G. Palgrave and D. O. Scanlon, J. Mater. Chem., 2016, 4, 12648 RSC.
- B. A. D. Williamson, J. Buckeridge, J. Brown, S. Ansbro, R. G. Palgrave and D. O. Scanlon, Chem. Mater., 2017, 29, 2402 CrossRef CAS.
- D. S. Bhachu, S. J. Moniz, S. Sathasivam, D. O. Scanlon, A. Walsh, S. M. Bawaked, M. Mokhtar, A. Y. Obaid, I. P. Parkin, J. Tang and C. J. Carmalt, Chem. Sci., 2016, 7, 4832 RSC.
- P. Marchand, S. Sathasivam, B. A. Williamson, D. Pugh, S. M. Bawaked, S. N. Basahel, A. Y. Obaid, D. O. Scanlon, I. P. Parkin and C. J. Carmalt, J. Mater. Chem. C, 2016, 4, 6761 RSC.
- S. Sathasivam, R. R. Arnepalli, D. S. Bhachu, Y. Lu, J. Buckeridge, D. O. Scanlon, B. Kumar, K. K. Singh, R. J. Visser, C. S. Blackman and C. J. Carmalt, J. Phys. Chem. C, 2016, 120, 7013 CrossRef CAS.
- L. A. Burton and A. Walsh, Appl. Phys. Lett., 2013, 102, 132111 CrossRef.
- S. H. Wei and A. Zunger, Appl. Phys. Lett., 1998, 72, 2011 CrossRef CAS.
- J. Deuermeier, J. Gassmann, J. Brötz and A. Klein, J. Appl. Phys., 2011, 109, 113704 CrossRef.
- B. Höffling, A. Schleife, C. Rödl and F. Bechstedt, Phys. Rev. B: Condens. Matter Mater. Phys., 2012, 85, 035305 CrossRef.
- D. O. Scanlon and G. W. Watson, J. Mater. Chem., 2012, 22, 25236 RSC.
- Y. Kumagai, N. Tsunoda and F. Oba, Phys. Rev. Appl., 2018, 9, 34019 CrossRef CAS.
- P. D. C. King, T. D. Veal, P. H. Jefferson, J. Zúñiga-Pérez, V. Muñoz-Sanjosé and C. F. Mcconville, Phys. Rev. B: Condens. Matter Mater. Phys., 2009, 79, 035203 CrossRef.
- K. Fujita, T. Mochida and K. Nakamura, Jpn. J. Appl. Phys., 2001, 40, 4644 CrossRef CAS.
- I. Terasaki, Y. Sasago and K. Uchinokura, Phys. Rev. B: Condens. Matter Mater. Phys., 1997, 56, R12685 CrossRef CAS.
- J. M. Frost, Phys. Rev. B, 2017, 96, 195202 CrossRef.
- Y.-K. Jung, I. T. Han, Y. C. Kim and A. Walsh, npj Comput. Mater., 2021, 7, 51 CrossRef.
- J. Cao, J. D. Querales-Flores, A. R. Murphy, S. Fahy and I. Savić, Phys. Rev. B, 2018, 98, 205202 CrossRef.
- J. Ma, Y. Chen and W. Li, Phys. Rev. B, 2018, 97, 205207 CrossRef CAS.
- W. G. Zeier, A. Zevalkink, Z. M. Gibbs, G. Hautier, M. G. Kanatzidis and G. J. Snyder, Angew. Chem., Int. Ed., 2016, 55, 6826 CrossRef CAS PubMed.
- M. Ohtaki, K. Araki and K. Yamamoto, J. Electron. Mater., 2009, 38, 1234 CrossRef CAS.
- M. Shikano and R. Funahashi, Appl. Phys. Lett., 2003, 82, 1851 CrossRef CAS.
- Y. Wang, Y. Sui, J. Cheng, X. Wang and W. Su, J. Alloys Compd., 2009, 477, 817 CrossRef CAS.
- R. Funahashi and M. Shikano, Appl. Phys. Lett., 2002, 81, 1459 CrossRef CAS.
- S. Ohta, T. Nomura, H. Ohta and K. Koumoto, J. Appl. Phys., 2005, 97, 34106 CrossRef.
- D. Flahaut, T. Mihara, R. Funahashi, N. Nabeshima, K. Lee, H. Ohta and K. Koumoto, J. Appl. Phys., 2006, 100, 084911 CrossRef.
- J. Dong, O. F. Sankey, G. K. Ramachandran and P. F. Mcmillan, J. Appl. Phys., 2000, 87, 7726 CrossRef CAS.
- H. Lin, G. Tan, J.-N. Shen, S. Hao, L.-M. Wu, N. Calta, C. Malliakas, S. Wang, C. Uher, C. Wolverton and M. G. Kanatzidis, Angew. Chem., 2016, 128, 11603 CrossRef.
- R. Juneja and A. K. Singh, ACS Appl. Mater. Interfaces, 2019, 11, 33894 CrossRef CAS PubMed.
- A. A. El-Sharkawy, A. M. Abou Ei-Azm, M. I. Kenawy, A. S. Hillal and H. M. Abu-Basha, Int. J. Thermophys., 1983, 4, 261 CrossRef CAS.
- L. K. Lamontagne, G. Laurita, M. W. Gaultois, M. Knight, L. Ghadbeigi, T. D. Sparks, M. E. Gruner, R. Pentcheva, C. M. Brown and R. Seshadri, Chem. Mater., 2016, 28, 3367 CrossRef CAS.
- L. Lindsay, D. A. Broido and N. Mingo, Phys. Rev. B: Condens. Matter Mater. Phys., 2011, 83, 235428 CrossRef.
- D. Singh, J. Y. Murthy and T. S. Fisher, J. Appl. Phys., 2011, 110, 044317 CrossRef.
- L. Lindsay, W. Li, J. Carrete, N. Mingo, D. A. Broido and T. L. Reinecke, Phys. Rev. B: Condens. Matter Mater. Phys., 2014, 89, 155426 CrossRef.
- G. Fugallo, A. Cepellotti, L. Paulatto, M. Lazzeri, N. Marzari and F. Mauri, Nano Lett., 2014, 14, 6109 CrossRef CAS PubMed.
- M. Schrade, K. Berland, S. N. Eliassen, M. N. Guzik, C. Echevarria-Bonet, M. H. Sørby, P. Jenuš, B. C. Hauback, R. Tofan, A. E. Gunnæs, C. Persson, O. M. Løvvik and T. G. Finstad, Sci. Rep., 2017, 7, 13760 CrossRef PubMed.
- K. F. Hsu, S. Loo, F. Guo, W. Chen, J. S. Dyck, C. Uher, T. Hogan, E. K. Polychroniadis and M. G. Kanatzidis, Science, 2004, 303, 818 CrossRef CAS PubMed.
Footnote |
| † Electronic supplementary information (ESI) available. See DOI: 10.1039/d1ta03649a |
| This journal is © The Royal Society of Chemistry 2021 |

