Observation of the correlation between the phonon frequency and long-range magnetic ordering on a MnW octacyanide molecule-based magnet†
Hiroko
Tokoro
 *ab,
Naotaka
Maeda
a,
Kenta
Imoto
 b,
Koji
Nakabayashi
 b,
Kouji
Chiba
c and
Shin-ichi
Ohkoshi
 *b
*b
aDepartment of Materials Science, Faculty of Pure and Applied Sciences, University of Tsukuba, 1-1-1 Tennodai, Tsukuba, Ibaraki 305-8573, Japan. E-mail: tokoro@ims.tsukuba.ac.jp
bDepartment of Chemistry, School of Science, The University of Tokyo, 7-3-1 Hongo, Bunkyo-ku, Tokyo 113-0033, Japan. E-mail: ohkoshi@chem.s.u-tokyo.ac.jp
cMaterial Science Div., MOLSIS Inc., 3-19-9 Hatchobori, Chuo-ku, Tokyo 104-0032, Japan
First published on 26th June 2021
Abstract
We show an anomalous change in the phonon frequency at the magnetic phase transition on a cyanide-bridged bimetal assembly, Mn3[W(CN)8]2(pyrimidine)4·6H2O. This compound shows a frequency shift in the CN stretching mode below the magnetic phase transition temperature (TC). First-principles phonon mode calculation and molecular orbital calculation suggest that the frequency shift of the CN stretching mode is due to the competition of the magnetic energy and the elastic energy. This work demonstrates that a specific change in the phonon frequency is induced by long-range magnetic ordering in flexibly structured matter.
Introduction
Molecule-based magnets, which are composed of metal ions and ligands, are attractive from the viewpoints of rational molecular design and various functionalities.1–16 In molecule-based magnets, the influence of long-range magnetic ordering such as ferromagnetic (or ferrimagnetic) ordering on the phonon mode is of high interest. Structural flexibility due to the phonon mode in molecule-based magnets should allow changes in the physical properties when a magnetic phase transition occurs.17 From this viewpoint, we focus on a cyanide-bridged bimetal assembly18–47 as an example of a molecule-based magnet.48–53 This is a useful system owing to its various elastic interactions from the stretching modes, transverse translational modes, and transverse librational modes of the cyanide ligand.26–28 Due to such elastic interactions (phonon modes), the cyanide ligand plays a spring-like role in the cyanide-bridged bimetal assembly. To date, this structural flexibility has realized various types of structural phase transitions, including spin-crossover, charge-transfer, photo-induced, and electric-field-induced phase transitions.29–47Herein we show an anomalous change in the cyanide-stretching phonon mode at the magnetic phase transition, a correlation between the phonon frequency and long-range magnetic ordering, on an octacyanide-bridged manganese tungstate bimetal assembly.
Materials and methods
Materials
The cyanide-bridged manganese tungstate bimetal assembly was prepared using the reported synthesis method.54 Adding a 5.0 mL aqueous solution of MnCl2·4H2O (0.20 mol dm−3) to a 5.0 mL aqueous solution of Cs3[W(CN)8]·2H2O55 (0.14 mol dm−3) and a 0.1 mL aqueous solution of pyrimidine (1.35 mmol dm−3), yielded a dark brown microcrystal. Elemental analyses of the obtained powder sample showed that the formula was Mn3[W(CN)8]2(pyrimidine)4·6H2O56 (MnW); calculated: Mn, 11.91; W, 26.30; C, 27.97; N, 24.41; H, 2.10%: found; Mn, 12.17; W, 26.21; C, 28.04; N, 24.34; and H, 2.21%.Physical measurements
Elemental analyses for Mn and W were performed by an Agilent 7700x inductively coupled plasma mass spectroscopy, and for C, H, and N were performed by standard microanalytical methods. The magnetic properties were measured using a superconducting quantum interference device (SQUID) magnetometer (Quantum Design; MPMS-XL). Single crystal X-ray diffraction measurements at room temperature were performed using a Rigaku R-AXIS Rapid imaging plate area detector with graphite monochromated Mo Kα radiation. The crystal was covered with Paratone. The average correction of the diffraction data was performed in the Crystal Structure program in Rigaku. The crystal structure was solved by a direct method using SHELXS-97 and refined by the full-matrix least-squares method on F2 with SHELXL-2016/6 on Olex 2-1.2 software (CCDC 2061511).† IR spectra were recorded on a SHIMADZU IRAffinity-1S spectrometer using CaF2 plates as a sample holder. The temperature during the IR measurements was controlled by an Oxford Instrument MicrostatHe. Liquid paraffin was used as a thermal medium to keep thermal contact between the sample and the sample holder. For the temperature dependence plots of the IR peaks, peak separation was performed at each temperature, and the frequencies of the separated peaks were plotted.First-principles phonon mode calculation
First-principles calculations based on density functional theory were conducted for manganese octacyanotangstate, Mn3[W(CN)8]2(pyrimidine)4·6H2O, using the MedeA-VASP (Vienna ab initio simulation package) 5.4.4 code57,58 by GGA+U. Wave functions based on the plane waves and the potentials of the core orbitals were represented by the projector-augmented wave of Blöchl. The exchange–correlation term was evaluated by the generalized gradient approximation by Perdew, Burke, and Ernzerhof. The lattice parameters and atomic positions were optimized with an energy cut-off of 500 eV and a 3 × 3 × 3 k mesh until satisfying a 10−5 eV pm−1 force tolerance. 2 × 1 × 1 supercells of the optimized structures were used to calculate the phonon modes of Mn3[W(CN)8]2(pyrimidine)4·6H2O, which were determined by the direct method implemented in MedeA-Phonon57,59 with 2-pm displacements using the optimized atomic positions. The U–J values for Mn and W d-states were set to 4.0 eV and 2.2 eV, respectively.Results
Crystal structure and magnetic properties
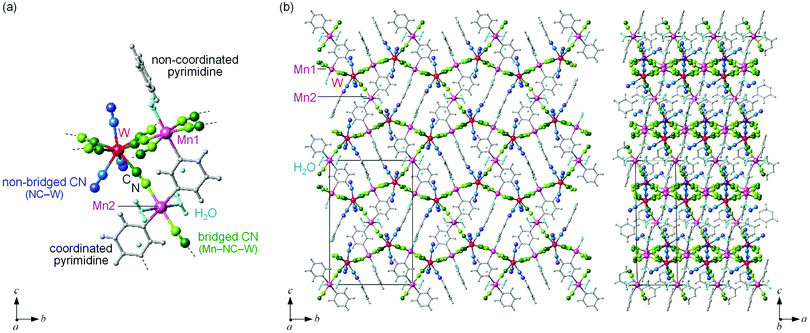
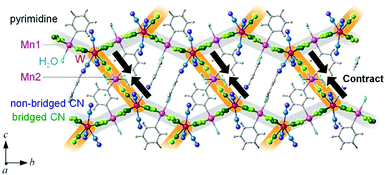
MnW was prepared by mixing an aqueous solution of manganese chloride, cesium octacyanotungstate, and pyrimidine, as previously reported (see Methods).54 The mid-infrared (IR) spectrum of MnW displays seven peaks around 2150–2190 cm−1 at room temperature, which are assigned to the CN stretching modes of MnII–NC–WV or NC–WV (Fig. S1, ESI†). Single-crystal X-ray structural analysis indicated that MnW has a monoclinic crystal structure in the P21/n space group with a lattice constant of a = 7.2319(4) Å, b = 14.9477(8) Å, c = 22.4483(13) Å, and β = 90.920(6)° at room temperature (Fig. 1 and Table S1, ESI†).60 In this compound, Mn (Mn1 and Mn2) and W are bridged by the CN ligand to form a three-dimensional network, i.e., the cyanide-bridged Mn1–W zigzag layers along the ab plane are linked by Mn2 (Fig. 1). The coordination geometries of the Mn (Mn1 and Mn2) and W sites are pseudo-octahedron (D4h) and square antiprism (D4d), respectively. Mn1 is bonded by four nitrogen atoms of [W(CN)8], one nitrogen atom of the pyrimidine molecule, and one oxygen atom of the coordinated water molecule, while Mn2 is bonded by two nitrogen atoms of [W(CN)8], two oxygen atoms of the coordinated water molecules, and two nitrogen atoms of the pyrimidine molecules. Five CN ligands from [W(CN)8] are bonded to four Mn1 and one Mn2, while the three CN ligands are non-coordinated. Pyrimidine molecules coordinate Mn1 and Mn2. The coordinated pyrimidine molecules link Mn1 and Mn2, and the non-coordinated pyrimidine molecules exist in the crystal structure.MnW exhibits spontaneous magnetization below the magnetic phase transition temperature (TC) of 47 K (Fig. 2a). The saturation magnetization (Ms) values at 2 K and 50 kOe are 13.2 μB (Fig. 2b and Fig. S4, ESI†). This corresponds to the theoretical Ms value of 13.0 μB with an antiparallel spin alignment between MnII (SMn = 5/2) and WV (SW = 1/2), indicating that MnW is a ferrimagnet.
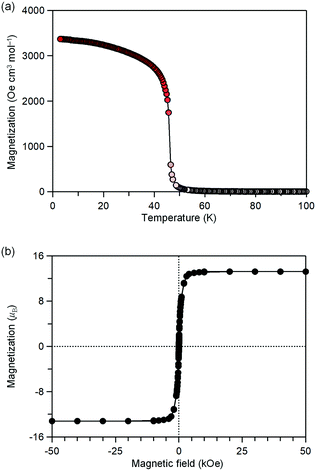 | ||
| Fig. 2 Magnetic properties of MnW. (a) Magnetization vs. temperature plot at 20 Oe. (b) Magnetic hysteresis loop at 2 K. | ||
Temperature dependence of the IR spectrum
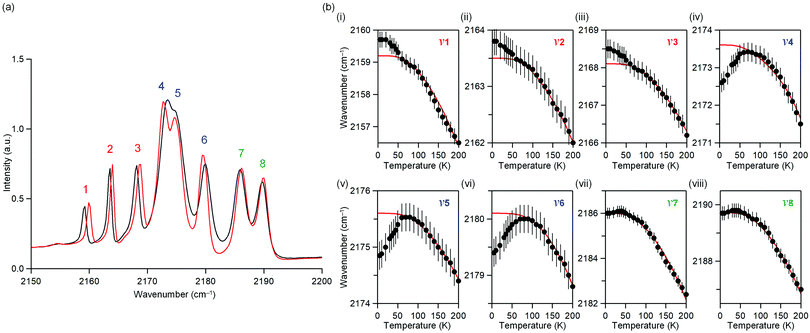
The temperature dependence of the IR spectrum in the magnetic ordering temperature region was studied. Fig. 3a shows the observed IR spectra at 5 K and 60 K. Around 2150–2200 cm−1, eight peaks due to the CN stretching frequency (ν) are observed. Here, the peaks are labelled as peaks 1–8 from the low energy frequency as shown in Fig. 3a.Fig. 3b shows the peak positions of the CN stretching frequency (ν1–ν8) versus temperature (Fig. S5, ESI†). Red line indicates the peak position obtained by fitting a theoretical equation of thermal expansion due to anharmonic phonons without magnetic ordering.61ν1, ν2, and ν3 shift towards higher frequencies below 50 K, indicating a contraction of the bonds bridged by CN, whereas ν4, ν5, and ν6 shift towards lower frequencies below 50 K, indicating an expansion of the bond. ν7 and ν8 do not shift below 50 K. The temperature dependence of the IR spectra indicates a correlation between the phonon mode of the CN stretching and the long-range magnetic ordering.
First-principles phonon mode calculation
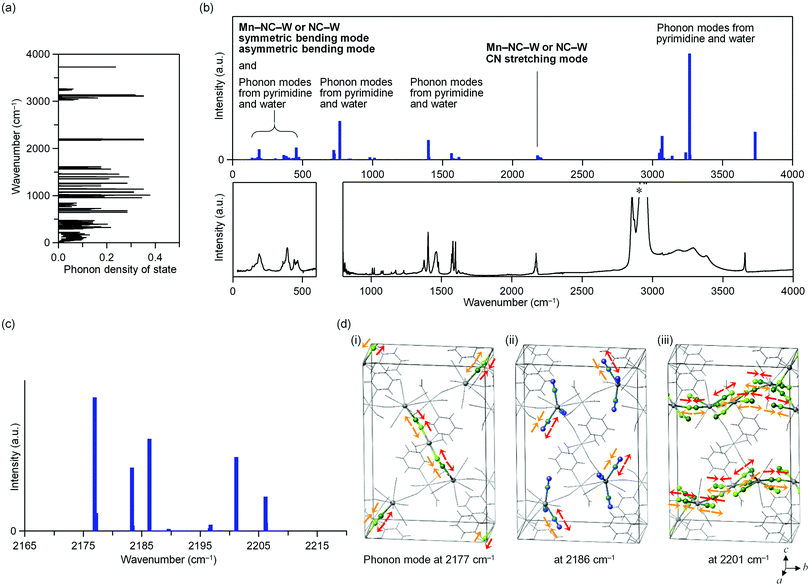
The phonon modes of MnW were obtained by first-principles calculations using the MedeA-Phonon (Fig. 4 and Fig. S6, S7, ESI†). The MnW has 567 optical phonon modes and 3 acoustic phonon modes. Fig. 4a show the calculated phonon density of states. The calculated transition probabilities of the optical phonon modes are shown in Fig. 4b (upper). In the region of 100–500 cm−1, the phonon modes due to the symmetric bending modes and asymmetric bending modes of Mn–N![[triple bond, length as m-dash]](https://www.rsc.org/images/entities/char_e002.gif) C–W or N
C–W or N![[triple bond, length as m-dash]](https://www.rsc.org/images/entities/char_e002.gif) C–W, pyrimidine molecule, and water molecule exist. By contrast, in the region of 2000–2500 cm−1, the phonon modes due to the CN stretching modes of Mn–N
C–W, pyrimidine molecule, and water molecule exist. By contrast, in the region of 2000–2500 cm−1, the phonon modes due to the CN stretching modes of Mn–N![[triple bond, length as m-dash]](https://www.rsc.org/images/entities/char_e002.gif) C–W or N
C–W or N![[triple bond, length as m-dash]](https://www.rsc.org/images/entities/char_e002.gif) C–W exist. In the regions of 500–1700 and 3000–4000 cm−1, phonon modes due to pyrimidine molecule and water molecule exist, respectively. From these results, in the region of 2000–2500 cm−1, only the CN stretching modes are present.
C–W exist. In the regions of 500–1700 and 3000–4000 cm−1, phonon modes due to pyrimidine molecule and water molecule exist, respectively. From these results, in the region of 2000–2500 cm−1, only the CN stretching modes are present.
Fig. 4c shows the optical transition probabilities of the CN stretching phonon modes. The strong transition probabilities are positioned at 2177, 2183, 2186, 2201, and 2206 cm−1. The mode at 2177 cm−1 originates from the CN stretching modes of the bridged CN between Mn2 and W (Mn2–NC–W) and the bond between layers (Fig. 4d(i)). The modes at 2183 and 2186 cm−1 are due to the CN stretching modes of the non-bridged CN (NC–W) (Fig. 4d(ii)). The modes 2201 and 2206 cm−1 originate from the CN stretching modes of the bridged CN between Mn1 and W (Mn1–NC–W) and the bond in layer (Fig. 4d(iii)).
Magnetic orbitals
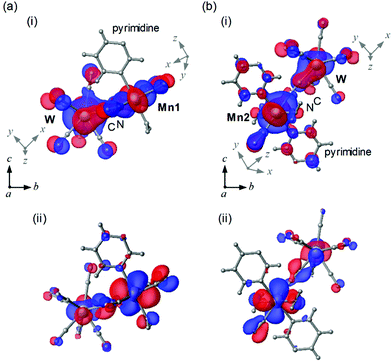
To study the magnetic orbitals of MnW, the discrete variable (DV)-Xα method was used to calculate the Mn–N![[triple bond, length as m-dash]](https://www.rsc.org/images/entities/char_e002.gif) C–W molecular orbitals. Mn1 and W have magnetic orbitals, i.e., Mn1dxy–N2py
C–W molecular orbitals. Mn1 and W have magnetic orbitals, i.e., Mn1dxy–N2py![[triple bond, length as m-dash]](https://www.rsc.org/images/entities/char_e002.gif) C2py–Wdz2 (Mn1dxy–W) (Fig. 5a(i)) and Mn1dzx–N2py
C2py–Wdz2 (Mn1dxy–W) (Fig. 5a(i)) and Mn1dzx–N2py![[triple bond, length as m-dash]](https://www.rsc.org/images/entities/char_e002.gif) C2pz–Wdz2 (Mn1dzx–W) (Fig. 5a(ii)). The overlapping orbitals in Mn1dxy–W derived from Mn1 and W indicate an antiferromagnetic superexchange pathway. In Mn1dzx–W, the orthogonalized orbitals derived from Mn1 and W denote a ferromagnetic superexchange pathway. For Mn2 and W, magnetic orbitals are calculated, i.e., Mn2dzx–N2px
C2pz–Wdz2 (Mn1dzx–W) (Fig. 5a(ii)). The overlapping orbitals in Mn1dxy–W derived from Mn1 and W indicate an antiferromagnetic superexchange pathway. In Mn1dzx–W, the orthogonalized orbitals derived from Mn1 and W denote a ferromagnetic superexchange pathway. For Mn2 and W, magnetic orbitals are calculated, i.e., Mn2dzx–N2px![[triple bond, length as m-dash]](https://www.rsc.org/images/entities/char_e002.gif) C–Wdz2 (Mn2dzx–W) (Fig. 5b(i)) and Mn2dyz–N2px
C–Wdz2 (Mn2dzx–W) (Fig. 5b(i)) and Mn2dyz–N2px![[triple bond, length as m-dash]](https://www.rsc.org/images/entities/char_e002.gif) C2py–Wdz2 (Mn2dyz–W) (Fig. 5b(ii)). The overlapping orbitals in Mn2dzx–W derived from Mn2 and W indicate an antiferromagnetic superexchange pathway. In Mn2dyz–W, the orthogonalized orbitals derived from Mn2 and W denote a ferromagnetic the superexchange pathway. These calculations suggest that the magnetic interactions between Mn and W (Mn1–W and Mn2–W) are composed of two opposite magnetic contributions, i.e., antiferromagnetic and ferromagnetic pathways.
C2py–Wdz2 (Mn2dyz–W) (Fig. 5b(ii)). The overlapping orbitals in Mn2dzx–W derived from Mn2 and W indicate an antiferromagnetic superexchange pathway. In Mn2dyz–W, the orthogonalized orbitals derived from Mn2 and W denote a ferromagnetic the superexchange pathway. These calculations suggest that the magnetic interactions between Mn and W (Mn1–W and Mn2–W) are composed of two opposite magnetic contributions, i.e., antiferromagnetic and ferromagnetic pathways.
Discussion
The first-principles calculation indicates that the phonon modes in the region of 2000–2500 cm−1 originate from the CN stretching modes. These modes can be classified into three types: CN stretching modes due to (i) the bridged CN between the layers (Mn2–NC–W), (ii) the non-bridged CN (NC–W), and (iii) the bridged CN in the layer (Mn1–NC–W). For the experimentally observed IR peaks below TC, the temperature dependence is divided into three types: (i) a shift to a higher frequency (peaks 1, 2, and 3), (ii) a shift to a lower frequency (peaks 4, 5, and 6), and (iii) no shift (peaks 7 and 8) as the temperature decreases. Comparing the positions of the calculated phonon modes with the observed IR peaks suggest the following assignments: the CN stretching modes of the bridged CN between the layers (Mn2–NC–W) shift to a higher frequency, the CN stretching mode of the non-bridged CN (NC–W) shifts to a lower frequency, and the CN stretching mode of the bridged CN in the layer (Mn1–NC–W) does not shift. Because the peak shift to a higher frequency indicates contraction of the bond, (whereas the peak shift to a lower frequency indicates expansion), the shifts of the IR peaks indicate that the Mn2–NC–W bonds contract, the non-bridged NC–W bonds expand, and the Mn1–NC–W bonds are unchanged below TC (Fig. 6). These results imply that the long-range magnetic ordering is correlated with the CN bridged bonds below TC.62Let us consider the mechanism of contraction (or expansion) of the CN bridged bond. In MnW, bond contraction (or expansion) is observed below TC. That is, bond contraction (or expansion) stabilizes the energy of the system below TC. In the energy of the system, which dominates the expansion and contraction of the CN bridged bonds, there are two kinds of energies, i.e., magnetic energy and elastic energy. Here, the magnetic energy is considered. Stabilization of the magnetic energy means an increase of the J value. Hence, let us consider the necessary condition for bond contraction (or expansion) from the viewpoint of the J value. The molecular orbital calculations indicate that the magnetic interactions between Mn and W are composed of two kinds of superexchange pathways: antiferromagnetic (AF) and ferromagnetic (F) pathways. When the bond length between Mn and W at TC is set as the origin, the superexchange interaction between Mn and W is indicated as J(0), i.e., |J(0)| = |JAF(0)| − |JF(0)|. Here, the antiferromagnetic and ferromagnetic superexchange interactions are indicated as JAF and JF, respectively. When the bond length between Mn and W changes x, the magnetic interaction is described as |J(0+x)| = |JAF(0+x)| − |JF(0+x)|. For contraction, |J(0+x)| > |J(0)| should be satisfied with x < 0 (Fig. 7).59–61 By contrast, for expansion, |J(0+x)| > |J(0)| should be satisfied with x > 0. Whether the bond contracts or expands depends on the x dependence of JAF and JF. In other words, two kinds of superexchange pathways, JAF and JF, contribute to different behaviors such as contraction, lack of change, or expansion. Needless to say, the gain of the magnetic energy should exceed the loss of the elastic energy due to contraction or expansion.
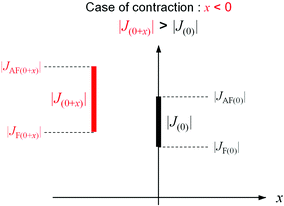 | ||
| Fig. 7 Relationship between |J(0+x)| and |J(0)| in the case of bond contraction (x < 0).66 | ||
The competition of the magnetic energy and the elastic energy along with the balance of the antiferromagnetic and ferromagnetic superexchange pathways can explain the contraction of the Mn2–NC–W bond. The lack of change in the Mn1–NC–W bond can be understood because the loss of elastic energy outweighs the gain of the magnetic energy. For the low frequency shift in the NC–W bond, where no magnetic interactions operate, it is attributed to the rearrangement due to the Mn2–NC–W contraction.
Conclusions
Octacyanide-bridged manganese tungstate displays a correlation between the CN stretching phonon frequency and the long-range magnetic ordering. This compound shows a relatively high TC, isolated CN stretching modes, which do not overlap with other phonon modes such as those from organic ligands (Fig. S7, ESI†), and possesses a good stability under both vacuum and atmospheric conditions. The CN stretching frequency is closely related to the metal–cyanide bond length. The competition between the magnetic energy and elastic energy along the balance of the antiferromagnetic and ferromagnetic superexchange pathways can explain the bond contraction or the lack of change. This work demonstrates that a specific change in the phonon mode is induced by long-range magnetic ordering in flexibly structured soft matter. Compared to conventional magnets (metal magnets and metal oxide magnet), soft matter such as molecule-based magnets can exhibit various magnetic functionalities such as photomagnetism, vapor response magnetism, pressure response magnetism, spin-ionics, etc.1,7,17,69–71 Fundamental knowledge about the correlation between the phonon mode (lattice vibration) and long-range magnetic ordering should help us understand the magnetic functionality and the design of future soft materials with magnetic functionality. This study is the first step in research to elucidate magnetic functionalities from the viewpoint of the correlation between the phonon mode and long-range magnetic ordering. Furthermore, this work should lead to the understanding of magnetostriction in molecular-based magnets.72 This knowledge may be extended to the materials science field of coordination polymers.Conflicts of interest
The authors declare no competing financial interest.Acknowledgements
The present research was supported in part by JSPS KAKENHI (16H06521) Coordination Asymmetry, a JSPS Grant-in-Aid for Scientific Research(A) (20H00369), and a Grant-in-Aid for Scientific Research on Innovative Area Soft Crystals (17H06367). We acknowledge the Cryogenic Research Center, The University of Tokyo, the Center for Nano Lithography & Analysis, The University of Tokyo supported by MEXT, and Quantum Leap Flagship Program (Q-LEAP) by MEXT. We are grateful to M. Yoshikiyo for the technical support.Notes and references
- M. Verdaguer, A. Bluezen, V. Marvaud, J. Vaissermann, M. Seuleiman, C. Desplanches, A. Scuiller, C. Train, R. Garde, G. Gelly, C. Lomenech, I. Rosenman, P. Veillet, C. Cartier and F. Villan, Coord. Chem. Rev., 1999, 192, 1023–1047 CrossRef.
- T. Mallah, S. Thiébaut, M. Verdaguer and P. Veillet, Science, 1993, 262, 1554–1557 CrossRef PubMed.
- S. Ferlay, T. Mallah, R. Ouahès, P. Veillet and M. Verdaguer, Nature, 1995, 378, 701–703 CrossRef.
- S. M. Holmes and G. S. Girolami, J. Am. Chem. Soc., 1999, 121, 5593–5594 CrossRef.
- J. S. Miller, Inorg. Chem., 2000, 39, 4392–4408 CrossRef.
- F. Renz, H. Oshio, V. Ksenofontov, M. Waldeck, H. Spiering and P. Gütlich, Angew. Chem., Int. Ed., 2000, 39, 3699–3700 CrossRef.
- S. Ohkoshi, K. Arai, Y. Sato and K. Hashimoto, Nat. Mater., 2004, 3, 857–861 CrossRef PubMed.
- S. S. Kaye and J. R. Long, J. Am. Chem. Soc., 2005, 127, 6506–6507 CrossRef PubMed.
- X.-Y. Wang, C. Avendaño and K. R. Dunbar, Chem. Soc. Rev., 2011, 40, 3213–3238 RSC.
- M. Clemente-León, E. Coronado, C. Marti-Gastaldo and F. M. Romero, Chem. Soc. Rev., 2011, 40, 473–497 RSC.
- S. Ohkoshi, K. Imoto, Y. Tsunobuchi, S. Takano and H. Tokoro, Nat. Chem., 2011, 3, 564–569 CrossRef.
- H.-W. Lee, R. Y. Wang, M. Pasta, S. W. Lee, N. Liu and Y. Cui, Nat. Commun., 2014, 5, 5280 CrossRef.
- R. Bertoni, M. Lorenc, H. Cailleau, A. Tissot, J. Laisney, M.-L. Boillot, L. Stoleriu, A. Stancu, C. Enachescu and E. Collet, Nat. Mater., 2016, 15, 606–610 CrossRef PubMed.
- A. C. Felts, A. Slimani, J. M. Cain, M. J. Andrus, A. R. Ahir, K. A. Abboud, M. W. Meisel, K. Boukheddaden and D. R. Talham, J. Am. Chem. Soc., 2018, 140, 5814–5824 CrossRef.
- A. Adam, M. Poggi, E. Larquet, R. Cortès, L. Martinelli, P.-E. Coulon, E. Lahera, O. Proux, D. Chernyshov, K. Boukheddaden, T. Gacoin and I. Maurin, Nanoscale, 2018, 10, 16030–16039 RSC.
- L. Trinh, S. Zerdane, S. Mazérat, D. Dragoe, C. Herrero, E. Riviere, L. Catala, M. Cammarata, E. Collet and T. Mallah, Inorg. Chem., 2020, 59, 13153–13161 CrossRef.
- S. Ohkoshi, K. Nakagawa, K. Tomono, K. Imoto, Y. Tsunobuchi and H. Tokoro, J. Am. Chem. Soc., 2010, 132, 6620–6621 CrossRef PubMed.
- J.-P. Launay and M. Verdaguer, Electrons in Molecules: From Basic Principles to Molecular Electronics, Oxford Univ. Press, Oxford, 2017 Search PubMed.
- W. D. Griebler and D. Babel, Z. Naturforsch. B, 1982, 87, 832–837 CrossRef.
- S. Ohkoshi, T. Iyoda, A. Fujishima and K. Hashimoto, Phys. Rev. B: Condens. Matter Mater. Phys., 1997, 56, 11642–11652 CrossRef.
- Ø. Hatlevik, W. E. Buschmann, J. Zhang, J. L. Manson and J. S. Miller, Adv. Mater., 1999, 11, 914–918 CrossRef.
- S. Ohkoshi, Y. Abe, A. Fujishima and K. Hashimoto, Phys. Rev. Lett., 1999, 82, 1285–1288 CrossRef.
- A. L. Goodwin, K. W. Chapman and C. J. Kepert, J. Am. Chem. Soc., 2005, 127, 17980–17981 CrossRef PubMed.
- A. Bleuzen, C. Lomenech, V. Escax, F. Villain, F. Varret, C. Cartier dit Moulin and M. Verdaguer, J. Am. Chem. Soc., 2000, 122, 6648–6652 CrossRef.
- E. Coronado, M. C. Gimenez-Lopez, G. Levchenko, F. M. Romero, V. Garcia-Baonza, A. Milner and M. Paz-Pasternak, J. Am. Chem. Soc., 2005, 127, 4580–4581 CrossRef.
- H. Tokoro, K. Nakagawa, K. Imoto, F. Hakoe and S. Ohkoshi, Chem. Mater., 2012, 24, 1324–1330 CrossRef.
- S. Ohkoshi, M. Yoshikiyo, A. Namai, K. Nakagawa, K. Chiba, R. Fujiwara and H. Tokoro, Sci. Rep., 2017, 7, 8088 CrossRef.
- H. Tokoro, A. Namai, M. Yoshikiyo, R. Fujiwara, K. Chiba and S. Ohkoshi, Sci. Rep., 2018, 8, 63 CrossRef PubMed.
- P. Gütlich, Y. Garcia and T. Woike, Coord. Chem. Rev., 2001, 219, 839–879 CrossRef.
- O. Sato, S. Hayami, Y. Einaga and Z.-Z. Gu, Bull. Chem. Soc. Jpn., 2003, 76, 443–470 CrossRef CAS.
- H. Tokoro and S. Ohkoshi, Dalton Trans., 2011, 40, 6825–6833 RSC.
- J. M. Herrera, V. Marvaud, M. Verdaguer, J. Marrot, M. Kalisz and C. Mathonière, Angew. Chem., Int. Ed., 2004, 43, 5468–5471 CrossRef CAS.
- S. Margadonna, K. Prassides and A. N. Fitch, J. Am. Chem. Soc., 2004, 126, 15390–15391 CrossRef CAS.
- T. Mahfoud, G. Molnár, S. Bonhommeau, S. Cobo, L. Salmon, P. Demont, H. Tokoro, S. Ohkoshi, K. Boukheddaden and A. Bousseksou, J. Am. Chem. Soc., 2009, 131, 15049–15054 CrossRef CAS PubMed.
- H. Tokoro, T. Matsuda, T. Nuida, Y. Moritomo, K. Ohoyama, E. D. L. Dangui, K. Boukheddaden and S. Ohkoshi, Chem. Mater., 2008, 20, 423–428 CrossRef CAS.
- E. Coronado, M. Makarewicz, J. P. Prieto-Ruiz, H. Prima-Garcia and F. M. Romero, Adv. Mater., 2011, 23, 4323–4326 CrossRef CAS.
- O. N. Risset, P. A. Quintero, T. V. Brinzari, M. J. Andrus, M. W. Lufaso, M. W. Meisel and D. R. Talham, J. Am. Chem. Soc., 2014, 136, 15660–15669 CrossRef CAS.
- S. Ohkoshi, S. Takano, K. Imoto, M. Yoshikiyo, A. Namai and H. Tokoro, Nat. Photonics, 2014, 8, 65–71 CrossRef CAS.
- D. Pinkowicz, M. Rams, M. Mišek, K. V. Kamenev, H. Tomkowiak, A. Katrusiak and B. Sieklucka, J. Am. Chem. Soc., 2015, 137, 8795–8802 CrossRef CAS.
- E. Milin, V. Patinec, S. Triki, E.-E. Bendeif, S. Pillet, M. Marchivie, G. Chastanet and K. Boukheddaden, Inorg. Chem., 2016, 55, 11652 CrossRef CAS.
- K. Ridier, A. Bas, V. Shalabaeva, W. Nicolazzi, L. Salmon, G. Molnár, A. Bousseksou, M. Lorenc, R. Bertoni, E. Collet and H. Cailleau, Adv. Mater., 2019, 31, 1901361 CrossRef.
- F. J. Luque, I. A. Kowalik, J. P. Prieto-Ruiz, M. Á. Niño, H. Prima-García, F. M. Romero, D. Arvanitis, C. Mathonière, E. Coronado, R. Miranda and J. J. de Miguel, J. Mater. Chem. C, 2019, 7, 2305–2317 RSC.
- T. Yoshida, K. Nakabayashi, H. Tokoro, M. Yoshikiyo, A. Namai, K. Imoto, K. Chiba and S. Ohkoshi, Chem. Sci., 2020, 11, 8989–8998 RSC.
- X. Qi, S. Pillet, C. de Graaf, M. Magott, E.-E. Bendeif, P. Guionneau, M. Rouzières, V. Marvaud, O. Stefańczyk, D. Pinkowicz and C. Mathonière, Angew. Chem., Int. Ed., 2020, 59, 3117–3127 CrossRef CAS.
- T. Korzeniak, S. Sasmal, D. Pinkowicz, W. Nitek, R. Pełka, D. Czernia, O. Stefańczyk and B. Sieklucka, Inorg. Chem., 2020, 59, 5872–5882 CrossRef CAS PubMed.
- S. Chorazy, T. Charytanowicz, D. Pinkowicz, J. Wang, K. Nakabayashi, S. Klimke, F. Renz, S. Ohkoshi and B. Sieklucka, Angew. Chem., Int. Ed., 2020, 59, 15741 CrossRef CAS.
- M. Magott, M. Reczyński, B. Gaweł, B. Sieklucka and D. Pinkowicz, J. Am. Chem. Soc., 2018, 140, 15876 CrossRef CAS PubMed.
- O. Kahn, Molecular Magnetism, Wiley-VCH, Germany, 1993 Search PubMed.
- K. W. Chapman, P. J. Chupas and C. J. Kepert, J. Am. Chem. Soc., 2005, 127, 15630–15636 CrossRef CAS.
- J. S. Miller and A. J. Epstein, Angew. Chem., Int. Ed. Engl., 1994, 33, 385–415 CrossRef.
- A. J. Banister, N. Bricklebank, I. Lavender, J. M. Rawson, C. I. Gregory, B. K. Tanner, W. Clegg, M. R. J. Elsegood and F. Palacio, Angew. Chem., Int. Ed. Engl., 1996, 35, 2533–2535 CrossRef CAS.
- R. Jain, K. Kabir, J. B. Gilroy, K. A. R. Mitchell, K. Wong and R. G. Hicks, Nature, 2007, 445, 291–294 CrossRef CAS PubMed.
- C. Train, R. Gheorghe, V. Krstic, L. M. Chamoreau, N. S. Ovanesyan, G. L. J. A. Rikken, M. Gruselle and M. Verdaguer, Nat. Mater., 2008, 7, 729–734 CrossRef CAS.
- T. Kashiwagi, S. Ohkoshi, H. Seino, Y. Mizobe and K. Hashimoto, J. Am. Chem. Soc., 2004, 126, 5024–5025 CrossRef CAS.
- C. R. Dennis, A. J. van Wyk, S. S. Basson and J. G. Leipoldt, Transition Met. Chem., 1992, 17, 471–473 CrossRef CAS.
- MnW can be expressed by the following formula: [{Mn (pyrimidine)(H2O)}2{Mn(H2O)2}{W(CN)8}2](pyrimidine)2·2H2O.
- MedeA 2.22.3, MedeA-Phonon 2.0 and MedeA-VASP 5.4.4, Materials Design Inc., San Diego CA, USA, 2018.
- G. Kresse and J. Furthmüller, Phys. Rev. B: Condens. Matter Mater. Phys., 1996, 54, 11169 CrossRef CAS.
- K. Parlinski, Z. Q. Li and Y. Kawazoe, Phys. Rev. Lett., 1997, 78, 4063–4066 CrossRef CAS.
- The results of the TGA measurement (Fig. S2, ESI†) and the PXRD pattern with the Rietveld analysis (Fig. S3, ESI†) indicate the high purity and homogeneous character of MnW.
- F. Sayetat, P. Fertey and M. Klessler, J. Appl. Crystallogr., 1998, 31, 121–127 CrossRef.
- Generally, the values of the superexchange interaction in a cyanide-bridged complex magnet range between less than 1 to several cm−1 (ca. ∼5 cm−1).1,11,63–65 The observed shift of the CN stretching frequency is ca. ∼1 cm−1, a reasonable value of the frequency shift .
- S. Ohkoshi, Y. Abe, A. Fujishima and K. Hashimoto, Phys. Rev. Lett., 1999, 82, 1285–1288 CrossRef CAS.
- S. Ohkoshi and K. Hashimoto, J. Am. Chem. Soc., 1999, 121, 10591–10597 CrossRef CAS.
- H. Tokoro, S. Ohkoshi, T. Matsuda, T. Hozumi and K. Hashimoto, Chem. Phys. Lett., 2004, 388, 379–383 CrossRef CAS.
- In general, when the bond contracts and the hybridization of nearest-neighbor orbitals becomes stronger, the electronic transition between the orbitals is promoted, so that the exchange interaction J between spins, represented by the overlap integral between the orbitals, becomes stronger.67,68 In contrast, when the bond expands and the hybridization between nearest-neighbor orbitals weakens, the electronic transition between the orbitals is suppressed, that the J becomes weak .
- M. Mochizuki, M. Kobayashi, R. Okabe and D. Yamamoto, Phys. Rev. B, 2018, 97, 060401(R) CrossRef.
- M. Kobayashi and M. Mochizuki, Phys. Rev. Mater., 2019, 3, 024407 CrossRef CAS.
- W. Kosaka, K. Yamagishi, J. Zhang and H. Miyasaka, J. Am. Chem. Soc., 2014, 136, 12304–12313 CrossRef CAS.
- L. Egan, K. Kamenev, D. Papanikolaou, Y. Takabayashi and S. Margadonna, J. Am. Chem. Soc., 2006, 128, 6034–6035 CrossRef CAS.
- D. Pinkowicz, M. Rams, M. Mišek, K. V. Kamenev, H. Tomkowiak, A. Katrusiak and B. Sieklucka, J. Am. Chem. Soc., 2015, 1237, 8795–8802 CrossRef.
- A. Lappas, A. S. Wills, M. A. Green, K. Prassides and M. Kurmoo, Phys. Rev. B: Condens. Matter Mater. Phys., 2003, 67, 144406 CrossRef.
Footnote |
| † Electronic supplementary information (ESI) available: Results of IR spectrum at room temperature, crystallographic data, TGA data, powder XRD pattern and Rietveld analysis, magnetic properties, IR spectra and peak separation, phonon dispersions, partial phonon density of states obtained by first-principles phonon mode calculations, and far-IR spectra at 12 K and 60 K. CCDC 2061511. For ESI and crystallographic data in CIF or other electronic format see DOI: 10.1039/d1tc01048d |
| This journal is © The Royal Society of Chemistry 2021 |

