
Fluorescent sensor array based on aggregation-induced emission luminogens for pathogen discrimination†
Zelin
Li‡
a,
Li
Xu‡
 b,
Huanxiang
Yuan
*a and
Pengbo
Zhang
*c
b,
Huanxiang
Yuan
*a and
Pengbo
Zhang
*c
aDepartment of Chemistry, College of Chemistry and Materials Engineering, Beijing Technology and Business University, Beijing 100048, P. R. China. E-mail: yhx@iccas.ac.cn
bDepartment of Pharmacy, Hubei University of Chinese Medicine, Wuhan 430065, P. R. China
cSchool of Chemistry and Biological Engineering, University of Science and Technology Beijing, 30 Xueyuan Road, Haidian District, Beijing, 100083, China. E-mail: zhangpengbo@ustb.edu.cn
First published on 2nd May 2022
Abstract
A high-throughput tetraphenylethylene (TPE)-based fluorescent sensor array was constructed for the identification and detection of microorganisms, which utilizes three TPE derivatives with different numbers of cationic side chains to detect and discriminate various microorganisms at concentrations down to 1 × 10³ CFU mL−1.
Introduction
Pathogenic microorganisms are a constant threat to public health protection.1,2 Therefore, as the first step in the treatment of pathogenic infections, the detection and identification of pathogenic bacteria are crucial, playing an important role in clinical diagnosis, food safety and environmental monitoring. According to statistics, more than one million deaths are caused by infectious diseases every year, and this number might be elevated to 10 million annually by 2050.3 Furthermore, considering that one infectious illness might be related to various pathogen species, it is vital to determine the type of pathogen causing the disease before any targeted antimicrobial therapy to avoid the generation of broad-spectrum drug resistance.The most commonly used methods for microbial identification are plating and culture to observe the morphological structures of the microorganisms.4,5 However, the technical application of these methods is limited and time-consuming as they can only detect pathogens with special morphologies. Enzyme-linked immunosorbent assays (ELISA)6,7 and polymerase chain reactions (PCR)8–11 are more preferable and accurate methods to detect the genetic and immunological characteristics of bacteria, but these detection methods are intricate and complex, require expensive detection equipment or professionally trained staff, and cannot be applied in clinically large-scale situations.12 Hence, there is an urgent need for a rapid and reliable method to identify various pathogens for the precise treatment of infectious diseases.
With the continuous development of imaging technology for modern life sciences, methods involving fluorescence imaging technology based on fluorescent materials13 have attracted more and more attention in pathogen detection due to their real-time,14in situ, high sensitivity and resolution.15,16 However, most fluorescent probes, including proteins,17,18 organic molecules and inorganic nanoparticles,19–21 have the disadvantages of photobleaching, toxicity and aggregation-caused quenching (ACQ), resulting in a dramatic drop in their fluorescence signal, as well as limiting the actual working concentration to a very low level and presenting inherent limitations in the development of efficient biological detection probes for microbes.
Since Tang's group discovered and proposed the aggregation-induced emission (AIE) behavior of fluorescent materials with specific structures,22 these have appealed widely to researchers in various fields for the design of optical materials.23–29 Among the AIE core structures, tetraphenylethylene (TPE) and its derivatives can increase the fluorescence quantum yield by 3 orders of magnitude in the aggregated state. Furthermore, as a representative AIE material, the TPE series of molecules can well meet the needs of ideal fluorescent sensors due to their highly efficient preparation and easy functionalization, showing broad application prospects in the fields of biomolecular sensing and bioimaging.30–33
Productive artificial tongue34 or fluorescent array sensors35 based on TPE materials have been reported, which proved that TPE has potential as an identification material and could readily discern microorganisms with the assistance of linear discriminant analysis (LDA). Nevertheless, low precision and lack of competence to judge the range of pathogen concentrations still limit its development. Consequently, there is still a pressing demand to simplify the sensor array and improve accuracy. In the meantime, it is of great significance to design a sensor array that can determine the concentration range of pathogenic bacteria under reasonable conditions.
Here, we have translated the fluorescence response of AIE materials into a general LDA and designed a fluorescent sensor array that can be used for the detection and identification of microbes. This fluorescent sensor array consists of three TPE materials with various side chains and different amounts of charges (Scheme 1). It is well known that there are negatively charged components and different hydrophobic groups on the surface of pathogens; so, the multiple interactions between different pathogens and TPE materials can be utilized to create distinguishing degrees of aggregation and thus trigger changes in the fluorescence signal. With the assistance of LDA, different bacteria or fungi can be detected and identified efficiently and accurately.
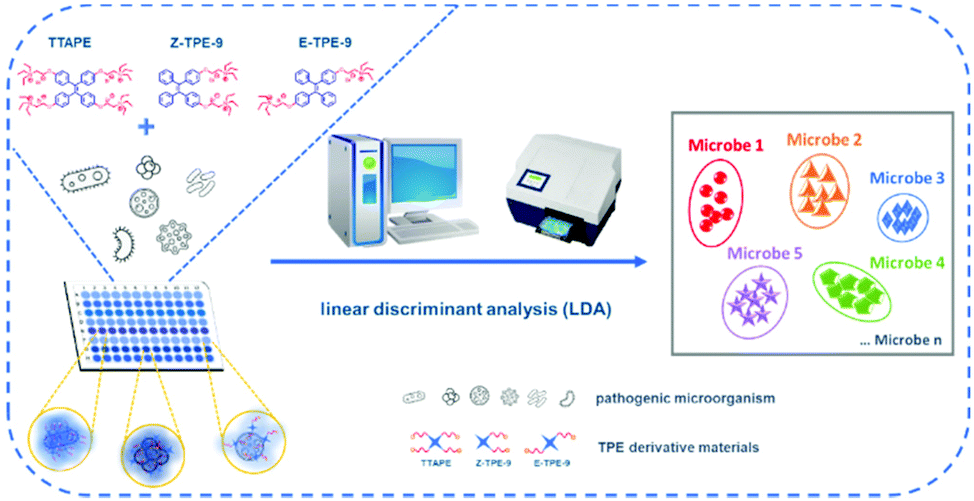 | ||
| Scheme 1 Diagram of the fluorescent sensor array consisting of three TPE materials for the identification of multiple microorganisms using LDA analysis. | ||
Results and discussion
Diverse fluorescence responses of TPE materials after binding with microbes
Three TPE materials (TTAPE, Z-TPE-9, and E-TPE-9) with various side chains and different amounts of positive charges were utilized to construct the fluorescent sensor array. The structures are shown in Scheme 1. TTAPE has four side chains with four positive charges, while Z-TPE-9 and E-TPE-9 are cis–trans isomers with two side chains and two positive charges. Since different types of bacteria and fungi have diverse, multiple surface structures and various amounts of negative charges, when they interact with these three kinds of TPE materials (TPEs), different degrees of aggregation of TTAPE, Z-TPE-9 or E-TPE-9 may occur through electrostatic interactions or hydrophobic interactions, leading to significant and various increases in fluorescence intensity to further achieve the effect of microbial differentiation.Ampicillin-resistant Escherichia coli (AmprE. coli), Staphylococcus aureus (S. aureus) and Candida albicans (C. albicans) were selected as representative strains of Gram-negative bacteria, Gram-positive bacteria and fungi, respectively, to be incubated with different concentrations of TPE solutions, and the fluorescence spectra of the TPEs are shown in Fig. 1. It can be seen from the figure that the fluorescence intensity of the same TPE material varies significantly in the presence of different microbes, and the fluorescence response of S. aureus treated with the same concentrations of TPEs changes the most obviously. With the increase in concentration, the fluorescence intensity changes more demonstrably to exhibit concentration dependence. Although the addition of different microorganisms to the TPE solution causes obvious changes in fluorescence intensity, the maximum emission wavelength of the fluorescence is almost constant (at 461 nm), which provides great convenience for the detection of microorganisms. Therefore, this kind of TPE material has the potential to be used as a fluorescent sensor array to distinguish microbes.
 | ||
| Fig. 1 Fluorescence spectra of TTAPE, Z-TPE-9 and E-TPE-9 (5, 10, 25, 50, 75, and 100 μM) with the addition of AmprE. coli, S. aureus and C. albicans after 30 min of incubation, respectively. | ||
Taking TTPAE as an example, it aggregated to different degrees resulting in various fluorescence responses when incubated with AmprE. coli, S. aureus, and C. albicans. S. aureus caused the strongest fluorescence increase of TTAPE, while there was little difference between AmprE. coli and C. albicans. This may be due to the smaller size and the porous peptidoglycan structure of S. aureus, which binds more easily to the positively charged TTAPE in greater numbers. The outer membrane of AmprE. coli and the dense cell wall of C. albicans partially protect them from the absorption of TPEs. The situation is similar for Z-TPE-9 or E-TPE-9. In order to more intuitively reflect the fluorescence changes of different TPE materials and different microorganisms after incubation, photographs were taken under UV light as shown in Fig. S1.† It could be visibly seen that the fluorescence of S. aureus upon the addition of TPE materials was the strongest and those of AmprE. coli and C. albicans were comparatively weak. This phenomenon is consistent with the fluorescence intensity displayed by the fluorescence spectra. Thus, the possibility of identifying and differentiating microorganisms using these three TPE materials was fully demonstrated.
Fluorescence microscopy was used to more directly observe the binding of TPEs with three representative microorganisms. From Fig. 2, it can be seen that these TPE materials can not only effectively stain microbes, but also show diverse response signals. Clearly, the microorganisms in the blank group were evenly dispersed and had no fluorescence, while the microorganisms added to TPEs had different degrees of aggregation and emitted blue fluorescence with varying degrees of intensity. This phenomenon was most obvious for S. aureus, followed by C. albicans, while E. coli was almost non-aggregated and evenly distributed. Moreover, there was little change in the zeta potentials of AmprE. coli or C. albicans before and after binding TPEs, while the zeta potential of S. aureus incubated with the TPEs displayed a significant positive shift (Table S1†). It was further proved that S. aureus could bind more TPEs causing a greater aggregation of AIE materials and showing stronger fluorescence emission. This proved that TPEs could effectively combine a variety of microorganisms and produce different degrees of aggregation to distinguish various bacteria or fungi, and all microorganisms in the field of vision could be stained, which was also a prerequisite for designing a sensor array capable of identifying microorganisms.
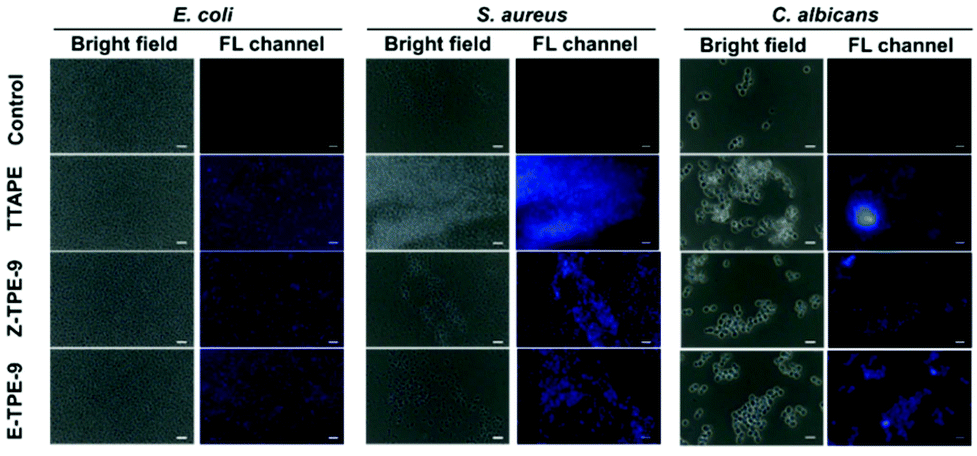 | ||
| Fig. 2 Fluorescence microscopy images of TTAPE, Z-TPE-9 and E-TPE-9 before and after incubation with E. coli, S. aureus, and C. albicans, respectively. The scale bar is 10 μm. | ||
To determine the appropriate concentration of the TPE sensor array, the fluorescence intensity variations of TPEs to microorganisms were calculated at various concentrations (5, 10, 25, 50, 75, and 100 μM). A high-throughput technique was used to record the relative fluorescence intensities of TPEs before and after the addition of E. coli, S. aureus or C. albicans. The fluorescence intensity of the TPE solutions added to the microbes at 461 nm with excitation at 330 nm was denoted as I, while the PBS solution of TPEs at the same concentration was used as the control group, the fluorescence value of which at 461 nm was measured as I0. The relative fluorescence intensity of TPE combined with three microorganisms is expressed by (I − I0)/I0, and the results are shown in Fig. 3. The diversity of the side chains and the charges of TPEs caused specific interactions with microbe strains, which resulted in different fluorescence feedbacks. These biological characteristics of TPEs provided a basis for constructing a fluorescence fingerprint to achieve a microbiological classification. S. aureus showed high relative fluorescence intensity after binding with TPEs, while for Gram-negative bacteria and fungi, the difference in the fluorescence response before and after incubation with TPEs was comparatively small. This result was consistent with fluorescence microscope characterization studies. And a very favorable result was that for all materials mentioned, there was no significant difference in the fluorescence response signal for different microorganisms combining with TPEs at low or high concentration. Even for Z-TPE-9 and E-TPE-9, the difference in fluorescence response at higher concentrations became less pronounced, which demonstrated that TPEs could achieve the effect of distinguishing microorganisms at extremely low concentrations. Therefore, 5 μM and 10 μM were selected as the test concentrations of the TPE fluorescent sensor array, which has the dual advantages of cost saving and accuracy.
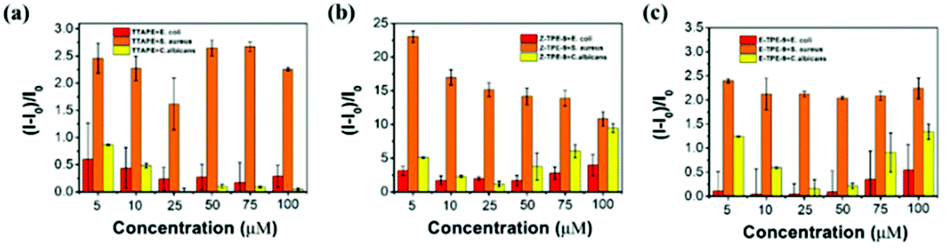 | ||
| Fig. 3 Histograms of the fluorescence ratio of different concentrations of (a) TTAPE, (b) Z-TPE-9 and (c) E-TPE-9 bound with three microorganisms. (I is the fluorescence intensity value of TPEs with the addition of microorganisms at 461 nm and I0 is the fluorescence intensity value of TPEs alone at 461 nm at the same concentration.) | ||
Minimum detectable concentration of the TPE fluorescent sensor array
Five different microbial strains were selected as targets for further discrimination demonstration. AmprE. coli, Pseudomonas aeruginosa (P. aeruginosa), S. aureus, Bacillus licheniformis (B. licheniformis) and C. albicans are representatives of bacteria and fungi. The fluorescence intensities of the TPEs (5 μM and 10 μM) combined with five microorganisms were obtained by using a microplate reader and then we distinguished between different microorganisms based on the calculated relative fluorescence intensity values for the interaction of TPEs with a variety of microorganisms. The plus and minus signs were used to describe the strength of the relative fluorescence intensities. One minus (−) sign represents the weakest fluorescent response signal and four plus signs (++++) denote the strongest response. The data are summarized in Fig. S2.† According to the evaluation criterion, Gram-positive bacteria (S. aureus or B. licheniformis) could be distinguished by using only 5 μM Z-TPE-9 or E-TPE-9 (++) and B. licheniformis (+) could be more accurately discerned from other microorganisms by TTAPE (5 μM). When the concentration of TPEs was increased to 10 μM, only Z-TPE-9 could distinguish B. licheniformis (+++), S. aureus (++) and E. coli (+), while the fluorescence signals of other microorganisms were weaker (−) for accurate identification, which meant that the ability to distinguish the relative fluorescence intensity histograms did not fully meet our expectations.Subsequently, an alternative method (LDA) was introduced to more accurately analyze the diverse fluorescence response patterns of microbes generated by the TPE sensor array, which was a very powerful statistical method that could be widely used in pattern recognition.34,36,37 The fluorescence patterns of microbes before and after adding TPEs (Fig. 4a) could be transformed into a 2D canonical score plot by LDA (Fig. 4b). A 5 μM TPE fluorescent sensor array was able to clearly distinguish E. coli, P. aeruginosa and S. aureus without interfering with each other, but for B. licheniformis and C. albicans, the identification areas overlapped and the distinction was less satisfactory. We therefore proceeded to convert the fluorescence pattern of the 10 μM TPE fluorescent sensor array (Fig. 4c) into a 2D canonical score plot (Fig. 4d), at which point B. licheniformis and C. albicans could be further commendably separated. Fascinatingly, the distribution of five microorganisms in the 2D canonical score plot correlated clearly with their categories, where fungi were on the lower left, Gram-positive bacteria were on the upper left, and Gram-negative bacteria were on the right. Therefore, this TPE fluorescent sensor array using LDA analysis could accurately distinguish microbial species even at very low concentrations (10 μM), which was momentous for the rapid and simple differentiation of microbial species and targeted clinical treatment.
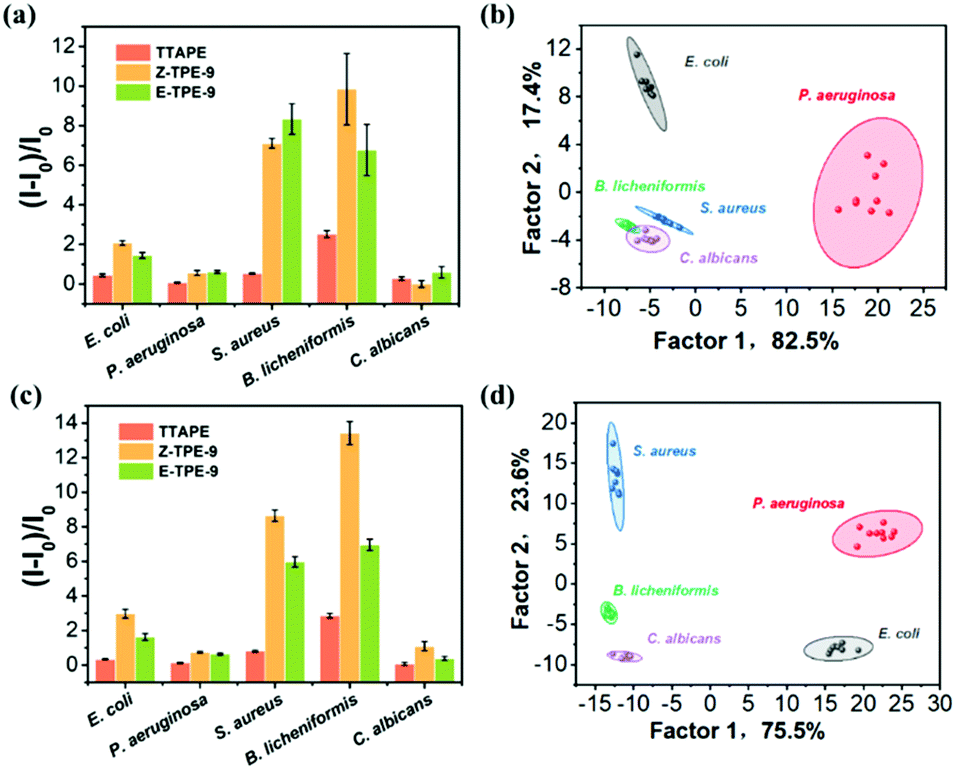 | ||
| Fig. 4 Fluorescence response patterns of five microbes stained by (a) 5 μM or (c) 10 μM TPE materials, respectively. Canonical score plot for the fluorescence response patterns determined by LDA using (b) 5 μM or (d) 10 μM TPE fluorescence arrays. (Ellipses represent the 95% confidence intervals for the corresponding microorganisms.) | ||
Determination of the minimum discrimination concentration of microorganisms by the TPE fluorescent sensor array
In addition to perfectly distinguishing the types of microorganisms, this TPE fluorescent sensor array was also tested and implemented for the identification of microbial species at different concentrations. One representative strain each of Gram-positive bacteria, Gram-negative bacteria and fungi was selected for the experiment. The fluorescence intensity of the TPE fluorescent sensor array was measured before and after binding to different concentrations of microbes (1–1 × 10⁵ CFU mL−1) using a microplate reader. Then the relative fluorescence intensity was calculated to obtain histograms (Fig. S3†). Regrettably, these did not differ significantly from each other and therefore did not meet the basic needs for classification. Hence, the histograms were transformed into 2D canonical score plots again (Fig. 5). The results showed that excellent differentiation of the various species could be achieved at a minimum concentration of 1 × 10³ CFU mL−1. However, the areas of different types of microbes in the 2D canonical score plots overlapped each other when the concentration of the microorganisms decreased to 100 CFU mL−1. This analysis proved the high sensitivity of the TPE fluorescent sensor array, which could achieve 100% identification accuracy even at microbial concentrations as low as 1 × 10³ CFU mL−1. | ||
| Fig. 5 2D standard score plots of the fluorescence response transformed by LDA at microbial concentrations of (a) 1 × 10⁵ CFU mL−1, (b) 1 × 10⁴ CFU mL−1, (c) 1 × 10³ CFU mL−1, (d) 100 CFU mL−1, (e) 10 CFU mL−1, and (f) 1 CFU mL−1. (Ellipses indicate 95% confidence intervals for each microorganism.) | ||
Detection of the microbial concentration range
To investigate whether the actual concentration of a particular strain could be accurately determined by this TPE fluorescent sensor array, different concentrations (1 × 10³–1 × 10⁸ CFU mL−1) of S. aureus were selected as representative bacteria for the experiment. The TPE fluorescent sensor array (5 μM, 10 μM) was added with S. aureus and subsequently tested for fluorescence intensity at 461 nm after excitation at 330 nm using a microplate reader. Then, as shown in Fig. S4†, the relative fluorescence intensity was obtained. There was no doubt that the histograms made it almost impossible to determine the actual concentration of microorganisms; so, the more intuitive 2D standard score plot was applied to accurately analyze the difference in the fluorescence responses of various concentrations of S. aureus to TPEs (Fig. 6). The concentration range of S. aureus above 1 × 10⁵ CFU mL−1 was readily determined regardless of whether the concentration of the TPE fluorescent array sensor was 5 μM or 10 μM, which was vital for rapid clinical determination of microbial concentrations and appropriate drug dose. | ||
| Fig. 6 2D standard score plots obtained by LDA analysis after incubation with (a) 5 μM or (b) 10 μM TPE fluorescent sensor arrays with different concentrations of S. aureus. (Ellipses depict the 95% confidence limits for each pathogen.) | ||
Conclusions
In summary, we successfully constructed a sensor array consisting of TPEs (TTAPE, Z-TPE-9, and E-TPE-9) with different positive charges and hydrophobic chains, which could be designed to modulate the interaction between the TPEs and microorganisms with diverse surface structures. Meanwhile, TPEs with AIE properties provided a unique fluorescence response pattern for different microorganisms. With the help of LDA, microbes could be efficiently identified at very low concentrations of TPEs (10 μM). Importantly, this sensor array realized 100% accuracy with distinguishable microbial concentrations as low as 1 × 10³ CFU mL−1 within just 40 min. Moreover, this identification procedure is able to determine the actual concentration range of a particular microbe, providing clinical assistance in targeting pathogenic bacteria and in appropriate dosage of drugs that are not likely to cause the development of drug-resistant bacteria or fungi. Thus, this TPE fluorescent sensor array is a simple and high throughput microbial identification platform that has great potential for the detection and identification of microorganisms in the clinical setting.Author contributions
Zelin Li: investigation, data curation, formal analysis, and writing – original preparation; Li Xu: methodology, synthesis, and data curation; Huanxiang Yuan: conceptualization, methodology, funding acquisition, supervision, and writing – review and editing; Pengbo Zhang: formal analysis, methodology, validation, and supervision. Zelin Li and Li Xu contributed equally.Conflicts of interest
There are no conflicts to declare.Acknowledgements
The authors gratefully acknowledge the Beijing Technology and Business University Excellent Youth Fund Cultivation Plan.Notes and references
- J. Geddes-McAlister and R. S. Shapiro, Ann. N. Y. Acad. Sci., 2019, 1435, 57–78 CrossRef PubMed
.
-
L. W. Riley, in Annual Review of Food Science and Technology, Vol 11, ed. M. P. Doyle and D. J. McClements, 2020, vol. 11, pp. 275–294 Search PubMed
- C. J. L. Murray, K. S. Ikuta, F. Sharara, L. Swetschinski, G. R. Aguilar, A. Gray, C. Han, C. Bisignano, P. Rao, E. Wool, S. C. Johnson, A. J. Browne, M. G. Chipeta, F. Fell, S. Hackett, G. Haines-Woodhouse, B. H. K. Hamadani, E. A. P. Kumaran, B. McManigal, R. Agarwal, S. Akech, S. Albertson, J. Amuasi, J. Andrews, A. Aravkin, E. Ashley, F. Bailey, S. Baker, B. Basnyat, A. Bekker, R. Bender, A. Bethou, J. Bielicki, S. Boonkasidecha, J. Bukosia, C. Carvalheiro, C. Castaneda-Orjuela, V. Chansamouth, S. Chaurasia, S. Chiurchiu, F. Chowdhury, A. J. Cook, B. Cooper, T. R. Cressey, E. Criollo-Mora, M. Cunningham, S. Darboe, N. P. J. Day, M. De Luca, K. Dokova, A. Dramowski, S. J. Dunachie, T. Eckmanns, D. Eibach, A. Emami, N. Feasey, N. Fisher-Pearson, K. Forrest, D. Garrett, P. Gastmeier, A. Z. Giref, R. C. Greer, V. Gupta, S. Haller, A. Haselbeck, S. I. Hay, M. Holm, S. Hopkins, K. C. Iregbu, J. Jacobs, D. Jarovsky, F. Javanmardi, M. Khorana, N. Kissoon, E. Kobeissi, T. Kostyanev, F. Krapp, R. Krumkamp, A. Kumar, H. H. Kyu, C. Lim, D. Limmathurotsakul, M. J. Loftus, M. Lunn, J. Ma, N. Mturi, T. Munera-Huertas, P. Musicha, M. M. Mussi-Pinhata, T. Nakamura, R. Nanavati, S. Nangia, P. Newton, C. Ngoun, A. Novotney, D. Nwakanma, C. W. Obiero, A. Olivas-Martinez, P. Olliaro, E. Ooko, E. Ortiz-Brizuela, A. Y. Peleg, C. Perrone, N. Plakkal, A. Ponce-de-Leon, M. Raad, T. Ramdin, A. Riddell, T. Roberts, J. VictoriaRobotham, A. Roca, K. E. Rudd, N. Russell, J. Schnall, J. A. G. Scott, M. Shivamallappa, J. Sifuentes-Osornio, N. Steenkeste, A. J. Stewardson, T. Stoeva, N. Tasak, A. Thaiprakong, G. Thwaites, C. Turner, P. Turner, H. R. van Doorn, S. Velaphi, A. Vongpradith, H. Vu, T. Walsh, S. Waner, T. Wangrangsimakul, T. Wozniak, P. Zheng, B. Sartorius, A. D. Lopez, A. Stergachis, C. Moore, C. Dolecek, M. Naghavi and C. Antimicrobial Resistance, Lancet, 2022, 399, 629–655 CrossRef CAS
- A. Loukil, F. Darriet-Giudicelli, C. Eldin and M. Drancourt, J. Clin. Microbiol., 2018, 56, e01108-18 CrossRef PubMed
- N. Yamaguchi, M. Sasada, M. Yamanaka and M. Nasu, Cytometry, Part A, 2003, 54A, 27–35 CrossRef PubMed
- C. Li, Y. C. Yang, D. Wu, T. Q. Li, Y. M. Yin and G. X. Li, Chem. Sci., 2016, 7, 3011–3016 RSC
- Q. Zhao, D. Lu, G. Y. Zhang, D. Zhang and X. B. Shi, Talanta, 2021, 223, 121722 CrossRef CAS PubMed
- P. Athamanolap, K. Hsieh, C. M. O'Keefe, Y. Zhang, S. Yang and T. H. Wang, Anal. Chem., 2019, 91, 12784–12792 CrossRef CAS PubMed
- B. W. Shu, C. S. Zhang and D. Xing, Biosens. Bioelectron., 2017, 97, 360–368 CrossRef CAS PubMed
- T. Soejima, J. Minami, T. Yaeshima and K. Iwatsuki, Appl. Microbiol. Biotechnol., 2012, 95, 485–497 CrossRef CAS PubMed
- X. Xie, S. W. Wang, S. C. Jiang, J. Bahnemann and M. R. Hoffmann, Environ. Sci. Technol. Lett., 2016, 3, 57–61 CrossRef CAS
- E. Cesewski and B. N. Johnson, Biosens. Bioelectron., 2020, 159, 112214 CrossRef CAS PubMed
- Z. L. Li, W. Lu, S. C. Jia, H. X. Yuan and L. H. Gao, ACS Appl. Bio Mater., 2021, 4, 370–386 CrossRef CAS PubMed
- H. X. Yuan, Z. L. Li, H. T. Bai, Z. Chen, C. Yao, S. C. Jia, L. Li, R. L. Qi and C. H. Zhao, Mater. Chem. Front., 2021, 5, 6611–6617 RSC
- J. S. Han, H. R. Cheng, B. H. Wang, M. S. Braun, X. B. Fan, M. Bender, W. Huang, C. Domhan, W. Mier, T. Lindner, K. Seehafer, M. Wink and U. H. F. Bunz, Angew. Chem., Int. Ed., 2017, 56, 15246–15251 CrossRef CAS PubMed
- M. Y. Yin, C. Jing, H. J. Li, Q. L. Deng and S. Wang, J. Nanobiotechnol., 2020, 18, 41 CrossRef CAS PubMed
- M. Kubankova, I. Lopez-Duarte, J. A. Bull, D. M. Vadukul, L. C. Serpell, M. de Saint Victor, E. Stride and M. K. Kuimova, Biomaterials, 2017, 139, 195–201 CrossRef CAS PubMed
- H. Wang, X. Wang, P. Li, M. Y. Dong, S. Q. Yao and B. Tang, Chem. Sci., 2021, 12, 11620–11646 RSC
- H. Huang, W. Feng, Y. Chen and J. L. Shi, Nano Today, 2020, 35, 100972 CrossRef CAS
- D. Jaque, C. Richard, B. Viana, K. Soga, X. G. Liu and J. G. Sole, Adv. Opt. Photonics, 2016, 8, 1–103 CrossRef
- Q. Q. Liu, Y. J. Kim, G. B. Im, J. T. Zhu, Y. Z. Wu, Y. J. Liu and S. H. Bhang, Adv. Funct. Mater., 2021, 31, 2008171 CrossRef CAS
- J. D. Luo, Z. L. Xie, J. W. Y. Lam, L. Cheng, H. Y. Chen, C. F. Qiu, H. S. Kwok, X. W. Zhan, Y. Q. Liu, D. B. Zhu and B. Z. Tang, Chem. Commun., 2001, 1740–1741, 10.1039/b105159h
- X. L. Cai and B. Liu, Angew. Chem., Int. Ed., 2020, 59, 9868–9886 CrossRef CAS PubMed
- S. J. Chen, H. Wang, Y. N. Hong and B. Z. Tang, Mater. Horiz., 2016, 3, 283–293 RSC
- Y. C. Chen, J. W. Y. Lam, R. T. K. Kwok, B. Liu and B. Z. Tang, Mater. Horiz., 2019, 6, 428–433 RSC
- J. Liang, G. X. Feng, R. T. K. Kwok, D. Ding, B. Z. Tang and B. Liu, Sci. China: Chem., 2016, 59, 53–61 CrossRef CAS
- R. Hu, A. J. Qin and B. Z. Tang, Prog. Polym. Sci., 2020, 100, 101176 CrossRef CAS
- J. Shi, Y. Li, Q. Q. Li and Z. Li, ACS Appl. Mater. Interfaces, 2018, 10, 12278–12294 CrossRef CAS PubMed
- J. Shi, Q. C. Deng, Y. Li, Z. Zheng, H. J. Shangguan, L. Li, F. H. Huang and B. Tang, Chem. Commun., 2019, 55, 6417–6420 RSC
- J. R. Xu, W. X. Ji, C. Li, Y. F. Lv, Z. J. Qiu, L. C. Gao, E. Q. Chen, J. W. Y. Lam, B. Z. Tang and L. Jiang, Adv. Opt. Mater., 2018, 6, 1701149 CrossRef
- L. Zhao, Y. F. Chen, J. Yuan, M. H. Chen, H. Zhang and X. H. Li, ACS Appl. Mater. Interfaces, 2015, 7, 5177–5186 CrossRef CAS PubMed
- X. J. Zhao, H. J. Zhao, S. Wang, Z. W. Fan, Y. Ma, Y. M. Yin, W. Wang, R. M. Xi and M. Meng, J. Am. Chem. Soc., 2021, 143, 20828–20836 CrossRef CAS PubMed
- J. Shi, Q. C. Deng, C. Y. Wan, M. M. Zheng, F. H. Huang and B. Tang, Chem. Sci., 2017, 8, 6188–6195 RSC
- G. J. Liu, S. N. Tian, C. Y. Li, G. W. Xing and L. Zhou, ACS Appl. Mater. Interfaces, 2017, 9, 28331–28338 CrossRef CAS PubMed
- C. C. Zhou, W. H. Xu, P. B. Zhang, M. J. Jiang, Y. C. Chen, R. T. K. Kwok, M. M. S. Lee, G. G. Shan, R. L. Qi, X. Zhou, J. W. Y. Lam, S. Wang and B. Z. Tang, Adv. Funct. Mater., 2019, 29, 1805986 CrossRef
- H. Bai, Z. Y. Liu, T. F. Zhang, J. Du, C. C. Zhou, W. He, J. H. C. Chau, R. T. K. Kwok, J. W. Y. Lam and B. Tang, ACS Nano, 2020, 14, 7552–7563 CrossRef CAS PubMed
- L. B. Zheng, P. Qi and D. Zhang, Sens. Actuators, B, 2019, 286, 206–213 CrossRef CAS
Footnotes |
| † Electronic supplementary information (ESI) available. See DOI: https://doi.org/10.1039/d2an00643j |
| ‡ These authors contributed equally. |
| This journal is © The Royal Society of Chemistry 2022 |