Constructing oxygen vacancy-enriched Fe2O3@NiO heterojunctions for highly efficient electrocatalytic alkaline water splitting†
Yan
Sang
 *,
Xi
Cao
,
Gaofei
Ding
,
Zixuan
Guo
,
Yingying
Xue
,
Guohong
Li
and
Runhan
Yu
College of Chemistry and Materials Science, The Key Laboratory of Functional Molecular Solids, Ministry of Education, Anhui Laboratory of Molecular-Based Materials, The Key Laboratory of Electrochemical Clean Energy of Anhui Higher Education Institutes, Anhui Normal University, Wuhu, 241002, P. R. China. E-mail: sangyan@mail.ahnu.edu.cn
First published on 15th November 2021
Abstract
Electrolysis of water to produce high-purity hydrogen is a very promising method. The development of green, high-efficiency, long-lasting and low-cost dual function electrocatalysts for oxygen evolution reaction (OER) and hydrogen evolution reaction (HER) is essential for electrocatalytic total water splitting. In this work, oxygen vacancy-enriched Fe2O3@NiO heterojunctions as bifunctional electrocatalysts are prepared through a facile one-step hydrothermal method followed by a calcination process. The synergistic effect of Fe2O3 and NiO, as well as the rich oxygen vacancies in Fe2O3, optimize their electronic structures, leading to an enhanced charge transfer rate and improved catalytic ability. Therefore, in both OER and HER processes, overpotentials needed for the Fe2O3@NiO catalyst to achieve the current density of 10 mA cm−2 under alkaline conditions are 224 mV and 187 mV, respectively. Furthermore, the catalyst showed excellent dynamic characteristics and durability. This research provides a new strategy for regulating the electronic structure of bifunctional catalysts by heterostructures and oxygen vacancies, thereby promoting the performance of total water splitting.
1. Introduction
The discovery of sustainable, green and cheap new energy to replace traditional fuels has attracted extensive attention.1–3 Hydrogen (H2) has become a promising alternative energy source due to its high specific energy density and environmentally friendly features in many energy sources. Water splitting is a very effective strategy for producing high-purity hydrogen. The water-splitting process is divided into oxygen evolution reaction (OER) on the anode and hydrogen evolution reaction (HER) on the cathode.4–6 Among them, OER has been regarded as an important process of water decomposition.7 However, OER is hampered by ultra-high potential because it is a coupled four-electron proton process with slow reaction dynamics.8,9 The precious-metal-based catalysts such as RuO2, Pt/C and IrO2 are currently the most effective catalysts for OER and HER, however, their high price and low abundance greatly restrict their extensive use.10,11 Therefore, the development of cheap and environmentally friendly non-noble metal-based catalysts has become the focus of attention. In particular, it has great potential to optimize the performance of catalysts by controlling the structure and composition using earth-abundant transition metals.12–14In recent years, transition metal-based catalysts (e.g. nitrides,15,16 phosphides,17,18 oxides,19,20 sulfides,21 layered double hydroxide22) have been widely used in research on HER and OER electrocatalysts. Among them, transition metal oxides have been widely investigated because of their simple method, environmental friendliness and stable electrocatalytic performance.23,24 However, transition metal oxides are generally considered inefficient catalysts toward HER.25 Therefore, for the sake of improving the activity of transition metal oxide bifunctional catalyst, it is an effective strategy to introduce or form a large number of defects into the catalyst.26,27 Numerous studies have shown that structural defects can adjust the electronic structure and surface properties, and optimize the H2O adsorption energy on the active site, thereby enhancing the catalytic activity.28,29 In addition, the generation of oxygen vacancies as structural defects can improve the strong adsorption behavior of H2O, which leads to the excellent electrocatalytic performance of OER and HER and realizes the overall water splitting.30 According to the study by Lee et al., a large number of oxygen vacancies caused by chloride ions increased the number of active sites of (nickel foam) NF, thereby significantly improving the overall catalytic performance of water decomposition.31 Similarly, Liang and coworkers reported that the electronic structure of g-C3N4@CeO2 photocatalyst was optimized by oxygen vacancies, which greatly improved the efficiency of charge separation and transfer and promoted the photocatalytic reduction of CO2.32
On the other hand, previous reports show that heterojunction electrode materials greatly improve electrocatalytic performance. Two compounds in a heterojunction are connected with each other, which produces a synergistic effect on the interface of epitaxial growth and inward growth.33,34 Furthermore, the heterojunction can reduce the energy barrier of the water decomposition process and optimize the adsorption/desorption of intermediates.35 Fe2O3@NiO heterojunctions have generated extensive attention in energy conversion fields because they optimize the adsorption/desorption of intermediates, enhancing active surface and efficient mass transport.36 For instance, the individual p-NiO/n-Fe2O3 heterojunction nanowires were constructed by Singh et al. through electrodeposition of Fe and Ni NWs inside the pores of the anodic alumina template followed by controlled oxidation.37 The p–n junction of NiO/P-α-Fe2O3 was prepared by Li et al. for photoelectrochemical water splitting.38 Nevertheless, the synthesis of these Fe2O3@NiO heterojunctions usually requires more than two steps or templates. There is no report on the preparation of oxygen vacancy-enriched Fe2O3@NiO heterojunctions by a simple hydrothermal method followed by a calcination process without any template and surfactant. According to the above discussion, constructing a heterogeneous nanostructure with rich oxygen vacancies is an effective method to further increase the dual-function catalytic activities of electrocatalysts.
Herein, we report that oxygen vacancy-enriched Fe2O3@NiO heterojunction can be formed by a simple hydrothermal method followed by a calcination process without any template and surfactant. Moreover, the Fe2O3@NiO heterojunction acts as a highly active electrocatalyst for OER, HER and overall water splitting. Surprisingly, compared with the pure phase Fe2O3 and NiO, the oxygen vacancy-enriched Fe2O3@NiO catalyst exhibits prominent electrocatalytic activity and durability in 1.0 M KOH. The overpotential values at 10 and 50 mA cm−2 for the OER process are 224, 264 mV, respectively, and the Tafel slope is only 20.0 mV dec−1. Meanwhile, during the HER process, the corresponding overpotentials are 187 and 280 mV, respectively, and the Tafel slope is 53.8 mV dec−1. Moreover, in the alkaline double electrode system, the total water-splitting reaction of the Fe2O3@NiO heterojunction requires only 1.63 V cell voltage at 10 mA cm−2.
2. Experimental section
Materials
Polyvinylidene fluoride (PVDF) powder and acetylene black were purchased from Zhenkai Lai Zhuote Technology Co., Ltd. HCl (∼37%) and ethanol were purchased from the Sinopharm Group. Fe(NO3)3·9H2O and (NO3)2·6H2O were obtained from Xilong Science Co., Ltd. N,N-dimethylformamide (NMP), urea and KOH pellets were obtained from Maclean Ltd.Synthesis of Fe2O3@NiO
Fe2O3@NiO was synthesized by dissolving 1 mmol Fe(NO3)3·9H2O, 1 mmol Ni(NO3)2·6H2O and 10 mmol urea in 20 ml deionized water under vigorous stirring. After fully dissolving the solids under ultrasonication, the homogeneous mixture was completely poured into an autoclave with a PTFE liner (40 ml) and maintained at 120 °C for 6 h. After the reaction was completed, the obtained products were cleaned with pure water and absolute ethanol and centrifuged 3 times. Then, the product was dried at 55 °C for 10 h. Finally, the Fe2O3@NiO catalyst was obtained by calcining the above product at 400 °C for 2 h, and the heating rate was 2 °C min−1.Synthesis of NiO and Fe2O3
The preparation method of pure NiO and Fe2O3 is similar to that of Fe2O3@NiO. In a typical experiment, 1 mmol Ni(NO3)2·6H2O or Fe(NO3)3·9H2O was added to the mixed solution containing 20 ml deionized water and 10 mmol urea. The homogeneous solution after the ultrasonic dissolution treatment was transferred in an autoclave to react at 120 °C for 6 h. After the reaction, the resulting solid product was washed and centrifuged with pure water and absolute ethanol several times, afterwards dried at 55 °C. Ultimately, the dried powder was annealed at 400 °C for 2 h to gain NiO and Fe2O3 respectively.Fabrication of the working electrode
Firstly, 14 mg Fe2O3@NiO catalyst, 4 mg acetylene black (as conductive agent) and 2 mg PVDF powder were ground into a fine powder in an agate mortar. Then, 120 μL of NMP was appended to the powder to transform a uniform ink. The ink was coated on the NF with a size of 1 cm2 to form a homogeneous electrode layer (mass loading: 2.8 mg cm−2). After natural drying, the working electrode was prepared and its electrochemical performance was tested.Characterizations
The samples were characterized using X-ray powder diffraction (XRD, D8 advanced diffraction system) in the 2θ angle range of 10° to 80°. A field emission scanning electron microscope (Hitachi 8100) was used to obtain SEM images. High-resolution transmission electron microscopy (HRTEM, Fei Tecnai G2 F30) and transmission electron microscopy (TEM, Hitachi HT-7700) were used to characterize the lattice fringes and morphology of the samples. The specific surface area of Brunauer Emmett Teller (BET) and the pore size of BJH were measured using micromeritics ASAP 2460. EDX (Hitachi 8100) and XPS (XPS, ESCALAB 250Xi) spectra were used to determine the state and distribution of elements, respectively.Electrochemical measurements
The electrocatalytic tests were carried out in 1.0 M KOH electrolyte at room temperature using the CHI660e electrochemical working instrument of Shanghai Chenhua Instrument Company. The Pt sheet (or graphite) and the Ag/AgCl (saturated KCl) electrodes were used as the counter and reference electrodes, respectively. The catalyst-supported NF served as the working electrode, and a three-electrode system was used for testing. Before the test, the electrolytic cell was purged with high-purity argon or oxygen for half an hour. During the tests, the scan rate of cyclic voltammetry (CV) was 50 mV s−1. The polarization curve after iR compensation was obtained using linear sweep voltammetry (LSV), and the scan rate was 5 mV s−1. During the electrochemical tests, the obtained potential based on the formula (Evs RHE = Evs Ag/AgCl + 0.059 pH + 0.197) was calibrated by a reversible hydrogen electrode (RHE). The Tafel slope of the Fe2O3@NiO catalyst was obtained from the compensated LSV polarization curve. The relationship between the current density and time was measured under the same conditions. Electrochemical impedance spectroscopy (EIS) was obtained by applying open-circuit voltage under the frequency range of 10−1 Hz to 105 Hz. The electrochemical surface area (ECSA) was assessed from the CV plots of the non-Faraday interval at different scanning rates.Electrochemical H2 and O2 evolutions were measured in a homemade electrochemical device using a CHI660E electrochemical workstation. A two-electrode device was assembled using Fe2O3@NiO as the anode and cathode. The actual volumes of O2 and H2 produced in the whole water splitting process were compared with the theoretically calculated gas volume, and the Faraday efficiency was calculated.
3. Results and discussion
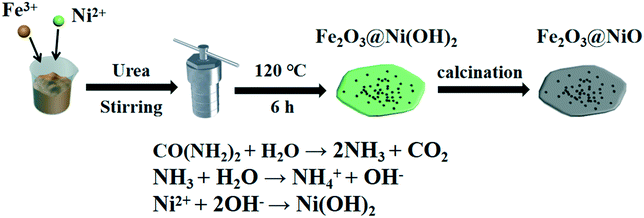
The Fe2O3@NiO heterojunction materials composed of Fe2O3 nanoparticles and NiO nanosheets were obtained by hydrothermal synthesis and annealing process. As illustrated in Fig. 1, Fe2O3@Ni(OH)2 electrocatalysts were firstly synthesised by a hydrothermal method. In this process, under the action of urea, Ni(OH)2 was generated through the reaction as shown in the equation at the bottom of Fig. 1.39 Subsequently, Fe2O3@Ni(OH)2 precursor was transformed into the Fe2O3@NiO heterojunction by the annealing process. During the heating process, the oxygen vacancy-enriched Fe2O3 was formed due to ion intermixing. The morphology of the Fe2O3@NiO heterojunction at different magnifications is shown in Fig. 2a. As depicted in this SEM micrograph, high-density Fe2O3 nanoparticles were modified on the surface of NiO nanoflakes after calcination. From the TEM image of Fe2O3@NiO heterojunction composites (Fig. 2b), we can also see that many Fe2O3 nanoparticles with 50–80 nm are anchored on the NiO nanosheets.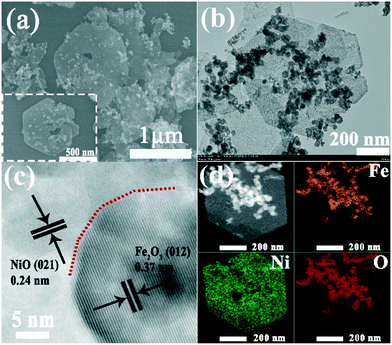 | ||
| Fig. 2 (a) SEM images of the Fe2O3@NiO heterojunction. (b) TEM image. (c) HRTEM image. (d) STEM and corresponding elemental mapping of Fe, Ni and O for the Fe2O3@NiO heterojunction. | ||
In addition, pure Fe2O3 and NiO were also synthesized, respectively. Fig. S1 and S2† display the TEM and SEM charts of single-phase Fe2O3 and NiO, respectively. In order to further study the formation of Fe2O3@NiO heterojunction, HRTEM was used to characterize the lattice fringes of the heterojunction. As seen from Fig. 2c, the two sets of lattice fringes with the spacing of 0.24 and 0.37 nm can be indexed to the (021) and (012) lattice planes of Fe2O3@NiO, respectively. Moreover, it can be clearly seen from the EDX elemental mapping (Fig. 2d), the as-prepared heterojunction is made up of O, Ni and Fe elements, without other impurities, and the atomic ratio of Fe/Ni is about 2![[thin space (1/6-em)]](https://www.rsc.org/images/entities/char_2009.gif) :
:![[thin space (1/6-em)]](https://www.rsc.org/images/entities/char_2009.gif) 1 (see the ESI,† Fig. S4 and Table S1). The formation of Fe2O3@NiO heterogeneous composites was further confirmed by the XRD and XPS results. Furthermore, the heterogeneous interface between Fe2O3 and NiO is beneficial to improve the charge/electron transfer rate and expose more active sites, thus significantly improving the electrocatalytic activity of the materials.
1 (see the ESI,† Fig. S4 and Table S1). The formation of Fe2O3@NiO heterogeneous composites was further confirmed by the XRD and XPS results. Furthermore, the heterogeneous interface between Fe2O3 and NiO is beneficial to improve the charge/electron transfer rate and expose more active sites, thus significantly improving the electrocatalytic activity of the materials.
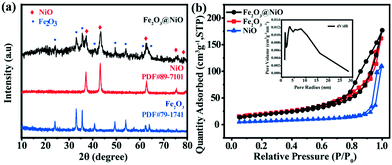
The XRD diffraction pattern of the Fe2O3@NiO heterojunction is depicted in Fig. 3a. The characteristic peaks (012), (104), (110), (113), (024), (116), (214) and (300) of Fe2O3 (JCPDF 79-1741) can be observed at about 2θ of 24.15°, 33.17°, 35.64°, 40.87°, 49.47°, 54.08°, 62.45° and 64.02°, respectively. Meanwhile, the XRD peaks at 37.25°, 43.30°, 62.85°, 75.42° and 79.39° are assigned to (021), (202), (220), (223) and (042), respectively, of NiO (JCPDF 89-7101). It is obvious that the XRD characteristic peaks of Fe2O3@NiO entirely correspond to the pure phase Fe2O3 and NiO. Moreover, the pore size and specific surface area of the Fe2O3@NiO heterojunction were obtained from N2 adsorption/desorption data. It can be seen from Fig. 3b that the prepared Fe2O3@NiO sample has obvious hysteresis isothermal loop. The results show that the Fe2O3@NiO heterojunction has a macropore volume of 0.30 cm3 g−1. In addition, the Fe2O3@NiO heterojunction has a larger specific surface area than those of pure Fe2O3 and NiO, and about 72.29 m2 g−1. The high specific surface area can significantly expose more edge defects, promote the formation of active sites and enhance the electrical conductivity, which leads to a remarkable electrocatalytic performance.
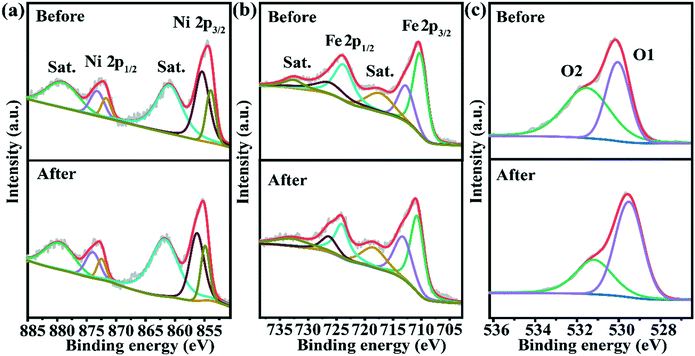
XPS was used for characterizing the surface elemental composition and valence of the material. The whole XPS spectra of Fe2O3@NiO before and after the test showed that O, Fe and Ni elements were present and the element states did not change significantly (Fig. S5†). In Fig. 4a, the two convolution peaks at 872.5 and 854.9 eV match with Ni 2p1/2 and Ni 2p3/2, respectively. Therefore, the spin–orbit splitting energy between these two peaks was calculated to be 17.6 eV, indicating the existence of Ni2+. The two peaks centered at 873.5 and 855.9 eV are ascribed to Ni3+, while the centers of the fitting peaks at 872.0 and 854.4 eV are attributed to the binding energy of Ni2+.40,41 Meanwhile, two satellite vibration peaks (marked as “Sat.”) with smaller intensity can be observed at 879.6 and 861.3 eV.42 From the XPS diagram of Fe 2p for Fe2O3@NiO in Fig. 4b, it can be seen that there are two different peaks at 724.0 and 710.5 eV, which are typical characteristic peaks of Fe3+ in 2p1/2 and 2p3/2 orbitals, respectively. In addition, the two deconvoluted peaks at 726.9 and 710.4 eV correspond to Fe2+, which is due to the presence of oxygen vacancies caused by the reduction of a part of Fe3+ to Fe2+. The existence of oxygen vacancies gives the system a certain reducibility. Meanwhile, the two deconvoluted peaks at 732.8 and 717.7 eV are ascribed to the presence of their satellite vibration peaks (marked as “Sat.”).43–45 Comparing XPS spectra of samples before and after the test, the surface elemental composition and element valence of Fe and Ni metals did not change, which further proves the chemical stability of the materials during the catalytic process. As depicted in Fig. 4c, the XPS spectra of O1s can be well deconvolved into two oxygen peaks (labeled O1 and O2), which are related to the metal–oxygen bond and oxygen vacancy, respectively. The typical metal–oxygen bond corresponds to the O1 peak at 529.6 eV, while the oxygen vacancy peak corresponding to O2 is 531.2 eV.27,46 However, as shown in Fig. 4c, the binding energy peaks corresponding to O 1 s orbital move towards the lower binding energy regions after the test, which may be due to the slight change of Fe2+/Fe3+ ratio. The XPS results indicate the co-presence of Fe2+ and Fe3+. It is important that the formed redox couple of Fe2+/Fe3+ can accelerate the charge transfer in Fe2O3 with rich oxygen vacancies because Fe3+ is reduced to Fe2+. The coupling between Fe2+ and Fe3+ ions of different valences has a great influence on oxygen vacancies. Furthermore, molar ratios of Fe2+/Fe3+ before and after the test (Table S3†) were 59.3% and 44.5%, respectively; oxygen vacancies would be changed to maintain the electrostatic balance, and the density of the oxygen vacancy would decrease after the test. Hence, according to the XPS spectra, the slight change of Fe2+/Fe3+ ratio indicates rearrangement in the valence states, which could also cause a shift in the binding energy of M–O. Moreover, part of the electrons of iron will be transferred from the symmetric electronic structure to the asymmetric three-dimensional electronic structure containing the oxygen vacancies.9,47,48 Therefore, oxygen vacancies will optimize the partial density of states of three-dimensional electrons in Fe2O3@NiO, and promote the reaction sites to improve the electrocatalytic activity. To further probe the possible existence of oxygen vacancies in the material, we recorded the electron paramagnetic resonance (EPR) spectrum (see Fig. S6†). According to the study of Jitianu et al., two main EPR signals (g = 2.0 and g = 4.3) can be attributed to two different Fe3+ sites.49 The EPR signal (g = 2.006) can be ascribed to oxygen vacancies.50 However, as shown in Fig. S6,† the as-prepared Fe2O3@NiO nanostructures show a broad and symmetric signal at g ∼ 2. This is due to Fe(III) ions in the spin pair of Fe3+–O2−–Fe3+ can give a broad and symmetric signal at g ∼ 2, and oxygen vacancies also appear a signal at g ~ 2.51,52 The coexistence of Fe3+ and oxygen vacancies results in a broad and symmetric EPR signal at g ∼ 2. In addition, the generation of oxygen vacancies can also improve the strong adsorption behavior of H2O. Based on the above discussion and analysis, as-prepared Fe2O3@NiO possesses abundant heterojunction interfaces, a large proportion of Fe2+/Fe3+ and rich O vacancies, which accelerate the charge/electron transfer rate and bring about a better electrical conductivity, thus improving the electrocatalytic performance of OER and HER and realizing the overall water splitting.
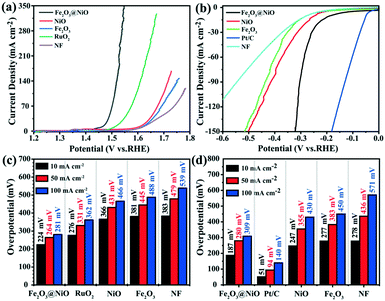
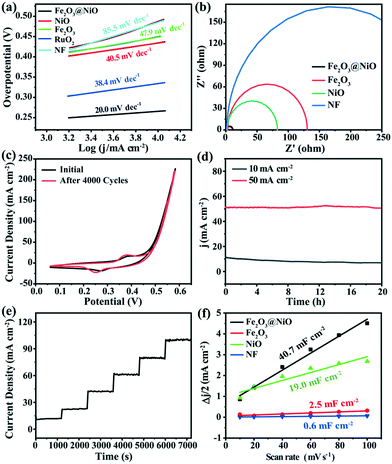
The electrocatalytic activity of the Fe2O3@NiO heterojunction in 1.0 M KOH was measured by LSV. In contrast, the electrocatalytic activities of NiO, Fe2O3 and commercial RuO2 under the same environment were also discussed. Before the electrochemical tests, the working electrode was scanned using cyclic voltammetry to obtain a relatively stable state. The compensated LSV curves of Fe2O3@NiO heterojunction and other electrodes are shown in Fig. 5a. When the current density is 10 mA cm−2, the overpotential of the Fe2O3@NiO heterojunction was 224 mV, which is much smaller than the overpotential of NiO (315 mV) and Fe2O3 (319 mV). In addition, the catalytic activity of Fe2O3@NiO is better than that of commercial RuO2, NF and published non-noble metal OER catalysts (Table S2†). Fig. 5c shows the overpotential comparison between this catalyst and other controls at different current densities. The results indicate that the Fe2O3@NiO heterojunction shows the lowest overpotential at the above current density. Furthermore, the Tafel slope is an important kinetic parameter for further study on electrochemical kinetic processes, and the lower Tafel slope indicates faster electrocatalytic kinetics. In Fig. 6a, the Tafel value was calculated from the measured polarization curve. We can see that the Tafel slope of Fe2O3@NiO heterojunction was obviously less than that of the other control groups, which indicates that the Fe2O3@NiO electrode is more conducive to the OER kinetic process. Besides, the charge transport characteristics of the Fe2O3@NiO heterojunction was researched using EIS. As shown in Fig. 6b, the EIS half-circle arc radius of Fe2O3@NiO is the shortest, indicating that the Fe2O3@NiO heterojunction has the fastest charge transfer dynamics during the electrochemical process. Moreover, the stability of the catalyst was further explored. The performance of the Fe2O3@NiO catalyst before and after the 4000 CV cycle is compared in Fig. 6c. It can be seen that the OER polarization curve of Fe2O3@NiO has almost no reduction after 4000 cycles in alkaline electrolytes. Simultaneously, the long-term OER persistence of Fe2O3@NiO heterojunction at 50 and 10 mA cm−2 was studied by potentiostatic chronoamperometry. As shown in Fig. 6d, the prepared catalyst still has good OER activity after 20 hours of continuous testing and exhibits excellent stability. Moreover, the multi-step chronocurrent curves of Fe2O3@NiO were recorded with the current density successively increasing from 10 to 100 mA cm−2 at regular intervals of 1200 s (Fig. 6e). At the beginning of 1.455 V, it stabilizes at 10 mA cm−2 and stays unchanged for 1200 s. The current density gradually increases and similar results are also obtained. Fig. 6e shows that the obtained Fe2O3@NiO exhibits fast and stable responses at different current densities. In summary, these results indicate that the Fe2O3@NiO catalyst displays good OER stability and activity in the continuous electrochemical process.
In order to deeply explore the mechanism and kinetics of the electrocatalytic reaction, ESCA of the catalysts was also discussed. Generally, the increase of ECSA provides more active sites and promotes the improvement of electrocatalytic activity. The ECSA value can be estimated using the electrochemical double-layer capacitance (Cdl) obtained by cyclic voltammetry (CV). The Cdl value can be calculated using the formula: Jc = vCdl.53,54Jc and v are the current density and scanning rate, respectively. In addition, the Cdl values can be calculated by the slope of the plot Δj vs. the scan rate and dividing by two. The ECSA value can be obtained from the Cdl value according to the following formula: ECSA = Cdl/Cs, where Cs represents the specific capacitance, and the Cs value is 0.04 mF cm−2.55 As shown in Fig. S7,† the cyclic voltammetry was measured at different scanning rates in the input potential range of 0–0.1 V. It can be discovered from Fig. 6f that the Fe2O3@NiO heterojunction shows the highest Cdl value (40.7 mF cm−2) compared with NF (0.6 mF cm−2), Fe2O3 (2.5 mF cm−2) and NiO (19.0 mF cm−2). This indicates that the Fe2O3@NiO heterojunction with a high electrochemical surface area can supply more active centers for OER. In addition, it can be seen in Fig. S3† that the morphology before and after the performance test was not changed significantly.
These results indicate that the Fe2O3@NiO catalyst exhibits a faster charge transfer rate and a faster kinetic process in the OER process, compared with pure Fe2O3 and NiO catalysts. Besides, the Fe2O3@NiO catalyst also has good mechanical stability and corrosion resistance.
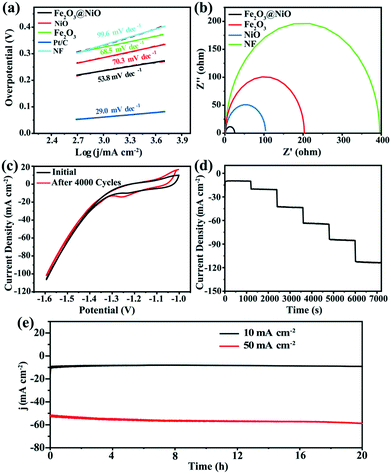
While studying the OER activity, we also studied the HER activity of Fe2O3@NiO in 1.0 M KOH. Similarly, the properties of Fe2O3, NiO and NF were compared under the same conditions. Fig. 5b displays the HER polarization curve of various samples. It can be seen that when the current density is −10 mA cm−2, the corresponding overpotential of the Fe2O3@NiO catalyst reaches 187 mV, which is evidently smaller than the value of NiO (247 mV), Fe2O3 (277 mV) and NF (278 mV) catalysts. Fig. 5d compares the overpotential of Fe2O3@NiO with other control groups at different current densities. Moreover, Table S2† depicts the comparison of the overpotential of the prepared Fe2O3@NiO with the most reported non-noble metal electrocatalysts in the alkaline electrolyte at −10 mA cm−2. Remarkably, the HER catalytic activity of Fe2O3@NiO is superior to that of most reported non-precious metal-based electrocatalysts. Similarly, the Tafel value is calculated from the LSV curve for HER (Fig. 7a). The Tafel value of the Fe2O3@NiO catalyst is obviously less than 68.5 mV dec−1 of Fe2O3, 99.6 mV dec−1 of NF and 70.3 mV dec−1 of NiO. Compared with other controls, the overpotential (187 mV) and Tafel value (53.8 mV dec−1) of Fe2O3@NiO at −10 mA cm −2 both show the smallest values. This result shows that the material still has good electrocatalytic performance in the HER process.
In addition, to study the charge transferability of the materials in the electrocatalytic process, the EIS test was also performed. In Fig. 7b, the diameter of the fitted impedance semicircle for Fe2O3@NiO is markedly smaller than those of Fe2O3, NiO and NF, which indicate that the Fe2O3@NiO exhibits the smallest charge transfer resistance (Rct) and excellent conductivity for HER. Furthermore, we also investigated the stability of the catalyst for HER. Fig. 7c shows the comparison of CV curves of the Fe2O3@NiO electrode at the beginning and after 4000 cycles, which expresses that the deviation of the CV curve is small. Meanwhile, the multi-step chronopotentiometry curves for Fe2O3@NiO material were also obtained (Fig. 7d). The steady voltage–current response of Fe2O3@NiO reveals that it also possesses excellent mass transport properties for HER. Moreover, the chronoamperometric curves of the continuous test for 20 h were recorded under −10 and −50 mA cm −2, respectively. Surprisingly, the current density still remains above 97% after 20 h of continuous testing (Fig. 7e). As shown in Fig. S3,† there is no obvious change in the form and structure of the material before and after the performance test. In conclusion, Fe2O3@NiO showed excellent catalytic performance and persistence in the HER process.
The excellent HER and OER activities of the Fe2O3@NiO catalyst promote the study of the overall water splitting performance as an excellent electrocatalyst. Therefore, by using the Fe2O3@NiO catalyst as both the anode and cathode, the double electrode device of Fe2O3@NiO||Fe2O3@NiO was constructed, by which the electrocatalytic water decomposition process was studied in 1.0 M KOH solution. Fig. 8a displays the LSV curves measured with a scanning speed of 5 mV s−1. The constructed Fe2O3@NiO||Fe2O3@NiO device requires 1.63 V at 10 mA cm−2. Undoubtedly, Fe2O3@NiO shows better water splitting performance than that Fe2O3, NiO and NF. In addition, the device was subjected to a long-term continuous electrocatalysis experiment at 10 mA cm−2. In contrast, the prepared Fe2O3@NiO||Fe2O3@NiO device had undergone a 20 h long-term measurement, and the density of the current remains unchanged, which reflects the excellent stability of the material in the overall water splitting (Fig. 8b). Additionally, the Faraday efficiency of the hydrolysis process was calculated by measuring the actual volume of O2 and H2 produced in the anode and cathode catalysts in an H-type electrolyzer. Fig. 8c shows the amount of gas produced during electrolysis at high current density. It can be seen that the ratio of O2 to H2 is almost 1![[thin space (1/6-em)]](https://www.rsc.org/images/entities/char_2009.gif) :
:![[thin space (1/6-em)]](https://www.rsc.org/images/entities/char_2009.gif) 2. This is basically consistent with the theoretical calculation results, indicating that the Faraday efficiency of the whole water splitting process is close to 100%.
2. This is basically consistent with the theoretical calculation results, indicating that the Faraday efficiency of the whole water splitting process is close to 100%.
Based on the above description and discussion, the Fe2O3@NiO heterojunction catalyst with oxygen vacancies exhibits excellent OER, HER and overall water decomposition performance, which may be due to these factors: (i) the synergism of Fe2O3@NiO heterostructure can effectively improve the electrochemical performance by reducing the energy barrier of water decomposition process; (ii) the existence of oxygen vacancies optimizes the surface properties and electronic structure and the formed Fe2+/Fe3+ redox pair can promote charge transferability, thereby enhancing the catalytic performance; (iii) nanostructures constructed by Fe2O3 nanoparticles attached to NiO nanosheets form a great number of active centers and modulate electronic interaction with a faster speed, which can greatly enhance the electrochemical performance.
4. Conclusions
In short, the efficient and stable Fe2O3@NiO heterojunction electrocatalyst was prepared by a simple hydrothermal synthesis and calcination method. The heterojunction formed by direct integration of Fe2O3 on NiO nanosheets significantly reduces the water splitting barrier, optimizes the adsorption/desorption of intermediates, enhances active surface and efficient mass transport. In addition, the rich oxygen vacancies optimize the electronic structure of the composite material and improve the efficiency of charge separation and transfer, thereby promoting the catalytic efficiency of HER and OER. The overpotential values corresponding to OER and HER are 224 and 187 mV at 10 mA cm−2, respectively. The water electrolysis cell of the two-electrode system assembled with Fe2O3@NiO only needs 1.63 V cell voltage to reach 10 mA cm−2 for overall water decomposition and has excellent stability. Consequently, this work may provide a convenient and useful means for the development of non-noble metal water splitting electrocatalysts with high activity, durability, and low cost.Author contributions
Yan Sang: supervision. Xi Cao: conceptualization, methodology, writing – original draft. Gaofei Ding: visualization, investigation. Zixuan Guo: software, validation, data curation. Yingying Xue: formal analysis, investigation. Guohong Li: methodology, investigation, validation, writing – review & editing. Runhan Yu: project administration, funding acquisition.Conflicts of interest
There are no conflicts to declare.Acknowledgements
This work was supported by the Natural Science Foundation of Anhui Provincial Education Department (KJ2020ZD05) and National College Students Innovation and Entrepreneurship Training Program (202010370160).References
- W. Ahn, M. G. Park, D. U. Lee, M. H. Seo, G. Jiang, Z. P. Cano, F. M. Hassan and Z. Chen, Adv. Funct. Mater., 2018, 28, 1802129 CrossRef.
- S. Anantharaj and S. Noda, Small, 2020, 16, 1905779 CrossRef CAS.
- Y. Chen, C. Dong, J. Zhang, C. Zhang and Z. Zhang, J. Mater. Chem. A, 2018, 6, 8430–8440 RSC.
- K. Kannimuthu, K. Sangeetha, S. S. Sankar, A. Karmakar, R. Madhu and S. Kundu, Inorg. Chem. Front., 2021, 8, 234–272 RSC.
- K. N. Dinh, P. Zheng, Z. Dai, Y. Zhang, R. Dangol, Y. Zheng, B. Li, Y. Zong and Q. Yan, Small, 2018, 14, 1703257 CrossRef PubMed.
- L. L. Feng, G. Yu, Y. Wu, G. D. Li, H. Li, Y. Sun, T. Asefa, W. Chen and X. Zou, J. Am. Chem. Soc., 2015, 137, 14023–14026 CrossRef CAS.
- J. Staszak-Jirkovsky, C. D. Malliakas, P. P. Lopes, N. Danilovic, S. S. Kota, K. C. Chang, B. Genorio, D. Strmcnik, V. R. Stamenkovic, M. G. M. G. Kanatzidis and N. M. Markovic, Nat. Mater., 2016, 15, 197–203 CrossRef CAS.
- J. Ping, Y. Wang, Q. Lu, B. Chen, J. Chen, Y. Huang, Q. Ma, C. Tan, J. Yang, X. Cao, Z. Wang, J. Wu, Y. Ying and H. Zhang, Adv. Mater., 2016, 28, 7640–7645 CrossRef CAS.
- R. Liu, Y. Wang, D. Liu, Y. Zou and S. Wang, Adv. Mater., 2017, 29, 1701546 CrossRef PubMed.
- K. Hu, M. Wu, S. Hinokuma, T. Ohto, M. Wakisaka, J. Fujita and Y. Ito, J. Mater. Chem. A, 2019, 7, 2156–2164 RSC.
- Y. Hu, H. Yang, J. Chen, T. Xiong, M. S. Balogun and Y. Tong, ACS Appl. Mater. Interfaces, 2019, 11, 5152–5158 CrossRef CAS.
- Y. Pei, Y. Ge, H. Chu, W. Smith, P. Dong, P. M. Ajayanc, M. Ye and J. Shen, Appl. Catal., B, 2019, 244, 583–593 CrossRef CAS.
- Z. Qiu, Y. Ma and T. Edvinsson, Nano Energy, 2019, 66, 104118 CrossRef CAS.
- Y. Wu, Y. Liu, G. D. Li, X. Zou, X. Lian, D. Wang, L. Sun, T. Asefa and X. Zou, Nano Energy, 2017, 35, 161–170 CrossRef CAS.
- Z. Yang, Y. Lin, F. Jiao, J. Li, W. Wang, Y. Gong and X. Jing, Appl. Surf. Sci., 2020, 502, 144147 CrossRef CAS.
- H. Liu, X.-H. Zhang, Y.-X. Li, X. Li, C.-K. Dong, D.-Y. Wu, C.-C. Tang, S.-L. Chou, F. Fang and X.-W. Du, Adv. Energy Mater., 2020, 10, 1902521 CrossRef CAS.
- Y. Ding, B.-Q. Miao, S.-N. Li, Y. C. Jiang, Y.-Y. Liu, H.-C. Yao and Y. Chen, Appl. Catal., B, 2020, 268, 118393 CrossRef CAS.
- L. Cao, Y. Hu, S. Tang, A. Iljin, J. Wang, Z. Zhang and T. Lu, Adv. Sci., 2018, 5, 1800949 CrossRef PubMed.
- J. Yang, J. Zheng, M. Xu, Z. Zhuo, W. Yang, L.-W. Wang, L. Dai, J. Lu, K. Amine and F. Pan, ACS Catal., 2018, 8, 466–473 CrossRef CAS.
- X. Gao, H. Zhang, Q. Li, X. Yu, Z. Hong, X. Zhang, C. Liang and Z. Lin, Angew. Chem., Int. Ed., 2016, 55, 6290–6294 CrossRef CAS PubMed.
- Y. Gong, Y. Lin, Z. Yang, F. Jiao, J. Li and W. Wang, Appl. Surf. Sci., 2019, 476, 840–849 CrossRef CAS.
- A. Karmakar, K. Karthick, S. S. Sankar, S. Kumaravel, R. Madhu and S. Kundu, J. Mater. Chem. A, 2021, 9, 1314–1352 RSC.
- H. Xu, J. Wei, K. Zhang, M. Zhang, C. Liu, J. Guo and Y. Du, J. Mater. Chem. A, 2018, 6, 22697–22704 RSC.
- S. Jin, ACS Energy Lett., 2017, 2, 1937–1938 CrossRef CAS.
- J. Chen, F. Wang, X. Qi, H. Yang, B. Peng, L. Xu, Z. Xiao, X. Hou and T. Liang, Electrochim. Acta, 2019, 326, 134979 CrossRef CAS.
- H. Xu, J. Wei, M. Zhang, C. Liu, Y. Shiraishi, C. Wang and Y. Du, Nanoscale, 2018, 10, 18468–18472 RSC.
- S. Sultana, S. Mansingh and K. M. Parida, J. Mater. Chem. A, 2018, 6, 11377–11389 RSC.
- L. Zhuang, Y. Jia, H. Liu, Z. Li, M. Li, L. Zhang, X. Wang, D. Yang, Z. Zhu and X. Yao, Angew. Chem., Int. Ed., 2020, 59, 14664–14670 CrossRef CAS.
- Y. Zhang, J. Fu, H. Zhao, R. Jiang, F. Tian and R. Zhang, Appl. Catal., B, 2019, 257, 117899 CrossRef CAS.
- A. Karmakar, K. Karthick, S. S. Sankar, S. Kumaravel, M. Ragunath and S. Kundu, J. Mater. Chem. A, 2021, 9, 11691–11704 RSC.
- W. H. Lee, M. H. Han, U. Lee, K. H. Chae, H. Kim, Y. J. Hwang, B. K. Min, C. H. Choi and H.-S. Oh, ACS Sustainable Chem. Eng., 2020, 8, 14071–14081 CrossRef CAS.
- M. Liang, T. Borjigin, Y. Zhang, B. Liu, H. Liu and H. Guo, Appl. Catal., B, 2019, 243, 566–575 CrossRef CAS.
- J. Su, L. Guo, N. Bao and C. A. Grimes, Nano Lett., 2011, 11, 1928–1933 CrossRef CAS.
- J. Su, G.-D. Li, X.-H. Li and J.-S. Chen, Adv. Sci., 2019, 6, 1801702 CrossRef.
- L. Tao, M. Li, S. Wu, Q. Wang, X. Xiao, Q. Li, M. Wang, Y. Fu and Y. Shen, Catal. Sci. Technol., 2018, 8, 4151–4158 RSC.
- B. H. R. Suryanto, Y. Wang, R. K. Hocking, W. Adamson and C. Zhao, Nat. Commun., 2019, 10, 5599 CrossRef CAS.
- A. K. Singh and D. Sarkar, Nanoscale, 2018, 10, 13130–13139 RSC.
- F. Li, J. Li, J. Zhang, L. Gao, X. Long, Y. Hu, S. Li, J. Jin and J. Ma, ChemSusChem, 2018, 11, 2156–2164 CrossRef CAS.
- E. Hosono, S. Fujihara, I. Honma and H. Zhou, Adv. Mater., 2005, 17, 2091–2094 CrossRef CAS.
- S. Hao, L. Chen, C. Yu, B. Yang, Z. Li, Y. Hou, L. Lei and X. Zhang, ACS Energy Lett., 2019, 4, 952–959 CrossRef CAS.
- F. Wu, Q. Liao, F. Cao, L. Li and Y. Zhang, Nano Energy, 2017, 34, 8–14 CrossRef CAS.
- X. Cao, Y. Sang, L. Wang, G. Ding, R. Yu and B. Geng, Nanoscale, 2020, 12, 19404–19412 RSC.
- A. K. Singh and D. Sarkar, Nanoscale, 2018, 10, 13130–13139 RSC.
- L. Zhang, Q. Fang, Y. Huang, K. Xu, P. K. Chu and F. Ma, Anal. Chem., 2018, 90, 9821–9829 CrossRef CAS PubMed.
- G. Shen, R. Zhang, L. Pan, F. Hou, Y. Zhao, Z. Shen, W. Mi, C. Shi, Q. Wang, X. Zhang and J.-J. Zou, Angew. Chem., Int. Ed., 2020, 59, 2313–2317 CrossRef CAS.
- Y. Ma, Z. Lu, S. Li, J. Wu, J. Wang, Y. Du, J. Sun and P. Xu, ACS Appl. Mater. Interfaces, 2020, 12, 12668–12676 CrossRef CAS.
- Y. Ding, J. Zhao, W. Zhang, J. Zhang, X. Chen, F. Yang and X. Zhang, ACS Appl. Energy Mater., 2019, 2, 1026–1032 CrossRef CAS.
- T. Odedairo, X. Yan, X. Yao, K. K. Ostrikov and Z. Zhu, Adv. Mater., 2017, 29, 1703792 CrossRef.
- P. F. Liu, S. Yang, B. Zhang and H. G. Yang, ACS Appl. Mater. Interfaces, 2016, 8, 34474–34481 CrossRef CAS PubMed.
- J. Dong, Y. Wang, Q. Jiang, Z. Nan, F. R. Fan and Z. Tian, J. Mater. Chem. A, 2021, 9, 20058–20067 RSC.
- A. Jitianu, M. Crisan, A. Meghea, I. Rau and M. Zaharescu, J. Mater. Chem., 2002, 12, 1401–1407 RSC.
- G. Alvarez, R. Font, J. Portelles, O. Raymond and R. Zamorano, Solid State Sci., 2009, 11, 881–884 CrossRef CAS.
- D. Friebel, M. W. Louie, M. Bajdich, K. E. Sanwald, Y. Cai, A. M. Wise, M.-J. Cheng, D. Sokaras and T.-C. Weng, J. Am. Chem. Soc., 2015, 137, 1305–1313 CrossRef CAS PubMed.
- Y. Gong, Z. Yang, Y. Lin, J. Wang, H. Pan and Z. Xu, J. Mater. Chem. A, 2018, 6, 16950–16958 RSC.
- L. An, J. Feng, Y. Zhang, R. Wang, H. Liu, G.-C. Wang, F. Cheng and P. Xi, Adv. Funct. Mater., 2019, 29, 1805298 CrossRef.
Footnote |
| † Electronic supplementary information (ESI) available. See DOI: 10.1039/d1ce01309b |
| This journal is © The Royal Society of Chemistry 2022 |

