 Open Access Article
Creative Commons Attribution 3.0 Unported Licence
Real-time observation of photoionization-induced water migration dynamics in 4-methylformanilide–water by picosecond time-resolved infrared spectroscopy and ab initio molecular dynamics simulations†
Mitsuhiko
Miyazaki
 *ab,
Tairiku
Kamiya
b,
Matthias
Wohlgemuth
 c,
Kuntal
Chatterjee
 d,
Roland
Mitrić
 *c,
Otto
Dopfer
 *de and
Masaaki
Fujii
 *be
*be
aNatural Science Division, Faculty of Core Research, Ochanomizu University, 2-1-1 Ohtsuka, Bunkyo-ku, Tokyo 112-8610, Japan. E-mail: miyazaki.mitsuhiko@ocha.ac.jp
bLaboratory for Chemistry and Life Science, Institute of Innovative Research, Tokyo Institute of Technology, Yokohama 226-8503, Japan
cInstitut für Physikalische und Theoretische Chemie, Julius-Maximilians-Universität Würzburg, 97074 Würzburg, Germany. E-mail: roland.mitric@uni-wuerzburg.de
dInstitut für Optik und Atomare Physik, Technische Universität Berlin, 10623 Berlin, Germany. E-mail: dopfer@physik.tu-berlin.de
eWorld Research Hub Initiatives, Institute of Innovative Research, Tokyo Institute of Technology, 4259-R1-15, Nagatsuta-cho, Midori-ku, Yokohama 226-8503, Japan. E-mail: mfujii@res.titech.ac.jp
First published on 1st October 2021
Abstract
A novel time-resolved pump–probe spectroscopic approach that enables to keep high resolution in both the time and energy domain, nanosecond excitation–picosecond ionization–picosecond infrared probe (ns–ps–ps TRIR) spectroscopy, has been applied to the trans-4-methylformanilide–water (4MetFA–W) cluster. Water migration dynamics from the CO to the NH binding site in a peptide linkage triggered by photoionization of 4MetFA–W is directly monitored by the ps time evolution of IR spectra, and the presence of an intermediate state is revealed. The time evolution is analyzed by rate equations based on a four-state model of the migration dynamics. Time constants for the initial to the intermediate and hot product and to the final product are obtained. The acceleration of the dynamics by methyl substitution and the strong contribution of intracluster vibrational energy redistribution in the termination of the solvation dynamics is suggested. This picture is well confirmed by the ab initio on-the-fly molecular dynamics simulations. Vibrational assignments of 4MetFA and 4MetFA–W in the neutral (S0 and S1) and ionic (D0) electronic states measured by ns IR dip and electron-impact IR photodissociation spectroscopy are also discussed prior to the results of time-resolved spectroscopy.
1. Introduction
Realignment of solvent molecules is an initial process of chemistry in solution, and it significantly affects the reaction rates and yields.1–3 Thus, the solvation dynamics after photoexcitation of a solute molecule has attracted strong attention, even from the early stage of ultrafast spectroscopy.4–6 For biomolecules, hydration dynamics around proteins is one of the most important dynamical processes because the biological functions of proteins take place in water, and the surfaces of proteins are usually covered by water molecules. Protein folding obviously triggers rearrangement of surrounding water molecules.7–10 Protein transport is also strongly dependent on how tightly bound the surrounding water molecules are. Due to their importance, water molecules surrounding proteins are often called “biological water”.11,12The dynamics of biological water has been interrogated by several methods such as NMR spectroscopy, neutron scattering, and dynamic Stokes shifts.13–18 However, the interpretation of these studies on dynamics of biological water in solution are often controversial,8,19 and the lifetime of initial dynamical processes of biological water spreads over the sub-nanosecond to picosecond range.13,14 This discrepancy may be due to the fact that biological water is inhomogeneous, and each of the above experimental techniques probes the dynamics of water molecules in different environments. A recent review about biological water describes this unfortunate situation by the famous poem of John Godfrey Saxe “The Blind Men and the Elephant”.19
To circumvent the problem of inhomogeneous water molecules, we have been working on hydration dynamics at a single solvent molecular level by probing solvated clusters in the gas phase using time-resolved infrared (TRIR) spectroscopy and advanced ab initio molecular dynamics (MD) simulations.20–25 This approach offers size- and isomer-selectivity as well as full control over solvation structure and energy in the cluster. Hydrated clusters generated in a molecular beam consist of solute and water molecules. The clusters are isolated at low temperature and thus the initial geometry and number of solvent molecules in the clusters are precisely defined. As a result, we can directly watch single water migration dynamics without ambiguity. The dynamics is typically initiated by UV laser excitation/photoionization of the clusters, and migration of the water molecule is monitored by changes in the TRIR spectra at the picosecond (ps) time scale. This technique of UV-UV(′)-IR ps time-resolved IR (ps-TRIR) spectroscopy combined with mass spectrometry has been successfully applied to a variety of monohydrated clusters, including the single water CO → NH migration around the peptide linkage in trans-acetanilide (tAA)20,21 and trans-formanilide (tFA),24 the CN → NH migration around 4-aminobenzonitrile,22 and the NH → OH migration in 5-hydroxyindole.25 Surprisingly, the lifetimes of these single water migrations vary over four orders of magnitude, ranging from 4 ps to 53 ns. This wide variety of the migration time-constants has been rationalized by the differences in excess energies and potential energy surfaces for both the initial and final binding sites, such as (a) repulsive → bound, (b) flat → bound, and (c) bound → bound.23,25 The slow migration lifetime in the bound → bound potential surface in 5-hydroxyindole–water is well reproduced by RRKM theory, and thus the intracluster vibrational energy redistribution (IVR) is one of the key factors to understand the variety of the hydration dynamics at the molecular level. Analysis of the fast migration regime relies mostly on MD simulations.
For example, the ab initio “on-the-fly” MD simulations reproduce the time-evolutions (TEs) obtained by the ps-TRIR spectra on monohydrated clusters of tAA and tFA (tAA–W and tFA–W), and visualize the migration trajectories of water as shown in Fig. 1.21,24 The water migration in tFA+–W(CO) (hereafter, W(CO) and W(NH) mean the water molecule bound to the CO and NH sites, respectively) triggered by photoionization of the aromatic chromophore proceeds in the molecular plane. The water molecule released from the initial CO binding site migrates toward the final NH site, but overshoots and moves like a large-amplitude damped pendulum around the NH destination site. This overshooting motion is settled down within around 10 ps by vibrational energy transfer to low-frequency intramolecular vibrations of tFA+.24 The migration dynamics in the related tAA+–W(CO) cluster has been also simulated, and the twice faster migration than in tFA+–W is well reproduced (Fig. 1).21 tAA is a methyl-substituted derivative of tFA and thus the faster migration can be rationalized by the effect of the CH3 group. The CH3 group provides low-energy vibrational levels due to its (hindered) internal rotation, which accelerates the IVR.26 Another effect of CH3 substitution is its direct interaction with the water migration because the pathway is now split into in-plane and out-of-plane paths in tAA+–W due to steric hindrance. In either case, it is clear that IVR from inter- to intramolecular vibrations controls the migration dynamics. However, it is difficult to evaluate the importance of the two effects, namely the density of states and the steric interaction.
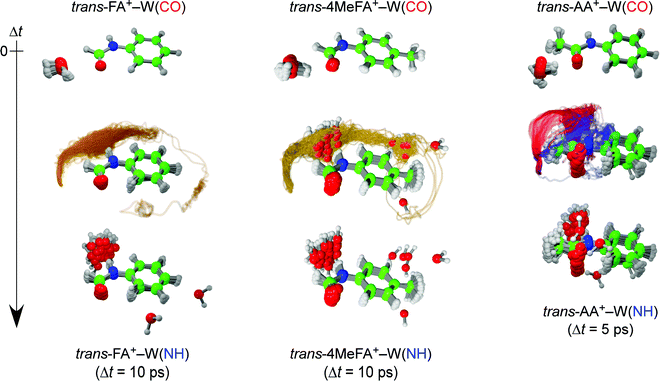 | ||
| Fig. 1 Trajectories of the ionization-induced water migration derived from the trans-FA+–W (left, 40 trajectories) and trans-AA+–W (right, 50 trajectories) MD simulations, starting from the CO-bound isomer (top row) and ending at the NH-bound isomer (bottom row) at 10 and 5 ps after ionization, respectively (see movies in ESI†). The yellow curves for trans-FA+–W indicate the in-plane migration path of water. The out-of-plane pathways for trans-AA+–W correspond to the slow (blue) and fast (red) migration channels, respectively. | ||
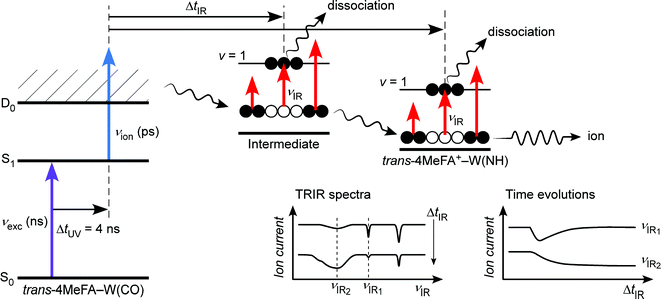
In the present work, we apply ps-TRIR spectroscopy and ab initio MD simulation to the monohydrated clusters of trans-4-methylformanilide (4MetFA–W) to determine the effect of IVR acceleration by a CH3 group. The ps-TRIR spectra and time evolutions are measured herein by a new spectroscopic approach, namely a nanosecond excitation–picosecond ionization–picosecond IR probe (ns–ps–ps) technique. An increased spectral resolution realized by replacement of the excitation laser from a ps to ns laser allows us to achieve a higher species-selectivity in ps-TRIR spectroscopy, which is crucial in cluster spectroscopy. The CH3 group in 4MetFA is located at the remote para-position to the peptide linkage (–CONH–), and thus does not interfere with the water migration pathway. From the comparison to the dynamics of tFA+–W, we can discuss the effect of the density of states on the single water migration dynamics.
2. Experimental and theoretical methods
2.1. Experimental
4MetFA (Tokyo Chemical Industry Co., LTD, >98%) was used without further purification. The sample of 4MetFA was put in a glass tube with molecular sieves and set in a holder behind a pulsed valve, both of which were heated to 343 K. Water was stored in a vessel located between the carrier gas cylinder and the valve, and cooled down to 243 K. Vapor of 4MetFA and water was seeded in He (1–2 bar), and the resulting mixture was expanded into vacuum through the pulsed valve.
The jet expansion was collimated by a skimmer (ϕ = 2 mm) and introduced into the acceleration region of a time-of-flight mass spectrometer. The molecular beam was irradiated by the ns laser pulses, and the resulting ions were detected by a Daly detector at the end of the flight tube. Pulsed-field extraction was employed for introducing the ions into the flight tube to minimize field shifts in the ionization energy. The field shift of 14 cm−1 resulting from field ionization of Rydberg states was determined on the basis of the adiabatic ionization energy (IE0) of phenol27 recorded under the same condition. The νexc and νion pulses were generated by second harmonic generation of dye laser outputs pumped by Nd:YAG lasers. The νIR pulse was obtained by difference-frequency generation as described elsewhere,28,29 but the nonlinear crystal was changed from LiNbO3 to KTA. Laser frequencies were calibrated to within ±1 cm−1 by a wavemeter, while relative frequencies are determined to within ±0.5 cm−1. The νexc and νion beams were focused on the molecular beam by a lens with f = 1500 mm after adjusting focusing by telescopes equipped with a spatial filter. The νIR beam was introduced in a counter propagating manner to the UV pulses and focused by a BaF2 lens with f = 350 mm.
The 4MetFA–W clusters were produced in a similar manner to that of the stationary spectroscopy but in a pulsed free jet expansion. The clusters were irradiated by laser pulses ca. 1 cm downstream from the pulsed valve, and resulting ions were turned by 90° into a quadrupole mass filter before the ion current in the 4MetFA+–W mass channel was detected by a channeltron. Picosecond laser pulses were generated by a high-energy ps laser setup described in detail elsewhere.32–34 Briefly, tunable ps UV (νion (ps)) and IR (νIR (ps)) pulses were generated through optical parametric and nonlinear frequency conversion processes of a ps pulse obtained from regenerative amplification of a femtosecond Ti/Sapphire laser pulse. The energy and time resolutions of the νion (ps) and νIR (ps) pulses were ca. 12 cm−1 and 3 ps, respectively. The second harmonic of a ns dye laser pumped by a Nd:YAG laser was used as excitation UV pulse (νexc (ns)). These pulses were then combined by beam combiners and focused on the jet expansion by a CaF2 lens with f = 300 mm after adjusting the focusing by telescopes. The delay time between the ps UV and IR pulses (ΔtIR) was controlled by optical delay stages. The delay between νexc (ns) and νion (ps) (ΔtUV) was separated by ca. 4 ns (adjusted by a digital delay generator) to avoid unexpected photoprocesses caused by their overlap. This delay is shorter than the lifetime of the cluster measured as 13 ns (see Fig. S2 in ESI†).
2.2. Theoretical methods
Quantum chemical calculations were carried out at the CAM-B3LYP/aug-cc-pVTZ level of theory with the GD3BJ empirical dispersion correction using Gaussian16.35 Relative energies (Erel) of structural isomers of 4MetFA–W were evaluated including the (non-scaled) harmonic zero-point energy (ZPE) correction estimated from the normal mode analysis. The theoretical vibrational frequencies were scaled by 0.95 for comparison with experimental IR spectra.In order to generate the initial conditions for the MD simulations of 4MetFA–W in the D0 state, a 50 ps long trajectory in the S1 excited electronic state at a constant temperature of T = 100 K was run employing the TD-CAM-B3LYP functional. This temperature is chosen to reproduce the experimental excess energy after photoionization and is the same as the one used for the tAA+–W simulations. After initial equilibration, structures and velocities in regular time intervals were sampled, thus generating an ensemble of 50 initial conditions. The MD simulations starting from these initial conditions were propagated for 10 ps in the D0 cationic state. The integration of the classical equations of motions was performed using the velocity Verlet algorithm with a time step of 0.2 fs, which is sufficiently small to obtain adequate conservation of energy. At each step of the trajectories, electronic and nuclear dipole moments are calculated in order to serve as basis for simulating the ps-TRIR spectra. The latter are simulated according to the procedure that has been presented previously (for details see ref. 21, 24, 36 and 37). Briefly, the ps-TRIR spectrum is expressed as a trajectory average of the windowed Fourier transform of the dipole derivative function of each trajectory, where the probe pulse envelope serves as a window. The finite width of the pump pulse is obtained by convoluting the transient IR spectra with the experimental time resolution obtained from measuring the cationic state population of the NH isomer, which does not undergo any isomerisation dynamics. In the simulations, Gaussian-shaped laser pulses with the envelope of a FWHM of 3 ps were employed. The pulse widths correspond to the experimentally determined values.
3. Results and discussion
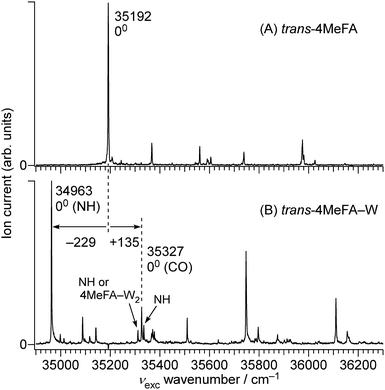
3.1. UV spectra
![[thin space (1/6-em)]](https://www.rsc.org/images/entities/char_2009.gif) 192 cm−1, which is red-shifted by 812 cm−1 from the S1 ← S0 origin of tFA (36
192 cm−1, which is red-shifted by 812 cm−1 from the S1 ← S0 origin of tFA (36![[thin space (1/6-em)]](https://www.rsc.org/images/entities/char_2009.gif) 004 cm−1).38–42 This red-shift is in line with shifts induced by CH3 substitution at the para-position of mono-substituted benzenes as summarized in Table S1 (ESI†), and no other prominent band was observed below this transition. Thus, this band is assigned to the S1 ← S0 origin of 4MetFA. This assignment is confirmed by IR spectroscopy discussed in Section 3.2. From the analogy to tFA and tAA,26,43–45 other weaker features are assigned to S1 vibronic bands (Table 1).
004 cm−1).38–42 This red-shift is in line with shifts induced by CH3 substitution at the para-position of mono-substituted benzenes as summarized in Table S1 (ESI†), and no other prominent band was observed below this transition. Thus, this band is assigned to the S1 ← S0 origin of 4MetFA. This assignment is confirmed by IR spectroscopy discussed in Section 3.2. From the analogy to tFA and tAA,26,43–45 other weaker features are assigned to S1 vibronic bands (Table 1).
| Species | ν obs/cm−1 | ν vib/cm−1 | Assignmentsbcd |
|---|---|---|---|
| a Shift from the monomer 00 transition. b Wilson notation. c (NH) and (CO) mean the NH- and CO-bound isomers, respectively. The isomer assignment is assured from IR-UV hole-burning spectra. d The ? symbols indicate tentative or unknown vibrational assignments. | |||
| trans-4MeFA | 35![[thin space (1/6-em)]](https://www.rsc.org/images/entities/char_2009.gif) 192 192 |
0 | 00 |
35![[thin space (1/6-em)]](https://www.rsc.org/images/entities/char_2009.gif) 207 207 |
15 | 2e′Me rot | |
35![[thin space (1/6-em)]](https://www.rsc.org/images/entities/char_2009.gif) 244 244 |
52 | 3a1′′Me rot (?) | |
35![[thin space (1/6-em)]](https://www.rsc.org/images/entities/char_2009.gif) 367 367 |
175 | β amide | |
35![[thin space (1/6-em)]](https://www.rsc.org/images/entities/char_2009.gif) 561 561 |
369 |
ν
18![[thin space (1/6-em)]](https://www.rsc.org/images/entities/char_2009.gif) or or![[thin space (1/6-em)]](https://www.rsc.org/images/entities/char_2009.gif) 16 16
|
|
35![[thin space (1/6-em)]](https://www.rsc.org/images/entities/char_2009.gif) 739 739 |
547 | ν 6b | |
35![[thin space (1/6-em)]](https://www.rsc.org/images/entities/char_2009.gif) 975 975 |
783 | ν 12 or γNH | |
| trans-4MeFA–W | 34![[thin space (1/6-em)]](https://www.rsc.org/images/entities/char_2009.gif) 963 (−229)a 963 (−229)a |
0 | 00 (NH) |
34![[thin space (1/6-em)]](https://www.rsc.org/images/entities/char_2009.gif) 998 998 |
35 | 2e′Me rot (NH) | |
35![[thin space (1/6-em)]](https://www.rsc.org/images/entities/char_2009.gif) 013 013 |
50 | 3a1′′Me rot (NH) | |
35![[thin space (1/6-em)]](https://www.rsc.org/images/entities/char_2009.gif) 088 088 |
125 | σ H2O (NH) | |
35![[thin space (1/6-em)]](https://www.rsc.org/images/entities/char_2009.gif) 142 142 |
179 | β amide (NH) | |
35![[thin space (1/6-em)]](https://www.rsc.org/images/entities/char_2009.gif) 327 (+135)a 327 (+135)a |
0 | 00 (CO) | |
35![[thin space (1/6-em)]](https://www.rsc.org/images/entities/char_2009.gif) 336 336 |
373 | ν 18 or ν16 (NH) | |
35![[thin space (1/6-em)]](https://www.rsc.org/images/entities/char_2009.gif) 371 371 |
407 | ? (NH) | |
35![[thin space (1/6-em)]](https://www.rsc.org/images/entities/char_2009.gif) 511 511 |
547 | ν 6b (NH) | |
35![[thin space (1/6-em)]](https://www.rsc.org/images/entities/char_2009.gif) 748 748 |
785 | ν 12 or γNH (NH) | |
| 833 | ? (NH) | ||
| 911 | ν 1? (NH) | ||
36![[thin space (1/6-em)]](https://www.rsc.org/images/entities/char_2009.gif) 111 111 |
784 | ν 12 or γNH (CO) | |
36![[thin space (1/6-em)]](https://www.rsc.org/images/entities/char_2009.gif) 156 156 |
829 | ? (CO) | |
The complicated appearance of the REMPI spectrum of 4MetFA–W shown in Fig. 3(A) suggests the existence of several isomers. In the case of tFA, hydration occurs at either the NH or CO sites, and the S1 origins are shifted by −218 and +113 cm−1 from the tFA monomer, respectively.39–41 The REMPI spectrum of 4MetFA–W shows two pronounced bands shifted by −229 and +135 cm−1 from the origin band of the 4MetFA monomer. Thus, these features are attributed to the origin bands of the NH- and CO-bound isomers of 4MetFA–W, respectively. These assignments are confirmed below by IR and IR-UV hole-burning (IR-HB) spectroscopies. Major assignments including vibronic bands are summarized in Table 1.
The conformation of the amide group in FA keeps a small population in the cis form even under jet-cooled conditions.40,42 The S1 ← S0 origin band of cis-FA (34![[thin space (1/6-em)]](https://www.rsc.org/images/entities/char_2009.gif) 914 cm−1) shows a red-shift of −1091 cm−1 from that of tFA (36
914 cm−1) shows a red-shift of −1091 cm−1 from that of tFA (36![[thin space (1/6-em)]](https://www.rsc.org/images/entities/char_2009.gif) 004 cm−1) accompanied with a long progression arising from a change in planarity of the amide group.40 The cis-4MeFA is also detected by REMPI spectroscopy as shown in Fig. S3 in ESI.† The spectrum shows much more complicated features than for cis-FA, probably due to coupling with the CH3 internal rotation. The detection of cis-FA–W in a jet expansion was reported recently by microwave spectroscopy.46 However, no transition assignable to cis-4MeFA–W was detected by REMPI spectroscopy in the present work. A much larger hydration-induced origin shift and/or some fast dynamics from the S1 state for the cis isomers may be reasons for the absence in the investigated spectral range.
004 cm−1) accompanied with a long progression arising from a change in planarity of the amide group.40 The cis-4MeFA is also detected by REMPI spectroscopy as shown in Fig. S3 in ESI.† The spectrum shows much more complicated features than for cis-FA, probably due to coupling with the CH3 internal rotation. The detection of cis-FA–W in a jet expansion was reported recently by microwave spectroscopy.46 However, no transition assignable to cis-4MeFA–W was detected by REMPI spectroscopy in the present work. A much larger hydration-induced origin shift and/or some fast dynamics from the S1 state for the cis isomers may be reasons for the absence in the investigated spectral range.
![[thin space (1/6-em)]](https://www.rsc.org/images/entities/char_2009.gif) 135 and 62
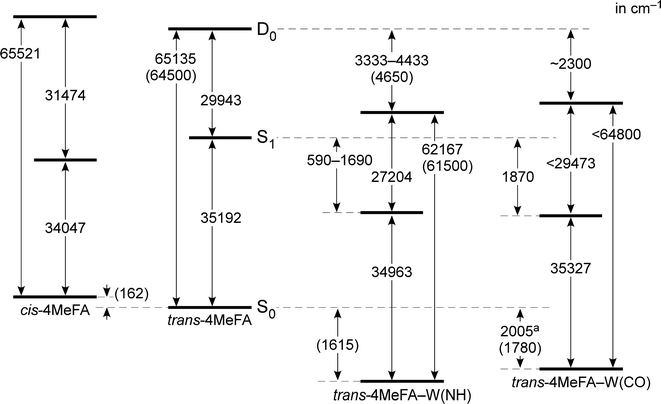
135 and 62![[thin space (1/6-em)]](https://www.rsc.org/images/entities/char_2009.gif) 167 cm−1 corresponding to their adiabatic ionization energies. These are field-corrected values, which was 14 cm−1 in the measurements. Appearance of the sharp steps means similarity of the structures between the S1 and D0 states. The red-shift of IE0 (−2237 cm−1) induced by the p-methyl substitution is consistent to other mono-substituted benzenes (see Table S2 in ESI†). On the other hand, the PIE spectrum of 4MetFA–W(CO) shows a gradual increase, and no clear step is seen. Thus, only an upper bound of IE0, 64
167 cm−1 corresponding to their adiabatic ionization energies. These are field-corrected values, which was 14 cm−1 in the measurements. Appearance of the sharp steps means similarity of the structures between the S1 and D0 states. The red-shift of IE0 (−2237 cm−1) induced by the p-methyl substitution is consistent to other mono-substituted benzenes (see Table S2 in ESI†). On the other hand, the PIE spectrum of 4MetFA–W(CO) shows a gradual increase, and no clear step is seen. Thus, only an upper bound of IE0, 64![[thin space (1/6-em)]](https://www.rsc.org/images/entities/char_2009.gif) 800 cm−1, was estimated from the position at which a detectable signal level could be obtained. The broad onset of the PIE spectrum is indicative of a large structural change upon ionization (including water migration) of 4MetFA–W(CO), similar to those observed for tFA–W(CO) and tAA–W(CO).
800 cm−1, was estimated from the position at which a detectable signal level could be obtained. The broad onset of the PIE spectrum is indicative of a large structural change upon ionization (including water migration) of 4MetFA–W(CO), similar to those observed for tFA–W(CO) and tAA–W(CO).
PDE spectra of 4MetFA–W(NH/CO) were recorded to determine the binding energies of the water ligand in a similar manner to that of PIE measurements by monitoring 4MetFA+ produced from photodissociation of the clusters (Fig. S5 in ESI†). The binding energy was estimated only for 4MetFA–W(CO), while that of 4MetFA–W(NH) was not determined because no clear dissociation threshold was observed. Transition energies of 4MetFA and 4MetFA–W(NH/CO) obtained in this work are summarized in the energy diagram shown in Fig. 4. Corresponding values for tFA(–W) and tAA(–W) are compared in Fig. S6 (ESI†), and for a detailed discussion of this diagram, we refer to previous work.23,47
3.2. Stationary IR spectra
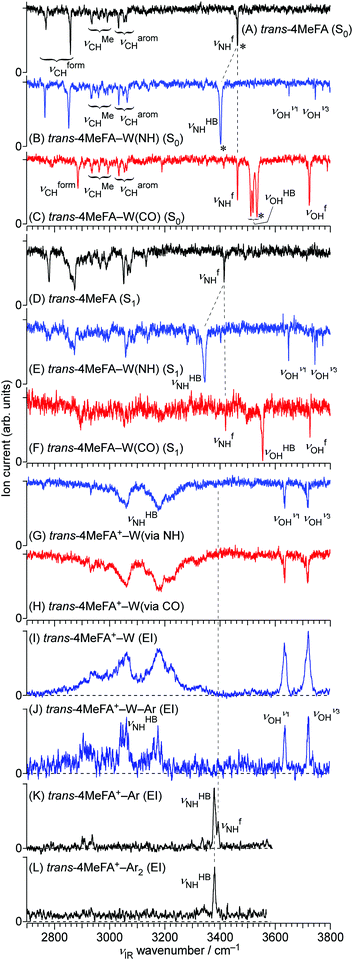
All stationary IR spectra measured in this study are compared in Fig. 5, including 4MetFA and 4MetFA–W in the S0 (A–C), S1 (D–F) and D0 states (G, H). These spectra were obtained by IR dip spectroscopy. On the other hand, Fig. 5(I–L) show EI-IR spectra of 4MetFA+–W, 4MetFA+–W–Ar, and 4MetFA+–Ar1,2. Comparison with theoretical IR spectra is shown in Fig. S7 and S8 in the ESI.†| ν CHOCH | ν MeCH | ν aromCH | ν HBNH | ν fNH | ν HBOH | ν fOH | |
|---|---|---|---|---|---|---|---|
| a Splitting due to anharmonic coupling. | |||||||
| trans-4MeFA | 2770a | 2936 | 3033 | — | 3463 | — | — |
| 2859a | 2962 | 3053 | |||||
| 2993 | 3061 | ||||||
| cis-4MeFA | 2871 | 2934 | 3035 | — | 3441 | — | — |
| 2963 | 3062 | ||||||
| 2996 | |||||||
| trans-4MeFA–W(NH) | 2766a | 2934 | 3033 | 3402 | — | — | 3650 (ν1) |
| 2852a | 2960 | 3050 | 3745 (ν3) | ||||
| 2985 | 3063 | ||||||
| 2993 | |||||||
| trans-4MeFA–W(CO) | 2792a | 2936 | 3035 | — | 3464 | 3512a | 3724 |
| 2886a | 2963 | 3054 | 3520a | ||||
| 2995 | 3062 | 3534a | |||||
Fig. 5(B and C) shows IR spectra of 4MetFA–W recorded by probing at the 34![[thin space (1/6-em)]](https://www.rsc.org/images/entities/char_2009.gif) 963 and 35
963 and 35![[thin space (1/6-em)]](https://www.rsc.org/images/entities/char_2009.gif) 327 cm−1 origin bands in the REMPI spectrum, respectively. They are assigned to 4MetFA–W(NH) and 4MetFA–W(CO) isomers according to the appearance of the hydrogen-bonded and free NH stretching bands (νHBNH and νfNH, respectively) consistent with the S1 origin band shifts. IR-HB spectra shown in Fig. S9 in ESI† confirm that these bands are indeed the S1 ← S0 origin transitions of these isomers, because they are the lowest-energy transitions in each spectrum.
327 cm−1 origin bands in the REMPI spectrum, respectively. They are assigned to 4MetFA–W(NH) and 4MetFA–W(CO) isomers according to the appearance of the hydrogen-bonded and free NH stretching bands (νHBNH and νfNH, respectively) consistent with the S1 origin band shifts. IR-HB spectra shown in Fig. S9 in ESI† confirm that these bands are indeed the S1 ← S0 origin transitions of these isomers, because they are the lowest-energy transitions in each spectrum.
| Species | ν CHOCH | ν MeCH | ν aromCH | ν HBNH | ν fNH | ν HBOH | ν fOH |
|---|---|---|---|---|---|---|---|
| a Fermi resonance multiplets arising from anharmonic coupling of strongly IR active NH fundamental and overtones. b The ? symbols indicate tentative assignments. | |||||||
| trans-4MeFA+–Ar (EI-IR) | 2937 (?) | 2903 (?) | 3378 (NH-bound) | 3393 (π-bound) | |||
| trans-4MeFA+–W (via NH) | 2931 (?) | 3060a | — | — | 3634 (ν1) | ||
| 3180a | 3718 (ν3) | ||||||
| 3215a | |||||||
| trans-4MeFA+–W (via CO) | 2932 (?) | 3060a | 3634 (ν1) | ||||
| 3180a | 3717 (ν3) | ||||||
| 3215a | |||||||
| trans-4MeFA+–W–Ar (EI-IR) | 2915a | 3634 (ν1) | |||||
| 3150a | 3719 (ν3) | ||||||
| 3175a | |||||||
Fig. 5(K and L) shows EI-IR spectra of 4MetFA+–Ar1,2. Ar tagging enables us to probe vibrational spectra of the monomer cation, for which single-photon IRPD does not work. Also, attachment of weakly-bound Ar atom(s) reduces the internal energy of the cation, and definite band positions can be determined by avoiding influences from hot bands. These spectra are again nearly identical to those of tFA+–Ar1,2,59 reflecting the negligible perturbation of the CH3 group in the para-position on the amide vibrations. The NH stretching vibration appears at 3380–3390 cm−1 as a doublet reflecting the two possible binding sites for Ar. The higher frequency component stems from νfNH of the π-bound isomer, in which Ar sticks on the aromatic ring, while the lower one arises from νHBNH of the NH-bound isomer, in which Ar is hydrogen-bonded to the NH group.59,60 The νfNH band disappears in 4MetFA+–Ar2 because the most stable NH binding site is occupied by one of the Ar atoms (the other sits on the π ring).
Transitions observed in the IR-UV hole-burning spectra of 4MetFA–W(NH/CO) reproduce the total REMPI spectrum, confirming that the two isomers are the only species observed in the jet expansion. From the lowest transition of each spectrum, the S1 ← S0 origin transitions of the NH/CO bound clusters are determined to be 34![[thin space (1/6-em)]](https://www.rsc.org/images/entities/char_2009.gif) 963 and 35
963 and 35![[thin space (1/6-em)]](https://www.rsc.org/images/entities/char_2009.gif) 327 cm−1, respectively, as deduced from the shifts from that of the monomer. Major vibronic features are tentatively assigned in Table 1.
327 cm−1, respectively, as deduced from the shifts from that of the monomer. Major vibronic features are tentatively assigned in Table 1.
3.3. Picosecond time-resolved IR spectroscopy
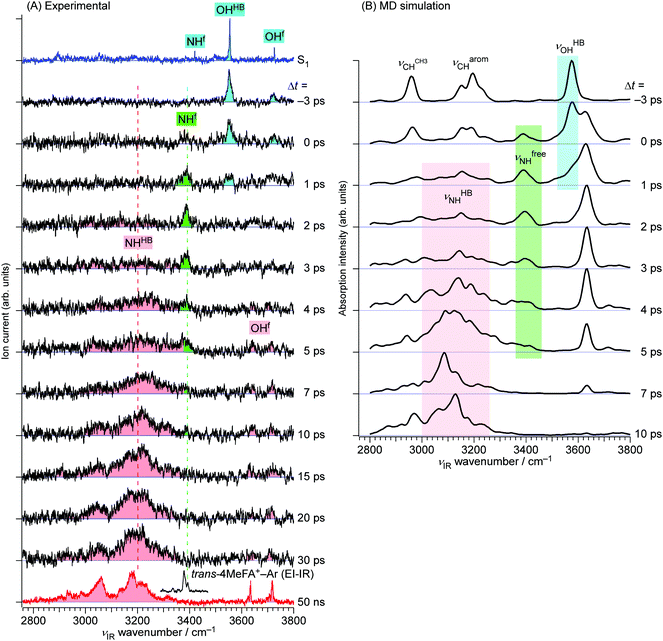
The ps-TRIR spectra prove that the O–H⋯O![[double bond, length as m-dash]](https://www.rsc.org/images/entities/char_e001.gif) C hydrogen bond is cleaved by ionization, and the water molecule starts the isomerization. This process is caused by the strong repulsion between the created positive charge of the cation and the partial positive charges on the water hydrogens. The ps-TRIR spectra also illustrate the existence of an intermediate during the course of the isomerization process of the water ligand, because νfNH appears right after ionization and disappears after 10 ps, while νHBNH continuously grows after 3 ps. This assignment of the intermediate means that the water molecule is released from the initial CO site but has not yet arrived at the final NH site in 4MetFA+.
C hydrogen bond is cleaved by ionization, and the water molecule starts the isomerization. This process is caused by the strong repulsion between the created positive charge of the cation and the partial positive charges on the water hydrogens. The ps-TRIR spectra also illustrate the existence of an intermediate during the course of the isomerization process of the water ligand, because νfNH appears right after ionization and disappears after 10 ps, while νHBNH continuously grows after 3 ps. This assignment of the intermediate means that the water molecule is released from the initial CO site but has not yet arrived at the final NH site in 4MetFA+.
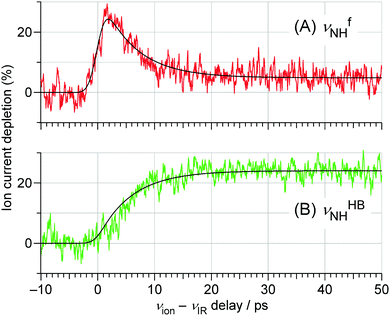 | ||
| Fig. 7 TEs probed at the (A) νfNH (3393 cm−1) and (B) νHBNH (3200 cm−1) vibrations of trans-4MeFA+–W obtained by the ns-excitation–ps-ionization scheme (Fig. 6). The best fits obtained by the kinetic analysis are also shown. The background signal in (A) after 30 ps arises from the tail of the strong νHBNH band. See Section S-13 in ESI† for the detained explanation of the fitting model. | ||
This behavior of the TEs is quite similar to those of tFA+–W and tAA+–W, both of which show water migration motions with an intermediate.20,21,24 The structures of the intermediates, however, are different depending on the migration pathways. In the case of tFA+–W, the water molecule travels along an in-plane path around the CHO group, while in tAA+–W it can take two competing pathways. One is an in-plane path similar to that of tFA+–W, while the other is out-of-plane via an intermediate above the amide group.20,21 These migration mechanisms were concluded through fruitful combination between the experimental observations and ab initio MD simulations. The determination of the rate constants of the observed dynamics in 4MetFA+–W by a kinetic analysis requires a reaction model for the water migration process. Thus, we again deduced the migration model with the help from the ab initio MD simulation discussed in detail in Section 4.
3.4. Kinetic analysis of TEs
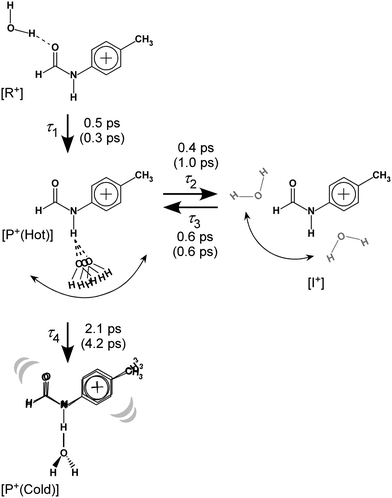 | ||
| Fig. 8 Reaction model used for the kinetic fits of the TEs and resulting time constants. Values in parentheses represent those for trans-FA+–W discussed in detail in Fig. S10 and S11 (ESI†). See Section S-13 in ESI† for the detained explanation of the rate equations. | ||
The initial state corresponds to the Franck–Condon (FC) state of ionization from the S1 origin, and has the νfNH of 4MetFA+ as characteristic mode, but its contribution to the ps-TRIR spectra is low due to its short lifetime. Thus, the νfNH band consists mainly of the intermediate of the hot NH-free structure (I+). The hot NH-bound intermediate (P+(Hot)) and the cold NH-bound product (P+(Cold)) both contribute to νHBNH. Their band positions and intensities are somewhat different because of their different effective hydrogen bond strength. However, the extensive broadening of the νHBNH band makes them indistinguishable in the experiment. The reaction time constants between these four states of the model are represented by τ1–τ4 (Fig. 8). The TEs were fitted by functions derived from the rate equations, details of which are given in the ESI.† In the fitting, functions are convoluted by a Gaussian with a FWHM of 2.8 ps, which represents the time response of the measurement.
| Time constant | trans-4MeFA+–W | trans-FA+–W |
|---|---|---|
| τ 1 | 0.5 | 0.3 |
| τ 2 | 0.4 | 1.0 |
| τ 3 | 0.6 | 0.6 |
| τ 4 | 2.1 | 4.2 |
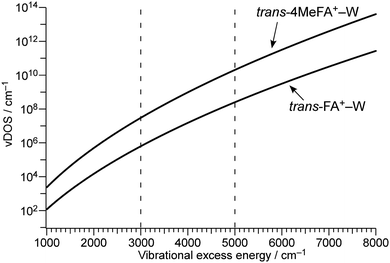
The time constants τ1–τ3 are similar for 4MetFA+–W and tFA+–W, confirming also similar initial migration dynamics in both clusters. Indeed, the MD simulations predict similar in-plane paths around the CHO group with overshooting at the NH site. The time constants reveals however a marked shortening of τ4 for 4MetFA+–W from 4.2 to 2.1 ps, indicating faster translational cooling of the water molecule at the NH site by IVR. This acceleration of IVR can be attributed to an increased vibrational density of states (vDOS) in 4MetFA+ arising from the additional CH3 group. The anharmonic coupling between the in-plane motion of the water molecule and the NH group in tFA+/4MetFA+ is assumed to be the same because of the remote para-substitution of the CH3 group.
To estimate the influence of the vDOS on the IVR rate, Fig. 9 compares the vDOSs of 4MetFA+–W, tFA+–W, and tAA+–W versus internal vibrational energy. The vDOSs were evaluated from differentiation of the smoothed curve of the total number of vibrational states obtained by integrating the number of vibrational states (vNOS) at each vibrational energy. vNOS was calculated using direct counting of the unscaled harmonic vibrational states obtained by the DFT calculations at a given vibrational energy by the Beyer–Swinehart algorithm.61 The internal rotation of the CH3 group was treated separately as a one-dimensional hindered rotation with an effective rotational constants of 5.2 cm−1 on the internal rotation potential (without ZPE correction) obtained by relaxed scans at the same theoretical level. The rotational potentials and energy levels are shown in Fig. S12 in ESI.† Contributions from rotational states were neglected because the differences in rotational constants are small for the structures concerning the isomerization. From their IEs and photon energies used for ionization, the internal vibrational energies of the cluster cations are expected to be in the range of 3000 to 5000 cm−1. In this excess energy range, vDOS of 4MetFA+–W is ca. 80 times higher than that of tFA+–W. This is significantly higher than the observed enhancement of IVR rate (1/τ4) by a factor 2. The higher vDOS in 4MetFA+ arises not only from the free rotational levels but also from other low-frequency vibrations associated with the CH3 group, such as its bending vibrations. Actually, contributions from these vibrations account for ∼40% of the increase in vDOS, meaning that the existence of the CH3 group itself is essential for the higher density of low-frequency bath modes. Symmetry restriction due to the nuclear spin statistics of the CH3 group reduce the effective vDOS. However, the difference between vDOS and the observed increase in the IVR rate is difficult to be rationalized only by the symmetry restriction. From the view point of the tier model (Fig. S14, ESI†),62 the methyl substitution at the para position mainly increases the density of the second tier in the bath, while the doorway states in tFA+–W and 4MetFA+–W are similar. Thus, the acceleration of IVR occurs only from the second tier, and thus the effective IVR enhancement is reduced compared to the increase in vDOS.
4. Ab initio on-the-fly MD simulations
The MD simulations show that the water isomerization in 4MetFA–W proceeds along the same in-plane reaction pathway as in the case of tFA+–W (Fig. 1 and the movie in ESI†).24 In the simulation, the NH site is reached after 500 fs for the first time. The water molecule moves over to the opposite side of the phenyl ring, but finally stabilizes near the final destination, i.e., the NH site in both systems. No out-of-plane migration, which is dominant in tAA+–W, is found.20,21The simulated TR-IR spectra based on the MD simulations are presented in Fig. 6B. The marker bands of the water migration dynamics, νHBOH, νfreeNH, and νHBNH for the initial structure, the intermediate, and the final product are indicated in blue, green, and red color, respectively. The decrease of the νHBOH band, the appearance and disappearance of the intermediate, and the rise of the final product are qualitatively well reproduced.
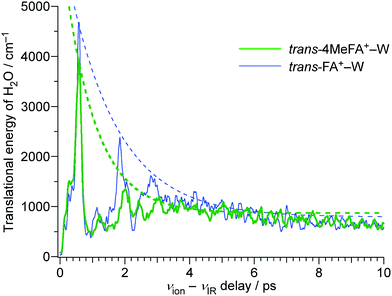
In order to analyze the influence of the CH3 group on the energy redistribution dynamics, we consider the calculated average kinetic energies of the water molecule for the translational motion along the reaction coordinate (Fig. 10). Both tFA+–W and 4MetFA+–W exhibit a fast initial rise of the translational kinetic energy, which reaches a maximum around Δt = 500 fs followed by damped oscillations. The damping constant is significantly shorter for 4MetFA+–W (0.96 ps) than for tFA+–W (1.53 ps). The fast damping of the kinetic energy in 4MetFA+–W is consistent with the fast IVR as already concluded from the observed time evolution. From the reasonable reproduction of the observed time-resolved spectra of 4MetFA+–W, the effect of the CH3 group on the acceleration of the water migration based on IVR is confirmed.
5. Summary
Water migration dynamics induced by photoionization of 4MetFA–W is revealed by the novel ns–ps–ps TRIR spectroscopy approach, which enables both the highly specific selection of the species at high spectral resolution and a sufficiently high time resolution in the ps part. The acceleration of the dynamics by the methyl group is clearly shown by comparison to the ps-TRIR spectra of tFA+–W. The time evolution is analyzed by rate equations based on the four-state model of the migration dynamics. The strong contribution of IVR in the termination of the solvation dynamics is demonstrated. This picture is well reproduced by the ab initio on-the-fly MD simulations. Thus, acceleration of the dynamics by the methyl group and its relation to IVR are confirmed.From the energetics, the driving force of the water migration, i.e. hydration dynamics at the single molecular level, originates from the initial water⋯cation repulsion and the stabilization at the final solvation site by the water⋯NH hydrogen bond. The kinetics of the migration motion is predominantly controlled by the energy randomization process in the cluster. These results point out that both solvent–solute interaction and solute-bath energy flow must be carefully considered in the microscopic description. It demonstrates the advantage of the application of ps-TRIR spectroscopy to solvated clusters for the study of solvation dynamics at the molecular level, which is still challenging in the condensed phase.
Conflicts of interest
There are no conflicts to declare.Acknowledgements
This work was supported in part by Bilateral Open Partnership Joint Research Projects of Japan Society for the Promotion of Science, research grant from World Research Hub Initiative (WRHI) of Tokyo Institute of Technology, KAKENHI (19K05368, 19H05527, 20H00372), and the Cooperative Research Program of the “Network Joint Research Center for Materials and Devices”, and Core -to-core program (JPJSCCA20210004) from the Ministry of Education, Culture, Sports, Science and Technology (MEXT), Japan. This study was also supported by Deutsche Forschungsgemeinschaft (DO 729/4-2). The theoretical calculations were performed using the Research Center for Computational Science (RCCS), Okazaki, Japan. M. M. and M. F. are grateful for supports from the Alexander von Humboldt Foundation. O. D. acknowledges travel support from the World Research Hub Initiative (WRHI) of Tokyo Institute of Technology.References
- N. Mataga, H. Chosrowjan and S. Taniguchi, J. Photochem. Photobiol., C, 2005, 6, 37–79 CrossRef CAS.
- M. Maroncelli, J. Macinnis and G. R. Fleming, Science, 1989, 243, 1674–1681 CrossRef CAS.
- M. B. Smith, March's advanced organic chemistry: reactions, mechanisms, and structure, John Wiley & Sons, 2020 Search PubMed.
- M. M. Karelson and M. C. Zerner, J. Phys. Chem., 1992, 96, 6949–6957 CrossRef CAS.
- G. R. Fleming and M. Cho, Annu. Rev. Phys. Chem., 1996, 47, 109–134 CrossRef CAS.
- W. P. de Boeij, M. S. Pshenichnikov and D. A. Wiersma, Annu. Rev. Phys. Chem., 1998, 49, 99–123 CrossRef CAS PubMed.
- F. Persson, P. Söderhjelm and B. Halle, J. Chem. Phys., 2018, 148, 215101 CrossRef PubMed.
- F. Persson, P. Söderhjelm and B. Halle, J. Chem. Phys., 2018, 148, 215103 CrossRef PubMed.
- M.-C. Bellissent-Funel, A. Hassanali, M. Havenith, R. Henchman, P. Pohl, F. Sterpone, D. v. d. Spoel, Y. Xu and A. E. Garcia, Chem. Rev., 2016, 116, 7673–7697 CrossRef CAS PubMed.
- M. S. Cheung, A. E. Garcia and J. N. Onuchic, Proc. Natl. Acad. Sci. U. S. A., 2002, 99, 685–690 CrossRef CAS PubMed.
- B. Bagchi, Chem. Rev., 2005, 105, 3197–3219 CrossRef CAS.
- D. Zhong, S. K. Pal and A. H. Zewail, Chem. Phys. Lett., 2011, 503, 1–11 CrossRef CAS.
- S. K. Pal and A. H. Zewail, Chem. Rev., 2004, 104, 2099–2123 CrossRef CAS.
- S. M. Bhattacharyya, Z.-G. Wang and A. H. Zewail, J. Phys. Chem. B, 2003, 107, 13218–13228 CrossRef CAS.
- L. Nilsson and B. Halle, Proc. Natl. Acad. Sci. U. S. A., 2005, 102, 13867–13872 CrossRef CAS.
- N. Nandi, K. Bhattacharyya and B. Bagchi, Chem. Rev., 2000, 100, 2013–2045 CrossRef CAS PubMed.
- X. J. Jordanides, M. J. Lang, X. Song and G. R. Fleming, J. Phys. Chem. B, 1999, 103, 7995–8005 CrossRef CAS.
- N. V. Nucci, M. S. Pometun and A. J. Wand, Nat. Struct. Mol. Biol., 2011, 18, 245–250 CrossRef CAS PubMed.
- S. Mondal, S. Mukherjee and B. Bagchi, J. Phys. Chem. Lett., 2017, 8, 4878–4882 CrossRef CAS PubMed.
- K. Tanabe, M. Miyazaki, M. Schmies, A. Patzer, M. Schütz, H. Sekiya, M. Sakai, O. Dopfer and M. Fujii, Angew. Chem., Int. Ed., 2012, 51, 6604–6607 CrossRef.
- M. Wohlgemuth, M. Miyazaki, M. Weiler, M. Sakai, O. Dopfer, M. Fujii and R. Mitrić, Angew. Chem., Int. Ed., 2014, 53, 14601–14604 CrossRef CAS PubMed.
- M. Miyazaki, T. Nakamura, M. Wohlgemuth, R. Mitrić, O. Dopfer and M. Fujii, Phys. Chem. Chem. Phys., 2015, 17, 29969–29977 RSC.
- O. Dopfer and M. Fujii, Chem. Rev., 2016, 116, 5432–5463 CrossRef CAS PubMed.
- M. Wohlgemuth, M. Miyazaki, K. Tsukada, M. Weiler, O. Dopfer, M. Fujii and R. Mitrić, Phys. Chem. Chem. Phys., 2017, 19, 22564–22572 RSC.
- M. Miyazaki, A. Naito, T. Ikeda, J. Klyne, K. Sakota, H. Sekiya, O. Dopfer and M. Fujii, Phys. Chem. Chem. Phys., 2018, 20, 3079–3091 RSC.
- S. Ullrich and K. Müller-Dethlefs, J. Phys. Chem. A, 2002, 106, 9188–9195 CrossRef CAS.
- S. Ullrich, G. Tarczay and K. Müller-Dethlefs, J. Phys. Chem. A, 2002, 106, 1496–1503 CrossRef CAS.
- M. Miyazaki, J. Saikawa, H. Ishizuki, T. Taira and M. Fujii, Phys. Chem. Chem. Phys., 2009, 11, 6098–6106 RSC.
- M. Miyazaki and M. Fujii, Phys. Chem. Chem. Phys., 2017, 19, 22759–22776 RSC.
- O. Dopfer, Z. Phys. Chem., 2005, 219, 125–168 CrossRef CAS.
- O. Dopfer, Int. Rev. Phys. Chem., 2003, 22, 437–495 Search PubMed.
- S. Ishiuchi, M. Sakai, Y. Tsuchida, A. Takeda, Y. Kawashima, M. Fujii, O. Dopfer and K. Müller-Dethlefs, Angew. Chem., Int. Ed., 2005, 44, 6149–6151 CrossRef CAS PubMed.
- M. Sakai, S. Ishiuchi and M. Fujii, Eur. Phys. J. D, 2002, 20, 399–402 CrossRef CAS.
- S. Ishiuchi, M. Sakai, K. Daigoku, T. Ueda, T. Yamanaka, K. Hashimoto and M. Fujii, Chem. Phys. Lett., 2001, 347, 87–92 CrossRef CAS.
- M. J. Frisch, G. W. Trucks, H. B. Schlegel, G. E. Scuseria, M. A. Robb, J. R. Cheeseman, G. Scalmani, V. Barone, G. A. Petersson, H. Nakatsuji, X. Li, M. Caricato, A. V. Marenich, J. Bloino, B. G. Janesko, R. Gomperts, B. Mennucci, H. P. Hratchian, J. V. Ortiz, A. F. Izmaylov, J. L. Sonnenberg, D. Williams-Young, F. L. F. Ding, J. G. F. Egidi, A. P. B. Peng, T. Henderson, D. Ranasinghe, V. G. Zakrzewski, J. Gao, N. Rega, G. Zheng, W. Liang, M. Hada, M. Ehara, K. Toyota, R. Fukuda, J. Hasegawa, M. Ishida, T. Nakajima, Y. Honda, O. Kitao, H. Nakai, T. Vreven, K. Throssell, J. J. A. Montgomery, J. E. Peralta, F. Ogliaro, M. J. Bearpark, J. J. Heyd, E. N. Brothers, K. N. Kudin, V. N. Staroverov, T. A. Keith, R. Kobayashi, J. Normand, K. Raghavachari, A. P. Rendell, J. C. Burant, S. S. Iyengar, J. Tomasi, M. Cossi, J. M. Millam, M. Klene, C. Adamo, R. Cammi, J. W. Ochterski, R. L. Martin, K. Morokuma, O. Farkas, J. B. Foresman and D. J. Fox, Gaussian 16 Revision C.01, Gaussian, Wallingford CT, 2016 Search PubMed.
- V. Bonačić-Koutecký and R. Mitrić, Chem. Rev., 2005, 105, 11–66 CrossRef.
- R. Mitrić and V. Bonačić-Koutecký, Phys. Rev. A: At., Mol., Opt. Phys., 2007, 76, 031405 CrossRef.
- M. Mons, I. Dimicoli, B. Tardivel, F. Piuzzi, E. G. Robertson and J. P. Simons, J. Phys. Chem. A, 2001, 105, 969–973 CrossRef CAS.
- E. G. Robertson, Chem. Phys. Lett., 2000, 325, 299–307 CrossRef CAS.
- J. A. Dickinson, M. R. Hockridge, E. G. Robertson and J. P. Simons, J. Phys. Chem. A, 1999, 103, 6938–6949 CrossRef CAS.
- A. V. Fedorov and J. R. Cable, J. Phys. Chem. A, 2000, 104, 4943–4952 CrossRef CAS.
- V. P. Manea, K. J. Wilson and J. R. Cable, J. Am. Chem. Soc., 1997, 119, 2033–2039 CrossRef CAS.
- S. Ullrich and K. Müller-Dethlefs, J. Phys. Chem. A, 2002, 106, 9181–9187 CrossRef CAS.
- S. Ullrich, G. Tarczay, X. Tong, C. E. H. Dessent and K. Müller-Dethlefs, Phys. Chem. Chem. Phys., 2001, 3, 5450–5458 RSC.
- S. Ullrich, X. Tong, G. Tarczay, C. E. H. Dessent and K. Müller-Dethlefs, Phys. Chem. Chem. Phys., 2002, 4, 2897–2903 RSC.
- P. Pinacho, S. Blanco and J. C. López, Phys. Chem. Chem. Phys., 2019, 21, 2177–2185 RSC.
- M. Weiler, T. Nakamura, H. Sekiya, O. Dopfer, M. Miyazaki and M. Fujii, ChemPhysChem, 2012, 13, 3875–3881 CrossRef CAS PubMed.
- T. Ikeda, K. Sakota, Y. Kawashima, Y. Shimazaki and H. Sekiya, J. Phys. Chem. A, 2012, 116, 3816–3823 CrossRef CAS PubMed.
- K. Sakota, Y. Shimazaki and H. Sekiya, Phys. Chem. Chem. Phys., 2011, 13, 6411–6415 RSC.
- K. Sakota, S. Harada, Y. Shimazaki and H. Sekiya, J. Phys. Chem. A, 2011, 115, 626–630 CrossRef CAS.
- K. Sakota, S. Harada and H. Sekiya, Chem. Phys., 2013, 419, 138–144 CrossRef CAS.
- T. Nakamura, M. Schmies, A. Patzer, M. Miyazaki, S. Ishiuchi, M. Weiler, O. Dopfer and M. Fujii, Chem. – Eur. J., 2014, 20, 2031–2039 CrossRef CAS PubMed.
- T. Ikeda, K. Sakota and H. Sekiya, J. Phys. Chem. A, 2017, 121, 5809–5816 CrossRef CAS PubMed.
- T. Ikeda, K. Sakota and H. Sekiya, J. Phys. Chem. A, 2016, 120, 1825–1832 CrossRef CAS PubMed.
- K. Sakota, Y. Kouno, S. Harada, M. Miyazaki, M. Fujii and H. Sekiya, J. Chem. Phys., 2012, 137, 224311 CrossRef PubMed.
- M. Gerhards, A. Jansen, C. Unterberg and A. Gerlach, J. Chem. Phys., 2005, 123, 074320 CrossRef CAS PubMed.
- M. Gerhards and C. Unterberg, Appl. Phys. A: Mater. Sci. Process., 2001, 72, 273–279 CrossRef CAS.
- H. M. Kim, K. Y. Han, J. Park, G. S. Kim and S. K. Kim, J. Chem. Phys., 2008, 128, 041104 CrossRef PubMed.
- J. Klyne, M. Schmies and O. Dopfer, J. Phys. Chem. B, 2014, 118, 3005–3017 CrossRef CAS PubMed.
- M. Schmies, A. Patzer, M. Schütz, M. Miyazaki, M. Fujii and O. Dopfer, Phys. Chem. Chem. Phys., 2014, 16, 7980–7995 RSC.
- T. Beyer and D. F. Swinehart, Commun. ACM, 1973, 16, 379 CrossRef.
- R. H. Page, Y. R. Shen and Y. T. Lee, J. Chem. Phys., 1988, 88, 4621–4636 CrossRef CAS.
Footnote |
| † Electronic supplementary information (ESI) available: [DETAILS]. See DOI: 10.1039/d1cp03327a |
| This journal is © the Owner Societies 2022 |

