 Open Access Article
Mass transfer of toluene in a series of metal–organic frameworks: molecular clusters inside the nanopores cause slow and step-like release†
Chun
Li
 ,
Zejun
Zhang
 and
Lars
Heinke
 *
*
Institute of Functional Interfaces (IFG), Karlsruhe Institute of Technology (KIT), Hermann-von-Helmholtz-Platz 1, 76344 Eggenstein-Leopoldshafen, Germany. E-mail: Lars.Heinke@KIT.edu
First published on 1st February 2022
Abstract
The mass transfer of the guest molecules in the pores is fundamental for the application of nanoporous materials like metal–organic frameworks, MOFs. In the present work, we explore the uptake and release of toluene in a series of Zr-based MOFs with different pore sizes. We find that intermolecular guest–guest interaction, sterically controlled by the pore size, has a substantial impact on the release kinetics. While the adsorption is rather fast, the desorption process is many orders of magnitude slower. Depending on the pore size, molecular clusters form, here (most likely) toluene dimers, which are rather stable and their break-up is rate-limiting during the desorption process. This results in a step-like desorption kinetics, deviating from the plain Fickian-diffusion-controlled release. Temperature-dependent experiments show that the minimum and maximum of the release rates are obtained at the same toluene loadings, independent of the temperature. Moreover, the activation energy for the release coincides with the binding energy of a toluene dimer. The work shows the importance of intermolecular guest–guest interaction, controlled by the MOF-nanoconfinement, for the uptake and release from nanoporous materials.
1 Introduction
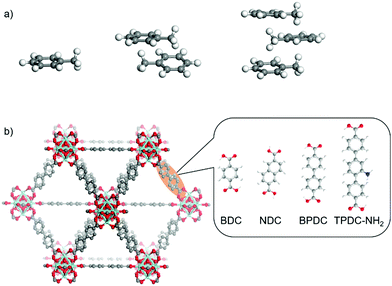
Nanoporous materials like metal–organic frameworks (MOFs) attract considerable attention due to potential applications in various fields, such as in gas storage and separation, catalysis, chemical sensing and energy conversion.1–6 In these applications, the mass transfer, which is controlled by the guest–guest and the guest–host interactions, is fundamental.7–12 For example, the mass transfer of the guests in pores may govern the overall efficiency of the catalytic reaction or may result in a fast or sluggish sensor performance. Moreover, the guest mass transfer is crucial for molecular separation and purification applications. Thus, the mass transfer and diffusion properties of various guest molecules in the MOF pores are subjects of intense research.8,13–17 In many guest–host systems, the uptake and release of the guest molecules can be described by individual molecules where guest–guest (intermolecular) interactions have only a small impact on the diffusion properties and the uptake and release can be described by (plain) Fickian diffusion.16 As a result, the uptake and release processes have similar rates.8,18 In some examples, it was found that the guest–guest interaction results in a substantial concentration dependence. For example, the diffusion coefficients of short alkanes in MOF Zn(tbip) increase with increasing pore loading, explained by the Reed–Ehrlich model19,20 and repulsive guest–guest interaction.21,22 This results in a desorption process which is somewhat slower than the adsorption process, by about a factor 3.21 In different theoretical studies, the importance of guest–guest interaction for the diffusion processes was emphasized.23 The formation of molecular clusters and its impact on the diffusion was found for molecules like SF6 and CF4 in the nanopores of zeolites.24 Later, computations showed that molecules like CO2, CH4, benzene and xylene form molecular clusters and dense molecular packings in the pores of various MOF structures.25–28 In a pioneering experimental study, M. Tsotsalas, S. Kitagawa et al. observed the molecular clustering of butanol, diethyl ether and n-pentane in the pores of the prototype MOF HKUST-1.29 It was found that the desorption process is significantly decelerated by the clustering of the molecules. To the best of our knowledge, while there are many computational works published,25–28 this is the only experimental study29 on clustered molecules in MOF pores and its impact on the mass transfer. The impact of the pore size and of the temperature have not yet been experimentally explored.The formation of small non-covalently bound molecular clusters is important in nature. Such cluster formation gives insight in the molecular interaction, like in the π–π interactions between two or more aromatic molecules. This is fundamental for the interaction of neighboring aromatic amino acids in proteins and in nucleic acids.30 Therefore, the formation of clusters of aromatic molecules like toluene was extensively explored.31–34 It was found that the methyl group acts as hydrogen donor and, thus, stabilizes the aromatic cluster. In Fig. 1a, a toluene monomer, a dimer and a trimer are depicted in the most stable shapes as calculated in ref. 35,36.
The aim of the present work is to experimentally study the transient uptake and release of toluene from UiO-MOF films with different pore sizes and to explore molecular clustering effects of the guest molecules in the pores. UiO-MOFs, where UiO stands for Universitetet i Oslo, are a sub-family of MOFs, based on cuboctahedral (Zr6O4(OH)4) metal nodes. UiO-MOFs have a pronounced chemical-stability and their pore size can be tuned by the length of the linker molecules.37 The explored MOF films are UiO-66, UiO-66.5 (also referred to as DUT-5238), UiO-67 and UiO-68-NH2, Table 1. The transient toluene uptake and release were recorded with a quartz crystal microbalance (QCM) in a temperature range from 30 °C to 65 °C. We found that the toluene release from the MOF pores is at least two orders of magnitude slower than the uptake. Moreover, for pores which are large enough for containing toluene dimers, the release kinetics slow down at certain pore loadings and accelerate again after the critical (i.e. stable) pore loading is passed in the release process. Experiments at different temperatures show that the activation energy of the release process is similar to the binding energy of a toluene dimer. The data show that molecular clusters of stable toluene dimers in the MOF pores play a crucial role, governing the mass transport during the release. Reference experiments with different molecules (xylene, cyclohexane, n-hexane and methanol) as well as with a small-pore MOF (ZIF-8) support the interpretation of the data.
| MOF | Pore body diameter (nm) | Pore window diameter (nm) |
|---|---|---|
| UiO-66 | 0.9 | 0.65 |
| UiO-66.5 (DUT-52) | 1.0 | 0.77 |
| UiO-67 | 1.1 | 0.9 |
| UiO-68-NH2 | 1.4 | 1.13 |
2 Experimental section
2.1 Materials
The MOF components are the metal nodes, which are Zirconyl chloride octahydrate 98% (ZrOCl2·8H2O), and the linker molecules, which are 1,4-benzene dicarboxylic acid 98% (BDC), 2,6-naphthalene dicarboxylic acid (NDC), 4,4′-biphenyl dicarboxylic acid 98% (BPDC) and 2′-amino-1,1′![[thin space (1/6-em)]](https://www.rsc.org/images/entities/char_2009.gif) :
:![[thin space (1/6-em)]](https://www.rsc.org/images/entities/char_2009.gif) 4,1′′-terphenyl-4,4′′-dicarboxylic acid (TPDC-NH2). The MOF components and the solvents, which are acetic acid 99.8% (HAC), toluene 99.8% (Tol), N,N-dimethylformamide 99.8% (DMF) and ethanol 99.8% (EtOH), were purchased from Alfa Aesar and VWR. All chemicals were used without further purification. The substrates for the MOF films are gold-coated QCM sensors with a resonance frequency of 5 MHz from Q-Sense, purchased from Biolin Scientific.
4,1′′-terphenyl-4,4′′-dicarboxylic acid (TPDC-NH2). The MOF components and the solvents, which are acetic acid 99.8% (HAC), toluene 99.8% (Tol), N,N-dimethylformamide 99.8% (DMF) and ethanol 99.8% (EtOH), were purchased from Alfa Aesar and VWR. All chemicals were used without further purification. The substrates for the MOF films are gold-coated QCM sensors with a resonance frequency of 5 MHz from Q-Sense, purchased from Biolin Scientific.
2.2 MOF film synthesis
The UiO-type MOF films were synthesized via vapor-assisted conversion (VAC).39 The bottom part of a 200 mL Teflon-lined stainless-steel autoclave was filled with Raschig-rings (1 cm × 1 cm) to obtain an elevated flat platform for the substrates, which are gold-coated QCM sensors. 4.2 mL DMF and 0.8 mL acetic acid were filled in the autoclave. A QCM sensor was placed on top of the Raschig-rings, then fully coated with 40 μL of freshly prepared MOF precursor solution (2.2 mM ZrOCl2, 2.2 mM linker, which was BDC, NDC, BPDC or TPDC-NH2, and 420 mM acetic acid in DMF) and then heated to 100 °C for 3 h. After cooling down to room temperature, the obtained MOF films were dried in vacuum.2.3 Characterizations
The X-ray diffraction (XRD) data of the MOF films were recorded with a Bruker D8 ADVANCE X-ray diffractometer with Cu-Kα1,2 radiation (λ = 1.5418 Å). The diffractograms were recorded with a step width of 2θ![[thin space (1/6-em)]](https://www.rsc.org/images/entities/char_2009.gif) =
= ![[thin space (1/6-em)]](https://www.rsc.org/images/entities/char_2009.gif) 0.02°.
0.02°.
The scanning electron microscopy (SEM) measurements were performed on a TESCAN VEGA3. In order to avoid charging effects, all samples were coated with a 3–4 nm thick platinum film before recording the SEM images.
2.4 Uptake and release experiments
Prior to the uptake experiments, the MOF-coated QCM sensors were stored in ethanol overnight (to remove eventual remains from the MOF synthesis from the pores) and then were activated inside the QCM cell in nitrogen at 65 °C for 10 h. The N2 carrier gas flow was controlled by a mass flow controller with a total mass flow of 100 cm3 min−1. After measuring a constant baseline (usually after t = 10 min), the pure nitrogen gas flow was instantly switched to the nitrogen flow enriched with toluene, which was obtained by flowing the nitrogen gas through a wash bottle filled with liquid toluene. By dew-point-experiments, the partial pressure of the toluene vapor in the flow was determined to be 30 mbar, Fig. S9 (ESI†). After 10 minutes, the gas flow through the cell was switched back to pure nitrogen again and the toluene was released from the MOF. The frequency shift of the QCM sensor was recorded. The mass changes and the toluene uptake by the MOF films were calculated by the Sauerbrey equation.40–42 The temperature of the QCM cell was controlled and the uptake experiments were performed at 30 °C, 40 °C, 50 °C, 60 °C and 65 °C. Each uptake and release experiment was repeated twice. The experiments were reproduced with a second set of samples. More details on the QCM setup for the uptake and release experiments can be found in previous publications.42–443 Results and discussion
For exploring the effect of toluene clustering in the pores of MOFs, a series of UiO-MOFs with the same topology but different pore sizes was prepared. The UiO-MOF films were synthesized by a vapor assisted conversion (VAC) method. The X-ray diffraction (XRD) data, Fig. 2a and Fig. S1, (ESI†) show that the MOF films have the targeted structures and high crystallinities. In addition, the XRD data show only the reflexes in (111) orientation, indicating that the MOF films are highly oriented. The size of the pore body and of the pore window of the UiO-series are given in Table 1.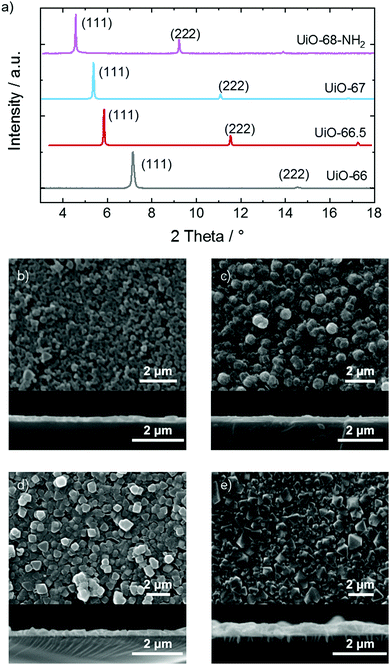 | ||
| Fig. 2 (a) XRD data of the samples. The observed diffraction peaks are labeled. The comparison with the calculated data of the targeted structures is shown in Fig. S1 (ESI†). SEM images of the (b) UiO-66, (c) UiO-66.5, (d) UiO-67 and (e) UiO-68-NH2 samples. A top-view SEM image is shown above and the cross-section of the broken sample is shown below. | ||
Scanning electron microscopy (SEM) images of the samples, Fig. 2b–e, show that the MOF films have a uniform morphology and the films are composed of many crystallites. The thicknesses of the films are estimated from the cross section images of the broken samples. The film thicknesses are approximately 0.2 μm, 0.3 μm, 0.2 μm and 0.4 μm for the UiO-66, UiO-66.5, UiO-67 and UiO-68-NH2 samples, respectively.
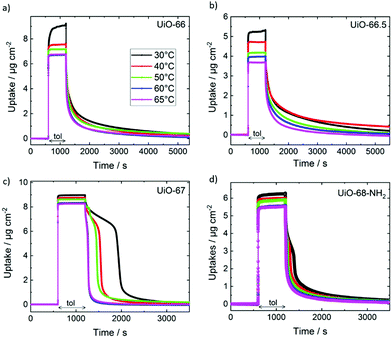
The adsorption and desorption of toluene in the different UiO MOF films were explored by transient uptake and release experiments at different temperatures using a QCM. The uptake and release curves of toluene in UiO-66, UiO-66.5, UiO-67 and UiO-68-NH2 are shown in Fig. 3. The uptake and release are fully reversible and repeating the experiments results in essentially the same uptake curves, Fig. S2 (ESI†). In all uptake curves, the toluene adsorption occurs very fast with uptake time constants of less than 0.2 s. A precise quantification of the time constant for the uptake is hampered by the sampling rate of the QCM, see Fig. S3 (ESI†). Based on the uptake time constant of less than 0.2 s and the film thicknesses, the lower limits of the diffusion coefficients in all MOF samples are estimated to be 0.6–2.6 × 10⁻¹³ m2 s−1. This is in agreement with measurements at low vapor pressures in UiO-66 powder samples.48 The fast uptake kinetics also indicate that defects like surface barriers44,49–52 have a minor influence. The absence of surface barriers was also expected, since the exposure of the freshly-prepared MOF samples to humid air was avoided.53
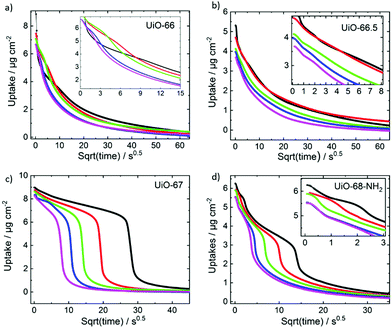
In contrast to the very fast uptakes, the release processes take about 100–1000 s. This is at least two to three orders of magnitude slower than the uptake process. Fig. 4 depicts the transient uptake amount of toluene during the release process as function of the square root of time. Generally, it can be seen that the release rate increases with the pore size, where the release from UiO-68-NH2 is the fastest and the release from UiO-66 is the slowest. Even more interesting, it is clearly visible that the toluene release from UiO-67 but also from UiO-68-NH2 are not continues. For UiO-67, above a loading of about 6 μg cm−2, the release is slow and then the release from 6 to about 1 μg cm−2 is fast, almost step like. For UiO-68-NH2, such steps seem to be at about 5.5 μg cm−2 (see zoom-in) and at 3 μg cm−2, however, it is less pronounced than in UiO-67.
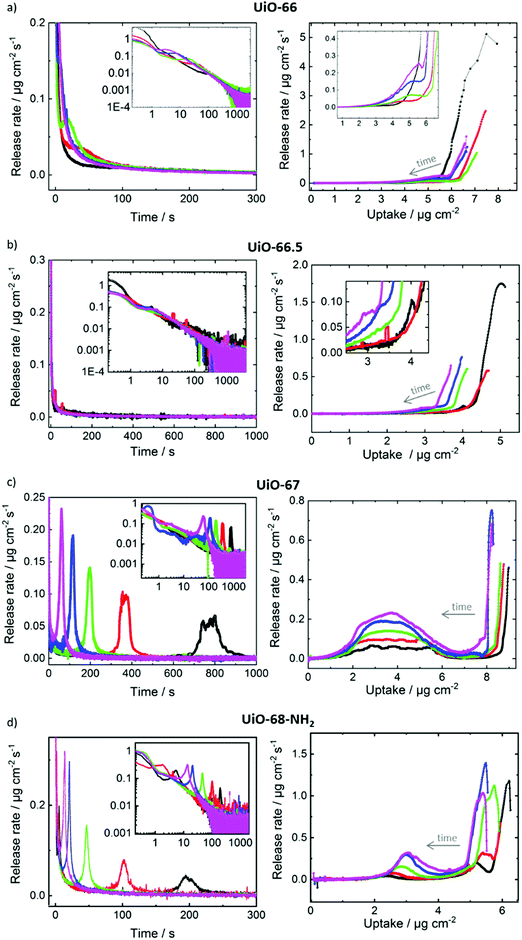
For gaining more insights in the release processes, the release rates, this means the time-derivative of the release, were determined. In Fig. 5, the release rates are plotted as function of time and as function of the uptake. For a system where the release is purely controlled by Fickian transport diffusion, the release rate should decrease during the release process with an essentially exponential decay function. In contrast, for UiO-67 and UiO-68-NH2, Fig. 5c and d, the release processes passes clear (local) maxima of the release rates. (For all release processes, the global maximum of the release rate is at the beginning of the release and the global minimum is at the end, where the MOF pores are empty.) For UiO-67, each release process has one maximum. After the release starts, the time at which the maximum release rate is reached decreases with increasing temperature. The maximum release rate is reached at approximately 800 s at 30 °C and at approximately 60 s at 65 °C. For UiO-68-NH2, the (main) maximum of the release is at 200 s at 30 °C and at 14 s for 65 °C. Moreover, the release from UiO-68-NH2 at temperatures of 30 °C, 40 °C and 50 °C shows another maximum at about 5 s, 1.8 s and 0.4 s, respectively. For the small pore MOFs, Fig. 5a and b, the release decreases essentially exponentially during the release process and only small deviations can be founds.
Plotting the release rates as function of the toluene loading shows that, for UiO-67, the (local) maxima and minima of the release rates are obtained at the same loadings for all temperatures, see right hand side in Fig. 5. The release rate shows a minimum at a loading of approximately 7 μg cm−2 and a maximum at approximately 4 μg cm−2. The release rate at the local maximum is approximately one order of magnitude larger than at the local minimum. This is remarkable, since the loadings at the minimum, and thus the concentration gradients driving the mass transfer, are larger than at the maximum. Higher temperatures result in higher release rates than lower temperatures, but the loadings at the maximum and minimum remain.
For UiO-68-NH2, a local maximum of the release rate at a loading of approximately 3 μg cm−2 and a minimum at approximately 4.5 μg cm−2 can be observed. The ratio of the rates at the local maximum and minimum is approximately a factor 5. A detailed inspection shows that the loading at the local maximum of the release rate slightly decreases from 3 μg cm−2 at 65 °C to 2.4 μg cm−2 at 30 °C. For UiO-66 and UiO-66.5, there are only small local maxima and minima of the release rate visible, significantly smaller than in UiO-67 and UiO-68-NH2. For example, the release from UiO-66 shows a small maximum of the release rate at a loading of roughly 5 μg cm−2.
The experiments were repeated with a second set of samples, Fig. S4 (ESI†). There, the same behavior was found, this means a very fast toluene uptake and a slow toluene release. For UiO-67, the same step-like release kinetics with local maxima and minima of the rates were found.
The maximum release rate from UiO-67 as function of the inverse temperature is shown in Fig. 6. The Arrhenius plot shows a linear behavior and an activation energy of approximately 33 ± 2 kJ mol−1. This is in very good agreement to density-functional-theory calculations, showing a binding energy of the toluene dimer of 7.48 kcal mol−1 (i.e. 31.3 kJ mol−1).35 The determined activation energy for the release is significantly larger than the activation energy for the toluene desorption at low loadings.54 There, the toluene was adsorbed at a vapor pressure of 1 mbar (instead of 30 mbar, here) and an activation energy for the toluene desorption of 8.8 kJ mol−1 was determined.54 Thus, we come to the conclusion that the step-like release of toluene from UiO-67 is caused by the break-up of the toluene dimers. This means, the release kinetics are controlled by the dimer-dissolution, rather than by molecular (Fickian) transport diffusion.
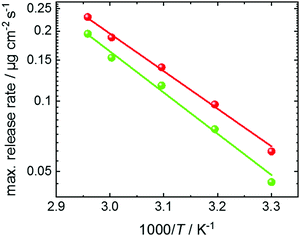 | ||
Fig. 6 Arrhenius plot of the maximum release rate of toluene from UiO-67. The maximum release rates are obtained from Fig. 5c at a loading of approximately 4 μg cm−2 (red data) and from Fig. S4b (ESI†) at a loading of approximately 2 μg cm−2 (green data). The red and green lines are the Arrhenius fits (∼exp![[thin space (1/6-em)]](https://www.rsc.org/images/entities/char_2009.gif) (EA/kBT) to the red and green data, giving an activation energy EA of 31.5 kJ mol−1 and 34.6 kJ mol−1, respectively, averaged to 33 ± 2 kJ mol−1. (EA/kBT) to the red and green data, giving an activation energy EA of 31.5 kJ mol−1 and 34.6 kJ mol−1, respectively, averaged to 33 ± 2 kJ mol−1. | ||
Reference experiments were performed for testing the suggested interpretation of the data. The uptake and release of toluene by a MOF film with ZIF-8 structure with small pores were explored, Fig. S5 (ESI†). ZIF-8 has a small pore aperture with a diameter of approximately 0.3–0.4 nm connecting pore bodies with a diameter of approximately 0.7 to 0.9 nm.55,56 The formation of toluene clusters is sterically hindered. There, the uptake and release happen with identical rate constants and no step-like release kinetics were observed, see Fig. S5 (ESI†).
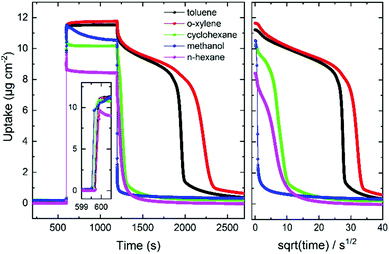
Further reference experiments were performed with UiO-67 MOF films and different guest molecules, Fig. 7 and Fig. S6 (ESI†). First, the plot shows that the toluene-clustering-phenomenon can only be observed, after the UiO-67 MOF pores are rinsed with ethanol, emptying the pores from remains from the synthesis. Second, the data show that the slow release with the step-like kinetics can be observed for toluene and o-xylene, but not for methanol. For cyclohexane and n-hexane, slight step-like release kinetics, much less pronounced than for the aromatic guest molecules, can be observed.
For determining the mass of the UiO-67-MOF film, the MOF film is dissolved after the uptake and release experiments, Fig. S7 (ESI†). There, the mass density of the MOF film was estimated to be 14.4 μg cm−2. Please note, the quantification of the MOF mass during the synthesis, as possible for MOF films made in a layer-by-layer fashion,44 is not possible for the UiO-MOF films made by VAC. Based on the estimated MOF mass, the minimum release rate (at about 7 μg cm−2) corresponds to about 11 molecules per unit cell. Each UiO unit cell contains 4 large octahedral pores and 4 somewhat smaller tetrahedral pores. Thus, the minimum release rate occurs at an average loading of 2.75 molecules per one large and small pore. This supports the assumption that the minimum of the release is reached for a (stable) dimer in the large pores, which is sketched in Fig. S8, (ESI†) and a few further monomers in other parts of the pore system, like in the small tetrahedral pores. After the dimer dissolves, the release is substantially accelerated, as observed.
The large octahedral pores as well as the small tetrahedral pores of UiO-68-NH2 are large enough for containing toluene clusters with 2 and more molecules. We believe this results in a more complex interaction than in UiO-67, where the formation of clusters larger than dimers is sterically hindered. In the small pore MOFs, the cluster formation seems sterically hindered in the perfect pore, see pore sizes in Table 1 and cluster diameters in Fig. 1. We suppose toluene clusters might form at defect pores or more complex interaction, where the shape and orientation of the molecular cluster and pore is crucial, contribute. The MOF films were used in the pristine form and no significant amounts of defects were previously found for such pristine UiO-MOF films.53 Thus, we assume that defects have a minor impact. Since the MOFs of the UiO-series are chemically similar but have different pore sizes, the cluster formation in the different MOFs is most likely controlled by steric effects, this means by the pore size. For UiO-66, it was shown by infrared spectroscopy supported by density functional theory calculations that toluene forms strong hydrogen bonds to the host MOF.48
We like to note that, since no data for the adsorption isotherm of toluene in UiO-67 was found, the correlation of the observed clustering phenomenon with the thermodynamic factor was not possible.27
We like to stress that the observed phenomenon of the asymmetric uptake and release kinetics, where the release is a few orders of magnitude slower than the uptake, cannot be explained by one concentration-dependent diffusion coefficient describing both, the uptake and the release process. One concentration-dependent diffusion coefficient may result in mass transfer processes where the uptake and release have somewhat different rates, but the ratio is usually significantly smaller than one order of magnitude.21,57,58 Moreover, the asymmetry of the time constants of the uptake and the release can also not be explained by defects like surface barriers in the MOF material.43,59–61 Recent theoretical studies showed that the kinetics of surface-barriers-dominated uptake and release kinetics have identical rates.50
4 Conclusions
The uptake and release of toluene was experimentally studied in a series of UiO-MOF films of UiO-66, −66.5, −67 and −68-NH2 structures. The uptake processes in all MOF films are completed in less than one second, indicating fast diffusion. On the other hand, the release processes are tremendously slower. For UiO-67, the release shows a step-like kinetics, where the dissolving of the toluene dimers in the pores slows down the release. The activation energy of the release rate determined from temperature-dependent experiments is in agreement with the binding energy of the toluene dimer. For UiO-68-NH2, the release also shows a step-like kinetic and, based on the large pore size, the formation of larger clusters is possible. For the small pore MOFs, UiO-66 and UiO-66.5, where the dimer formation is sterically hindered by the perfect pore size, only small deviations from a (plain) continuous release kinetics was found. Reference experiments with different guest molecules and with a small-pore MOF support the interpretation that the cluster, here dimer, formation based on the aromatic guest–guest interaction in the pores of sufficient size are the reason for the slow, step-like release from UiO-67.The study shows that the intermolecular interaction has a substantial impact on the release kinetics. The exploration of only the uptake kinetics is not sufficient to unveil the details of the mass transfer of the guest molecules in the pores. The release also needs to be explored for a deeper understanding.
Author contributions
C. L. performed the MOF synthesis and experiments; Z. Z. recorded the SEM images. L. H. designed the project. C. L and L. H wrote the manuscript, approved by all authors.Conflicts of interest
There are no conflicts to declare.Acknowledgements
This research was funded by the German Research Foundation (DFG HE 7036/5) and by the China Scholarship Council (CSC). We thank Abhinav Chandresh (IFG/KIT) for the help measuring the SEM images.References
- H. Furukawa, K. E. Cordova, M. O’Keeffe and O. M. Yaghi, Science, 2013, 341, 1230444 CrossRef PubMed.
- J. R. Li, J. Sculley and H. C. Zhou, Chem. Rev., 2012, 112, 869–932 CrossRef CAS PubMed.
- H. C. Zhou, J. R. Long and O. M. Yaghi, Chem. Rev., 2012, 112, 673–674 CrossRef CAS PubMed.
- J. Caro, Curr. Opin. Chem. Eng., 2011, 1, 77–83 CrossRef CAS.
- S. Okur, P. Qin, A. Chandresh, C. Li, Z. Zhang, U. Lemmer and L. Heinke, Angew. Chem., Int. Ed., 2021, 60, 3566–3571 CrossRef CAS PubMed.
- I. Stassen, N. C. Burtch, A. A. Talin, P. Falcaro, M. D. Allendorf and R. Ameloot, Chem. Soc. Rev., 2017, 46, 3853 RSC.
- V. Bon, E. Brunner, A. Poppl and S. Kaskel, Adv. Funct. Mater., 2020, 30, 32 Search PubMed.
- J. Kärger, D. M. Ruthven and D. N. Theodorou, Diffusion in Nanoporous Materials, Wiley-VCH, 2012 Search PubMed.
- L. Heinke and C. Wöll, Adv. Mater., 2019, 31, 1806324 CrossRef PubMed.
- N. Rangnekar, N. Mittal, B. Elyassi, J. Caro and M. Tsapatsis, Chem. Soc. Rev., 2015, 44, 7128–7154 RSC.
- T. Titze, C. Chmelik, J. Kullmann, L. Prager, E. Miersemann, R. Glaeser, D. Enke, J. Weitkamp and J. Kärger, Angew. Chem., Int. Ed., 2015, 54, 5060–5064 CrossRef CAS PubMed.
- C. Chmelik, H. Bux, H. Voss and J. Caro, Chem. Ing. Tech., 2011, 83, 104–112 CrossRef CAS.
- F. Salles, H. Jobic, G. Maurin, M. M. Koza, P. L. Llewellyn, T. Devic, C. Serre and G. Ferey, Phys. Rev. Lett., 2008, 100, 245901 CrossRef CAS PubMed.
- C. Y. Lee, Y. S. Bae, N. C. Jeong, O. K. Farha, A. A. Sarjeant, C. L. Stern, P. Nickias, R. Q. Snurr, J. T. Hupp and S. T. Nguyen, J. Am. Chem. Soc., 2011, 133, 5228–5231 CrossRef CAS PubMed.
- E. Haldoupis, T. Watanabe, S. Nair and D. S. Sholl, ChemPhysChem, 2012, 13, 3449–3452 CrossRef CAS PubMed.
- T. Titze, A. Lauerer, L. Heinke, C. Chmelik, N. E. Zimmermann, F. J. Keil, D. M. Ruthven and J. Kärger, Angew. Chem., Int. Ed., 2015, 54, 14580–14583 CrossRef CAS PubMed.
- D. C. Ford, D. Dubbeldam, R. Q. Snurr, V. Kunzel, M. Wehring, F. Stallmach, J. Kärger and U. Müller, J. Phys. Chem. Lett., 2012, 3, 930–933 CrossRef CAS PubMed.
- C. Chmelik and J. Kaerger, Adsorption, 2010, 16, 515–523 CrossRef CAS.
- D. A. Reed and G. Ehrlich, Surf. Sci., 1981, 102, 588–609 CrossRef CAS.
- R. Krishna, D. Paschek and R. Baur, Microporous Mesoporous Mater., 2004, 76, 233–246 CrossRef CAS.
- L. Heinke, D. Tzoulaki, C. Chmelik, F. Hibbe, J. M. van Baten, H. Lim, J. Li, R. Krishna and J. Kärger, Phys. Rev. Lett., 2009, 102, 065901 CrossRef PubMed.
- C. Chmelik, F. Hibbe, D. Tzoulaki, L. Heinke, J. Caro, J. Li and J. Kärger, Microporous Mesoporous Mater., 2010, 129, 340–344 CrossRef CAS.
- B. C. Bukowski, F. J. Keil, P. I. Ravikovitch, G. Sastre, R. Q. Snurr and M.-O. Coppens, Adsorption, 2021, 27, 683–760 CrossRef CAS.
- D. S. Sholl, Chem. Phys. Lett., 1999, 305, 269–275 CrossRef CAS.
- J. J. Gutierrez-Sevillano, S. Calero and R. Krishna, Phys. Chem. Chem. Phys., 2015, 17, 20114–20124 RSC.
- R. Krishna and J. M. van Baten, Langmuir, 2010, 26, 3981–3992 CrossRef CAS PubMed.
- R. Krishna and J. M. van Baten, Langmuir, 2010, 26, 8450–8463 CrossRef CAS PubMed.
- A. Ghysels, M. Vandichel, T. Verstraelen, M. A. van der Veen, D. E. De Vos, M. Waroquier and V. Van Speybroeck, Theor. Chem. Acc., 2012, 131, 1234 Search PubMed.
- M. Tsotsalas, P. Hejcik, K. Sumida, Z. Kalay, S. Furukawa and S. Kitagawa, J. Am. Chem. Soc., 2013, 135, 4608–4611 CrossRef CAS PubMed.
- R. Laatikainen, J. Ratilainen, R. Sebastian and H. Santa, J. Am. Chem. Soc., 2002, 117, 11006–11010 CrossRef.
- D. M. Rogers, J. D. Hirst, E. P. F. Lee and T. G. Wright, Chem. Phys. Lett., 2006, 427, 410–413 CrossRef CAS.
- K. Law, M. Schauer and E. R. Bernstein, J. Chem. Phys., 1984, 81, 4871–4882 CrossRef CAS.
- A. Musgrave and T. G. Wright, J. Chem. Phys., 2005, 122, 074312 CrossRef PubMed.
- F. L. Gervasio, R. Chelli, P. Procacci and V. Schettino, J. Phys. Chem. A, 2002, 106, 2945–2948 CrossRef CAS.
- T. M. D. Palma, A. Bende and A. Borghese, Chem. Phys. Lett., 2010, 495, 17–23 CrossRef.
- S. Chakrabarty, J. J. Ferreiro, M. Lippe and R. Signorell, J. Phys. Chem. A, 2017, 121, 3991–4001 CrossRef CAS PubMed.
- J. H. Cavka, S. Jakobsen, U. Olsbye, N. Guillou, C. Lamberti, S. Bordiga and K. P. Lillerud, J. Am. Chem. Soc., 2008, 130, 13850–13851 CrossRef PubMed.
- V. Bon, I. Senkovska, M. S. Weiss and S. Kaskel, CrystEngComm, 2013, 15, 9572–9577 RSC.
- E. Virmani, J. M. Rotter, A. Mahringer, T. von Zons, A. Godt, T. Bein, S. Wuttke and D. D. Medina, J. Am. Chem. Soc., 2018, 140, 4812–4819 CrossRef CAS PubMed.
- G. Sauerbrey, Z. Phys., 1959, 155, 206–222 CrossRef CAS.
- D. Johannsmann, The quartz crystal microbalance in soft matter research 2015.
- L. Heinke, J. Phys. D: Appl. Phys., 2017, 50, 193004 CrossRef.
- K. Müller, N. Vankova, L. Schottner, T. Heine and L. Heinke, Chem. Sci., 2019, 10, 153–160 RSC.
- L. Heinke, Z. Gu and C. Wöll, Nat. Commun., 2014, 5, 4562 CrossRef CAS PubMed.
- G. Ayoub, T. Islamoglu, S. Goswami, T. Friščić and O. K. Farha, ACS Appl. Mater. Interfaces, 2019, 11, 15788–15794 CrossRef CAS PubMed.
- S. Friebe, B. Geppert, F. Steinbach and J. Caro, ACS Appl. Mater. Interfaces, 2017, 9, 12878–12885 CrossRef CAS PubMed.
- X. Ye and D. Liu, Cryst. Growth Des., 2021, 21, 4780–4804 CrossRef CAS.
- T. G. Grissom, C. H. Sharp, P. M. Usov, D. Troya, A. J. Morris and J. R. Morris, J. Phys. Chem. C, 2018, 122, 16060–16069 CrossRef CAS.
- F. A. Son, B. C. Bukowski, T. Islamoglu, R. Q. Snurr and O. K. Farha, Chem. Mater., 2021, 33, 9093–9100 CrossRef CAS.
- G. Sastre, J. Kärger and D. M. Ruthven, J. Phys. Chem. C, 2019, 123, 19596–19601 CrossRef CAS.
- L. Heinke and J. Karger, Phys. Rev. Lett., 2011, 106, 074501 CrossRef PubMed.
- J. Kärger, M. Bülow, G. R. Millward and J. M. Thomas, Zeolites, 1986, 6, 146–150 CrossRef.
- C. Li, A. Chandresh, Z. Zhang, S. Moulai and L. Heinke, Adv. Mater. Interfaces, 2022, 9, 2101947 CrossRef CAS.
- X. Zhang, X. Shi, Q. Zhao, Y. Li, J. Wang, Y. Yang, F. Bi, J. Xu and N. Liu, Chem. Eng. J., 2022, 427, 131573 CrossRef CAS.
- S. S. Mondal, M. Hovestadt, S. Dey, C. Paula, S. Glomb, A. Kelling, U. Schilde, C. Janiak, M. Hartmann and H.-J. Holdt, CrystEngComm, 2017, 19, 5882–5891 RSC.
- R. Bose, J. Ethiraj, P. Sridhar, J. J. Varghese, N. S. Kaisare and P. Selvam, Adsorption, 2020, 26, 1027–1038 CrossRef CAS.
- L. Heinke, P. Kortunov, D. Tzoulaki and J. Kärger, Adsorption, 2007, 13, 215–223 CrossRef CAS.
- L. Heinke, Analytische Betrachtungen und IR-Experimente zum Sorptionsverhalten nanoporöser Materialien, Diploma thesis, University Leipzig, 2006 Search PubMed.
- L. Heinke, P. Kortunov, D. Tzoulaki and J. Kärger, Phys. Rev. Lett., 2007, 99, 249902 CrossRef.
- J. Kärger, Microporous Mesoporous Mater., 2014, 189, 126–135 CrossRef.
- N. E. R. Zimmermann, S. P. Balaji and F. J. Keil, J. Phys. Chem. C, 2012, 116, 3677–3683 CrossRef CAS.
Footnote |
| † Electronic supplementary information (ESI) available. See DOI: 10.1039/d1cp05560g |
| This journal is © the Owner Societies 2022 |

