 Open Access Article
Creative Commons Attribution 3.0 Unported Licence
UV resonance Raman spectroscopy of weakly hydrogen-bonded water in the liquid phase and on ice and snow surfaces
Ettore
Maggiore
 a,
Mariagrazia
Tortora
 bc,
Barbara
Rossi
 c,
Matteo
Tommasini
 a and
Paolo Maria
Ossi
 *d
*d
aDipartimento di Chimica, Materiali e Ingegneria Chimica “G. Natta”, Politecnico di Milano, 20133 Milano, Italy
bArea Science Park, Padriciano, 99, 34149 Trieste, Italy
cElettra Sincrotrone Trieste, S.S. 114 km 163.5, Basovizza, 34149 Trieste, Italy
dDipartimento di Energia, Politecnico di Milano, 20133 Milano, Italy. E-mail: paolo.ossi@polimi.it
First published on 14th April 2022
Abstract
The hydrogen bond network has a major role in determining the physical and chemical properties of water both in the solid and in the liquid state. In the bulk liquid phase, there is a coexistence of water molecules with different degrees of coordination and their relative amount changes according to the conditions (e.g., temperature, presence of solutes). Ice shows a larger amount of topologically under-coordinated water molecules at the surface as compared to the bulk. Snow is composed of many ice crystallites, and it differs from bulk ice because of the much larger specific surface area. The OH-stretching band is the most intense signal of the Raman spectrum of water, and it gives direct insight about the hydrogen bond network. In this work we compared the OH-stretching region of the Raman spectra of water, ice and snow acquired with excitations in the visible (532 nm) and in the UV-C range (250–200 nm) by exploiting the tunability of the synchrotron radiation. By moving towards the highest energy excitation we observed in liquid water a monotonic increase of the relative intensities of the peaks associated with weakly hydrogen-bonded water molecules. With visible excitation, the Raman spectrum of snow displays a larger contribution from weakly hydrogen-bonded water molecules at the surfaces when compared to the spectrum of bulk ice. By using excitation sources in the UV-C range, we observe a further enhancement of the contribution of the surfaces in the spectra of snow. By considering the reported changes of the water absorption coefficient in relation to the hydrogen bonding environment, we interpreted our results as a preferential pre-resonance excitation of weakly hydrogen-bonded water molecules induced by the UV-C sources.
Introduction
Snow is a porous composite material, made up of water molecules. A specific feature of snow is the high value of the specific surface area, which significantly affects both its mechanical (compactness, hardness) and optical properties (albedo1). In nature, the freshly deposited snow grains spontaneously aggregate over time under the effect of the environmental parameters (i.e., temperature gradients;2 pressure exerted by the uppermost layers3 and presence of liquid water4). Under these conditions, in the long run, snow undergoes a morphological modification which ultimately converts it into bulk ice, which is characterized by the minimum value of the specific surface area.The study of the surface properties of snow, and more generally of ice, is relevant in many sectors, such as tribology5 or photochemistry.6 We have recently observed that the Raman spectra of snow and ice have different characteristics.7 We have attributed such differences to the greater weight of the contribution from the surfaces in the Raman spectra of snow. On the ice surface the water molecules are less closely linked to each other than those in the bulk, and they form a quasi-liquid layer, which is composed by water molecules spatially arranged in a disordered way that approaches the arrangement found in liquid water.8 Although several interpretations of the Raman spectrum of ice have been proposed for the OH-stretching region (the most intense part of the spectrum, in the range 2800–3800 cm−1),9,10 it is generally accepted that the dominant contribution assigned to the maximum of the OH stretching band arises from strongly hydrogen bonded (H-bonded) water molecules, whereas the tail observed at high wave numbers (>3300 cm−1) is due to weakly H-bonded water molecules.11–13 Furthermore, it has been proposed14 that on the surface of the ice there is a relevant fraction of water molecules (50%) that have one free OH bond: such molecules, given that they are connected to the bulk through chains of hydrogen bonds, may cause distortion of the crystal lattice even in the bulk, as evidenced by molecular dynamics simulations.14
By following the interpretation given by Sun,15 the OH-stretching band of liquid water is composed by the sum of the contributions given by the symmetrical stretching of water molecules coordinated with each other in different ways. Based on the number and type (donor “D”; acceptor “A”) of hydrogen bonds that a water molecule establishes with the water molecules surrounding it, there are five different local configurations that are used to carry out the deconvolution of the OH-stretching band. Such configurations are the double donor double acceptor (DDAA), the single donor double acceptor (DAA), the single donor single acceptor (DA), the double donor single acceptor (DDA), and the free OH. The OH-stretching band in the lower wavenumber region is attributed to water molecules more strongly H-bonded (DAA, DDAA), whereas the higher wavenumber region is attributed to water molecules less strongly bonded (DDA, DA, free OH) in which at least one of the two protons is not involved in a hydrogen bond.15
Therefore, it appears evident that the topologically sub-coordinated surface water molecules play a fundamental role in defining the physical–chemical properties of ice, and primarily the spectroscopic ones. In our experiments,7,16 we systematically observed that the Raman spectra of snow, collected in the visible (532 nm), have a higher relative intensity in the region around 3400 cm−1 than the Raman spectra of bulk ice. We observed that this difference depends on the specific surface area of the type of snow considered, and we concluded that the contribution from surface water molecules is significant also in the Raman spectrum of snow.
Based on these results, we wondered if it was possible to deepen the spectroscopic study of weakly H-bonded water both in the liquid and in the solid phase (ice, snow). The resonance Raman technique offers a unique tool for analyzing in detail contributions from different regions of the Raman spectrum of a material. Using a synchrotron source, which allows to accurately select the wavelength of the exciting radiation over a wide range of wavelengths, the potential of the technique is maximized. We therefore investigated the possibility of obtaining a selective increase of the individual components in the Raman spectrum of liquid water by using sources in the UV-C range (250 nm–200 nm, available at the Elettra synchrotron radiation facility). This is because in UV-C the absorption coefficient of water increases as the wavelength decreases, until it reaches a maximum at around 166 nm (7.45 eV, gas phase) that is assigned to the Ã1B1 ← ![[X with combining tilde]](https://www.rsc.org/images/entities/i_char_0058_0303.gif) 1A1 electronic transition of water.17 At this wavelength the photo-dissociation of the water molecule is observed (which would significantly interfere with Raman measurements). However, in the range of our UV Raman experiments (250–200 nm) we are far enough from the absorption peak. Nevertheless, since in this region the absorption coefficient progressively increases for decreasing wavelength,18 pre-resonance effects may become evident. Interestingly, similar effects have been reported for Raman spectra of liquid water acquired in the visible range, using laser sources between 458 nm and 647 nm.19 The authors observed that for increasing excitation wavelength the relative Raman intensity increases in the region around 3200 cm−1, which is attributed to fully coordinated water clusters (DDAA). In the present work, thanks to the wide choice of UV excitations provided by the synchrotron source, we could observe pre-resonance effects in the Raman spectra of liquid water, notably with excitation at 200 nm. By using the same UV-C sources, we could also collect the UV Raman spectra of bulk ice and fresh snow with a high value of the specific surface area. By inspecting the trend of the relative intensities of the different components of the OH-stretching band we could highlight the role of the contributions in the Raman spectra arising from weakly H-bonded water molecules on the surface of ice and snow.
1A1 electronic transition of water.17 At this wavelength the photo-dissociation of the water molecule is observed (which would significantly interfere with Raman measurements). However, in the range of our UV Raman experiments (250–200 nm) we are far enough from the absorption peak. Nevertheless, since in this region the absorption coefficient progressively increases for decreasing wavelength,18 pre-resonance effects may become evident. Interestingly, similar effects have been reported for Raman spectra of liquid water acquired in the visible range, using laser sources between 458 nm and 647 nm.19 The authors observed that for increasing excitation wavelength the relative Raman intensity increases in the region around 3200 cm−1, which is attributed to fully coordinated water clusters (DDAA). In the present work, thanks to the wide choice of UV excitations provided by the synchrotron source, we could observe pre-resonance effects in the Raman spectra of liquid water, notably with excitation at 200 nm. By using the same UV-C sources, we could also collect the UV Raman spectra of bulk ice and fresh snow with a high value of the specific surface area. By inspecting the trend of the relative intensities of the different components of the OH-stretching band we could highlight the role of the contributions in the Raman spectra arising from weakly H-bonded water molecules on the surface of ice and snow.
Experimental
We prepared a batch of natural-like snow (NLS) from distilled water, by adopting the procedure described in.16 Before the Raman measurements we store the NLS batch for ten days inside a commercial freezer at a temperature −15 °C. After this period, the average particle size was 0.2 mm and the mass density 280 kg m−3. We used Milli-Q water to collect the Raman spectra of liquid water. We prepared the ice sample by placing inside the freezer at −20 °C a suprasil-quartz cuvette partially filled with Milli-Q water and waiting for the complete freezing of the water volume.To record the spectra excited with 532 nm laser we used a portable Raman equipment (produced by BW&TEK) that consist of a spectrometer (Exemplar Plus), a laser unit (BWF2) and a Raman probe (BAC102) that operates in backscattering configuration. The focal plane is located at 5.4 mm from the probe and the diameter of the laser spot at the focal plane is 85 μm. The spectrometer has a wavelength range between 532 nm and 680 nm, a slit width of 10 μm, a diffraction grating of 1800 lines mm−1, and a resolution of 2 cm−1. The laser emits at 532 nm with a line width of 0.046 nm and a maximum power of 51.7 mW. We acquired with this equipment the Raman spectra of ice and NLS at −6 °C, and the Raman spectrum of liquid water at 27 °C, using for the three cases 50 mW of laser power and 45 s of acquisition time.
We collected multi-wavelength UV Resonance Raman spectra at the BL10.2-IUVS beamline of Elettra Sincrotrone Trieste (Italy) by exploiting the experimental setup described in detail in.20 The excitation wavelengths at 250, 226 and 200 nm were provided by the synchrotron radiation source (SR). We set the energy of each excitation radiation by regulating the undulator gap aperture and using a Czerny–Turner monochromator (Acton SP2750, focal length 750 mm, Princeton Instruments, Acton, MA, USA) equipped with a holographic grating with 3600 lines mm−1 for monochromatizing the incoming SR. We used an excitation radiation at 213 nm provided by a CryLas FQSS213-Q3 Diode Pumped Passively Q-Switched Solid-State Laser. We collected the UV Raman spectra in back-scattered geometry, by a single pass of a Czerny–Turner spectrometer of 750 mm focal length equipped with holographic gratings at 1800 lines mm−1 and 3600 lines mm−1. We set the resolution at different values, depending on the excitation wavelength, i.e., 2.9, 2.3 and 1.9 cm−1 pixel−1 at 200, 226 and 250 nm of excitation wavelength, respectively, and 1.3 cm−1 pixel−1 at 213 nm. We standardized the calibration of the spectrometer by using cyclohexane (spectroscopic grade, Sigma Aldrich). We kept the final radiation power on the surface sample between a few up to tens of μW, depending on the excitation source. The spot area was typically about 1 mm2. In this condition the heating of the samples due to the absorption of the excitation radiation is practically negligible. Indeed, the comparison among the individual spectral scans collected for each sample did not evidence any variation, associated with the heating (or with the melting in case of snow and ice), of the spectra with respect to the accumulation number. Before spectra acquisitions, we rapidly transfer the samples of NLS and ice in suitable suprasil-quartz cuvettes with optical path of 10 mm for UVRR measurements. During the UVRR measurements the temperature of the NLS and ice samples was controlled using a sample holder equipped with a thermal bath coupled to a resistive heating system to keep the temperature of the sample at a fixed value of −6 °C with a stability of ±0.1 C. We kept a constant flux of gaseous nitrogen on the sample cells during the measurements to prevent the freezing of atmospheric water vapor on the cuvette window. We collected all the UV Raman spectra of liquid water at environmental temperature (27 °C).
We removed the spikes and corrected the baseline of all the spectra. For data analysis purposes, we normalized the Raman spectra of liquid water by imposing as unitary the area in the region between 2800 cm−1 and 3800 cm−1. Instead, by following the same approach discussed in7 we normalized the spectra of ice and NLS to their strongest peak in the OH-stretching band (∼3150 cm−1).
We performed the deconvolution of the normalized water spectra in the region between 2800 cm−1 and 3800 cm−1 using the Peak Analyzer function of the Origin software.21 By taking up the interpretation of the OH-stretching band given by,15 we performed the deconvolution of the band using five Gaussian functions centered at peak 1![[thin space (1/6-em)]](https://www.rsc.org/images/entities/char_2009.gif) :
:![[thin space (1/6-em)]](https://www.rsc.org/images/entities/char_2009.gif) 3005 ± 10 cm−1; peak 2
3005 ± 10 cm−1; peak 2![[thin space (1/6-em)]](https://www.rsc.org/images/entities/char_2009.gif) :
:![[thin space (1/6-em)]](https://www.rsc.org/images/entities/char_2009.gif) 3213 ± 7 cm−1; peak 3
3213 ± 7 cm−1; peak 3![[thin space (1/6-em)]](https://www.rsc.org/images/entities/char_2009.gif) :
:![[thin space (1/6-em)]](https://www.rsc.org/images/entities/char_2009.gif) 3412 ± 10 cm−1; peak 4
3412 ± 10 cm−1; peak 4![[thin space (1/6-em)]](https://www.rsc.org/images/entities/char_2009.gif) :
:![[thin space (1/6-em)]](https://www.rsc.org/images/entities/char_2009.gif) 3552 ± 10 cm−1; peak 5
3552 ± 10 cm−1; peak 5![[thin space (1/6-em)]](https://www.rsc.org/images/entities/char_2009.gif) :
:![[thin space (1/6-em)]](https://www.rsc.org/images/entities/char_2009.gif) 3616 ± 10 cm−1 (see Fig. 3 for a representative example). From the different fits, we obtained the intensity of each peak by integrating the area of the associated Gaussian function.
3616 ± 10 cm−1 (see Fig. 3 for a representative example). From the different fits, we obtained the intensity of each peak by integrating the area of the associated Gaussian function.
Finally, we obtained the ratio (R) between the sum of the intensity of the peaks belonging to weakly H-bonded water molecules (peaks 3, 4 and 5) and that of the peaks associated with strongly H-bonded water molecules (peaks 1 and 2) in a similar way as the recent work by Mael et al.22 The R ratio is defined as follows:
 | (1) |
Results
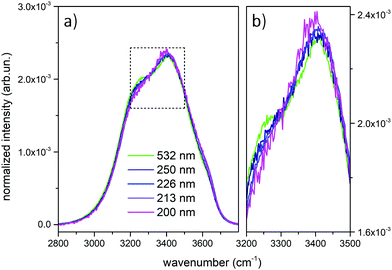
Fig. 1 shows the comparison across the Raman spectra of liquid water recorded using the different excitations considered in this work. To allow comparing the changes in the band shape as a function of the excitation the spectra in Fig. 1 have been normalized to unit area over the OH stretching band. Clearly, the relative intensities of the spectra reported in Fig. 1 show differences that depend in a systematic way on the excitation wavelength, with an isosbestic point approximately located near 3300 cm−1. To better highlight such differences, which are expected to arise because of the pre-resonance effects illustrated in the Introduction, we display in Fig. 2 the difference of the spectra recorded with UV excitation (pre-resonance conditions) with respect to the spectrum recorded with 532 nm (off resonance conditions).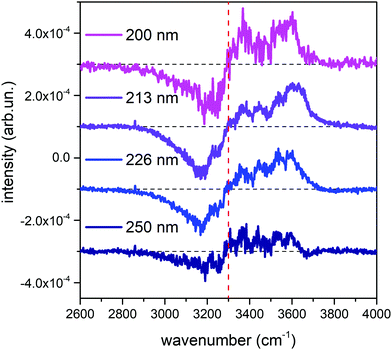 | ||
| Fig. 2 Difference between the normalized UV Raman spectra of liquid water represented in Fig. 1 and the normalized Raman spectrum obtained with the 532 nm excitation. For ease of reading, the curves have been vertically offset by a constant value, and the position of the isosbestic point has been indicated with a dashed red vertical line. | ||
As the excitation energy increases towards resonance (i.e., by moving from 250 nm to 200 nm), the spectral differences reported in Fig. 2 straightforwardly show increasing intensities for wavenumbers (ω) higher than the position of the isosbestic point, which is close to 3300 cm−1. We also observe that for ω < 3300 cm−1 the UV Raman spectra have a lower intensity than the Raman spectrum excited at 532 nm (negative spectral difference). Such differences steadily become more evident as the excitation wavelength decreases. This is particularly evident in the region of the spectrum nearby 3600 cm−1 (Fig. 2), where the Raman intensity increases as the wavelength decreases, notably at 226 nm (blue curve) and 213 nm (purple curve). The opposite happens nearby 3200 cm−1, where we observe decreasing Raman intensities for decreasing excitation wavelengths.
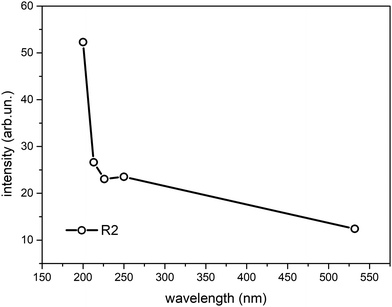
To better quantify the enhancement of the signals from weakly H-bonded water molecules caused by the UV excitation in pre-resonance conditions we compare the Raman contributions from weakly H-bonded to those from strongly H-bonded water molecules (see eqn (1)). In Fig. 3 we report the plot of the wavelength dependence of the R(λ) intensity ratio. The different contributions to the overall band shape of the OH stretching band are determined by Gaussian band deconvolution, as described by the inset of Fig. 3 that shows the results of such fitting procedure for the experimental Raman data recorded at 532 nm. The parameters of the five Gaussian components are reported in Table 1 and indicate that the Raman spectra can be described by two intense peaks (peaks 2 and 3, centered at 3219 cm−1 and 3422 cm−1 for the 532 nm excitation) with higher relative intensity than the other three components (peaks 1,4,5). The good quality of the Gaussian fits in representing the experimental Raman data is confirmed also for the spectra acquired with UV excitation (not shown). Clearly, the R value increases as the excitation wavelength decreases (Fig. 3). This is equivalent to stating that the intensity fraction of the OH-stretching band arising from weakly H-bonded water molecules gradually increases with respect to the contribution arising from strongly H-bonded water molecules. The intensities that contribute most to the variations in R(λ) are those of peaks 2 and 3 that are located respectively at lower and higher wavenumber than the isosbestic point of Fig. 2 (3300 cm−1).
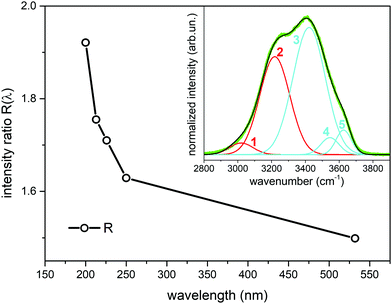 | ||
| Fig. 3 Ratio R(λ) between the Raman intensity of weakly H-bonded water molecules (peaks 3,4,5) and the Raman intensity of strongly H-bonded water molecules (peaks 1, 2) (eqn (1)) as a function of the excitation wavelength. The data have been obtained from Gaussian band deconvolution of the spectra of liquid water reported in Fig. 1. The inset shows the fitting (black line) of the experimental Raman data (green line) recorded with 532 nm excitation. The red and cyan lines in the inset represent the five Gaussian components associated to differently H-bonded water molecules. | ||
| Mode | Frequency (cm−1) | FWHM (cm−1) | Intensity (arb. un.) |
|---|---|---|---|
| Peak 1 | 3020 | 165 | 0.034 |
| Peak 2 | 3219 | 209 | 0.367 |
| Peak 3 | 3422 | 226 | 0.516 |
| Peak 4 | 3545 | 127 | 0.039 |
| Peak 5 | 3626 | 106 | 0.047 |
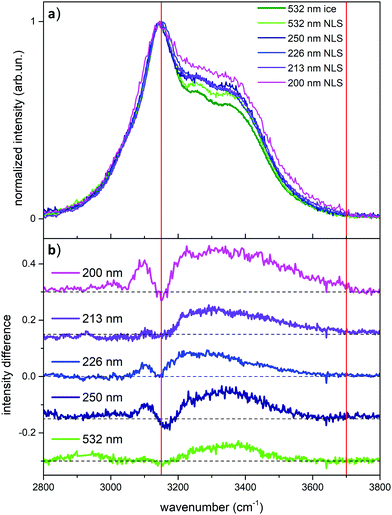
After the analysis of the behavior of liquid water probed by UV Raman, which highlights the role of weakly H-bonded water molecules when approaching pre-resonance conditions, we turn now to the UV Raman investigation of ice and snow. In Fig. 4 we report the comparison between the Raman spectrum of ice (acquired at 532 nm) and the Raman spectra of NLS recorded at the different excitation wavelengths considered in this work.
We observe in Fig. 4 strong differences in relative Raman intensity among the different spectra. If one starts by considering the Raman spectra of ice and NLS acquired at 532 nm (dark and light green traces in Fig. 4), it is evident that the spectrum of NLS differs from that of ice due to the greater relative intensity of the two shoulders located at about 3250 cm−1 and 3350 cm−1. By considering now the Raman spectra of NLS recorded with UV excitations, we notice that, at the location of the same shoulders, such differences are enhanced by the UV excitation and reach a maximum at 200 nm. This behavior of the Raman spectra is clearly testified in Fig. 4a by the curves obtained by subtracting from the snow spectra recorded at the different excitation wavelengths the Raman spectrum of ice recorded at 532 nm. To better quantify such excitation-dependent intensity differences in the Raman spectra of NLS with respect to the Raman spectrum of ice, we introduce the following integral, which we carry out in the high wave number region (ωa = 3150 cm−1, ωb = 3700 cm−1) of the OH-stretching band:
 | (2) |
Discussion
To better discuss the results presented above, it is useful to illustrate the behavior of the molar absorption coefficient of water as a function of the wavelength, ε(λ). Liquid water displays a minimum of the absorption coefficient in the region between the visible and the near UV (350 nm–450 nm); ε(λ) significantly increases by moving to the red portion of the visible spectrum and to the infrared, and it is also increasing by moving from visible to ultraviolet wavelengths.23 We report in Fig. 6 the molar extinction coefficient of liquid water at different temperatures in the VUV region, taken from ref. 18.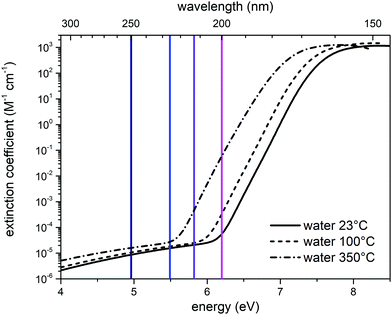 | ||
| Fig. 6 Molar extinction coefficient of liquid water in the UV-C region, as a function of temperature: 23 °C (solid black curve), 100 °C (dashed black curve), 350 °C (dash-dot line). The three curves were interpolated by using eqn (1) of ref. 18. The vertical lines represent the excitation wavelengths at which we recorded the UV Raman spectra of liquid water (deep blue: 250 nm; blue: 226 nm; purple: 213 nm; magenta: 200 nm). | ||
The value of the water absorption coefficient in the UV-C region is strictly dependent on the status of the hydrogen bond network.18 Indeed, as indicated by the experimental data (Fig. 6), a significant blueshift of the absorption coefficient is observed in the transition from the gas phase (350 °C) to the liquid phase (23 °C), which is caused by the solvation of water with nearby water molecules. This notable effect can also be seen in Fig. 6 by comparing the absorption coefficients measured at 23 °C (continuous curve) and 100 °C (dashed curve). Clearly, the absorption peak shifts towards lower energies as temperature increases and water molecules (at 100 °C) become less coordinated with hydrogen bonds because of the increasing effect of thermal fluctuations that disrupt the hydrogen bond network. In the case of ice, the presence of more effective and longer-range hydrogen bonds causes a blueshift of the entire absorption curve. In fact, the maximum of the absorption peak in the case of ice is displaced by a value of 0.35 eV at higher energies than liquid water at 23 °C.18 The dependence of electronic transitions with respect to the hydrogen-bonding network was highlighted in other systems, notably benzophenone where, by selectively exciting the inhomogenously broadened electronic absorption, the different vibrational frequencies of the H-bonded vs. free carbonyl bonds were measured.25 The results of our UV-Resonance Raman experiments can be interpreted within the same framework, as detailed below. Table 2 reports the values of the molar extinction coefficient of water at 23 °C, taken from Fig. 6,18 as a function of the wavelengths (and relative energy) at which we have acquired the UV Raman spectra. The absorption coefficient of water at 532 nm can be taken from ref. 23, and its value is 0.043 m−1. In the same work, the authors assessed the absorption coefficient down to the limit of 250 nm, where it is 0.059 m−1. Hence, the absorption at 532 nm is slightly lower, but of the same order of magnitude as that at 250 nm.
| Wavelength (nm) | Energy (eV) | Extinction coefficient (ε, M−1 cm−1) |
|---|---|---|
| 200 | 6.20 | 5.54 × 10⁻⁵ |
| 213 | 5.82 | 2.10 × 10⁻⁵ |
| 226 | 5.49 | 1.55 × 10⁻⁵ |
| 250 | 4.96 | 8.68 × 10⁻⁶ |
By looking at the spectra reported in Fig. 1 and 2, we have commented how the spectral differences increase as the wavelength of the excitation source decreases. In particular, in Fig. 2 it is possible to see a gradual increase in intensity around 3600 cm−1 moving from 250 nm to 226 nm up to 213 nm. According to the interpretation reported in,15 the region at 3600 cm−1 is associated with the Raman signal arising from the free OH-stretching. By observing in Fig. 6 the value of the extinction coefficient for water at 350 °C (where the fraction of weakly H-bonded water molecules is more relevant), we can see a rapid increase in the extinction coefficient starting from λ ∼ 220 nm. We therefore associate the intensity increase nearby 3600 cm−1, observed in the spectra recorded with 226 nm and 213 nm excitations, with a pre-resonance effect caused by the contributions to Raman scattering arising from weakly H-bonded water molecules. In the data at 200 nm, instead, we observe in Fig. 1 and 2 a slight relative increase also in the region around 3400 cm−1. Based on the Gaussian deconvolution discussed in Section 2, we observe an increase in peak 3 compared to peak 2, hence the contributions of the DA configurations are selectively excited at the expense of the DDAA ones. Overall, as it is also demonstrated by the trend of the R value shown in Fig. 3, we can state that by using UV sources with a gradually shorter wavelength, one can enhance in the Raman spectrum of water the contributions arising from weakly H-bonded water molecules.
By considering now the case of ice, we need to make a distinction between its bulk and its surface. Through the technique known as glancing angle Raman Spectroscopy (where one increases the angle of incidence between the excitation and the normal to the surface) it has been possible24 to obtain the spectrum of the ice-air interface: in this case the signal comes from the surface layers of ice, up to a thickness of about 50 nm. The Raman spectrum recorded by Kahan et al.24 is different from the spectrum of bulk liquid water, and it resembles that of liquid water at the interface with air. Furthermore, the comparison between the Raman spectrum of bulk water and that of the water-air interface, reveals that the latter spectrum shows a more relevant contribution in the high wavenumber region of the OH stretching band,24 exactly where the signals from weakly H-bonded water molecules are expected. The spectrum of the ice-air interface is fairly similar to that of the water-air interface, but with a slightly higher contribution from strongly H-bonded water.24 In the Raman spectrum of the ice-air interface in the OH-stretching region, the largest intensity is observed between ∼3100 and 3700 cm−1.24 Hence, by starting from this observation, we can reliably associate the positive signals in the difference spectra reported in Fig. 4b with the contribution arising from the surfaces in the snow crystallites with a high value of the specific surface area, also in agreement with our previous work.7
The surface contributions in the OH stretching region of the UV Raman spectra of NLS are all higher than those observed in the corresponding Raman spectrum recorded with visible excitation (Fig. 4). Based on the above discussion, the mechanism that produces in snow such intensity enhancement of the OH-stretching signals with higher wave numbers is the same that produces similar spectroscopic effects in liquid water and is correlated with the presence of weakly H-bonded water molecules.
Conclusions
We analyzed Raman spectra of water and snow using sources of different wavelengths in the visible and UV-C region. In liquid water, we interpreted the varying relative intensities by a selective excitation of weakly H-bonded water molecules. Depending on the adopted UV excitation, the contributions to the spectrum of water in the OH-stretching region have different relative intensities. Also, in snow and ice, with a different relative relevance, we observed the same qualitative dependence upon the excitation wavelength of the contribution to the Raman spectra arising from weakly coordinated H-bonded water molecules. The different contribution to Raman scattering in snow and ice arising from surfaces is confirmed here in the UV-range extending our previous results in the visible region.7Author contributions
Conceptualization, E. M., P. M. O. and M. T.; methodology, E. M., B. R., Mg. T. M. T. and P.M. O; validation, E. M., P. M. O. and M. T.; formal analysis, E. M., M. T.; investigation, E. M., Mg. T., B. R. and M. T.; resources, P. M. O. and M. T.; data curation, E. M., Mg. T., B. R.; writing – original draft preparation, E. M, M. T., and P. M. O.; writing – review and editing, E. M., Mg. T., B. R., M. T. and P. M. O.; visualization, E. M.; supervision, P. M. O. and M. T. All authors have read and agreed to the published version of the manuscript.Conflicts of interest
There are no conflicts to declare.Acknowledgements
We acknowledge Elettra Sincrotrone Trieste for providing access to its synchrotron radiation facilities and for financial support (proposal number 20210160). We thank Alessandro Gessini of the IUVS beamline at Elettra for the technical support. Mg. T. acknowledges the InCIMa4 project, funded by the European Regional Development Fund and Interreg V-A Italy Austria 2014–2020.References
- A. C. Adolph, M. R. Albert, J. Lazarcik, J. E. Dibb, J. M. Amante and A. Price, J. Geophys. Res., 2017, 122, 121–139 CrossRef.
- B. R. Pinzer, M. Schneebeli and T. U. Kaempfer, Cryosphere, 2012, 6, 1141–1155 CrossRef.
- X. Wang and I. Baker, J. Geophys. Res.: Atmos., 2013, 118, 371–382 Search PubMed.
- E. Brun, Ann. Glaciol., 1989, 13, 22–26 CrossRef.
- P. B. Louden and J. D. Gezelter, J. Phys. Chem., 2017, 121, 26764–26776 CAS.
- F. Domine, M. Albert, T. Huthwelker, H. Jacobi, A. A. Kokhanovsky, M. Lehning and G. Picard, Atmos. Chem. Phys., 2008, 8, 171–208 CrossRef CAS.
- E. Maggiore, D. R. Galimberti, M. Tommasini, M.-P. Gaigeot and P. M. Ossi, Appl. Surf. Sci., 2020, 515, 146029 CrossRef CAS.
- M. Alejandra Sánchez, T. Kling, T. Ishiyama, M. J. Van Zadel, P. J. Bisson, M. Mezger, M. N. Jochum, J. D. Cyran, W. J. Smit, H. J. Bakker, M. J. Shultz, A. Morita, D. Donadio, Y. Nagata, M. Bonn and E. H. G. Backus, Proc. Natl. Acad. Sci. U. S. A., 2017, 114, 227–232 CrossRef PubMed.
- E. Whalley, Can. J. Chem., 1977, 55, 3429–3441 CrossRef CAS.
- V. Buch and J. P. Devlin, J. Chem. Phys., 2013, 110, 3437–3443 CrossRef.
- I. Duričković, R. Claverie, P. Bourson, M. Marchetti, J. M. Chassot and M. D. Fontana, J. Raman Spectrosc., 2011, 42, 1408–1412 CrossRef.
- X. Xue, Z. Z. He and J. Liu, J. Raman Spectrosc., 2013, 44, 1045–1048 CrossRef CAS.
- Q. Sun and H. Zheng, Prog. Nat. Sci., 2009, 19, 1651–1654 CrossRef CAS.
- T. Ikeda-Fukazawa and K. Kawamura, J. Chem. Phys., 2004, 120, 1395–1401 CrossRef CAS PubMed.
- Q. Sun, Vib. Spectrosc., 2009, 51, 213–217 CrossRef CAS.
- E. Maggiore, M. Tommasini and P. M. Ossi, Molecules, 2020, 25, 4458 CrossRef CAS PubMed.
- R. Mota, R. Parafita, A. Giuliani, M. J. Hubin-Franskin, J. M. C. Lourenço, G. Garcia, S. V. Hoffmann, N. J. Mason, P. A. Ribeiro, M. Raposo and P. Limão-Vieira, Chem. Phys. Lett., 2005, 416, 152–159 CrossRef CAS.
- T. W. Marin, I. Janik, D. M. Bartels and D. M. Chipman, Nat. Commun., 2017, 8, 1–9 CrossRef PubMed.
- M. Pastorczak, M. Kozanecki and J. Ulanski, J. Phys. Chem. A, 2008, 112, 10705–10707 CrossRef CAS PubMed.
- B. Rossi, C. Bottari, S. Catalini, F. D’Amico, A. Gessini and C. Masciovecchio, Molecular and Laser Spectroscopy, 2020, pp. 447–482 Search PubMed.
- OriginPro 9.0, OriginLab Corporation, Northampton, MA, USA Search PubMed.
- L. E. Mael, G. Peiker, H. L. Busse and V. H. Grassian, J. Phys. Chem. A, 2021, 125, 10742–10749 CrossRef CAS PubMed.
- J. D. Mason, M. T. Cone and E. S. Fry, Appl. Opt., 2016, 55, 7163–7172 CrossRef CAS PubMed.
- T. F. Kahan, J. P. Reid and D. J. Donaldson, J. Phys. Chem. A, 2007, 111, 11006–11012 CrossRef CAS PubMed.
- R. K. Venkatraman, S. Kayal, A. Barak, A. J. Orr-Ewing and S. Umapathy, J. Phys. Chem. Lett., 2018, 9, 1642–1648 CrossRef CAS PubMed.
| This journal is © the Owner Societies 2022 |

