 Open Access Article
Creative Commons Attribution 3.0 Unported Licence
Small-angle neutron scattering from mixtures of long- and short-chain 3-alkyl-1-methyl imidazolium bistriflimides†
Christopher P.
Cabry
a,
Lucía
D’Andrea
 a,
Naomi S.
Elstone
a,
Sarah
Kirchhecker
a,
Alessio
Riccobono
a,
Naomi S.
Elstone
a,
Sarah
Kirchhecker
a,
Alessio
Riccobono
 a,
Iman
Khazal
a,
Peixun
Li
a,
Iman
Khazal
a,
Peixun
Li
 b,
Sarah E.
Rogers
 b,
Duncan W.
Bruce
 *a and
John M.
Slattery
 *a
*a
aDepartment of Chemistry, University of York, Heslington, York YO10 5DD, UK. E-mail: john.slattery@york.ac.uk; duncan.bruce@york.ac.uk; Tel: +44(0) 1904 324085
bISIS, Science & Technology Facilities Council, Rutherford Appleton Laboratory, Chilton, UK
First published on 16th June 2022
Abstract
The preparation of mixtures of ionic liquids (ILs) represents an attractive strategy to tune their properties, an important aspect of which is to understand how the structure of the bulk varies with composition. In this study, small-angle neutron scattering (SANS) was used to probe mixtures of methylimidazolium-based ionic liquids [Cnmim][Tf2N] with [C2mim][Tf2N]) (n = 4, 6, 8 and 10) and of [Cmmim][Tf2N] with [C12mim][Tf2N] (m = 2, 4, 6 and 8). Mixtures were prepared in both contrasts, which is to say that one component would be fully hydrogenated while the other was fully deuterated, and vice versa. Data were fitted using a range of appropriate models, of which the Teubner–Strey model provided most useful information and the pure materials showed a nascent Polar Non-polar Peak (PNPP) for n = 6, which became more evident as n increased. In the mixtures [Cnmim]x[C2mim]1−x[Tf2N], the PNPP was evident for n = 10 and 8, nascent for n = 6 and absent for n = 4, with percolation showing a very strong dependence on the chain length of the added IL, [Cnmim][Tf2N]. In contrast, while the ability of [C12mim][Tf2N] to form percolated structures was damped when mixed with [Cmmim][Tf2N], as m increased from 2 to 6, this effect was less strong. However, data obtained for mixtures of [C12mim][Tf2N] and [C8mim][Tf2N], both of which percolate as pure materials, did not fit easily in any of the models applied to the previous systems and gave results that depended on the contrast used. Complementary small-angle X-ray scattering (SAXS) data, however, showed the expected evolution and behaviour of the PNPP, COP and CP, revealing that the unexpected observations were due to an adventitious matching out of isotopic contrasts. As well as revealing details of the structures of these IL mixtures, the results also point to complementary strategies for generating bulk percolated structures as a function of cation chain length.
Introduction
Given the synthetic flexibility available in ionic liquids (ILs) where it is possible easily to interchange cation, anion, or both, they are often described as ‘designer solvents’. However, considering only a selection of four different cations with four different anions leads to a potential suite of sixteen new materials, all of which would have to be prepared, purified and tested in order to identify a suitable IL for a particular application of interest. There are significant time and resource costs associated with such an approach. Another way of accessing a library of new ILs with a wide-range of properties is, however, to prepare a small number of salts and to combine these in different ratios to prepare mixtures.1 This has been explored for a range of applications including supercapacitors,2 in classic synthetic pathways and for potential for use in catalysis,3,4 all of which require a good understanding of physical properties such as viscosity and conductivity as well as their bulk structure.5–11 The liquid structure of ILs can be used to explain the variations observed in physical properties and also to provide insights into potential applications as well as to tune structures for specific applications.12,13 Structural investigations of pure ILs utilising small-angle scattering, liquid diffraction and computational studies have found clear ordering in the bulk liquid structure with the presence of two characteristic peaks relating to the anion–cation distance and anion–cation–anion distance. A third peak is observed when long chains (>6 carbons) are present, indicative of a bicontinuous structure.14–18 The structure of some mixed systems have also been investigated using a combination of computational studies and scattering19 of both neutrons and X-rays.20–22 These studies often show ideal behaviour with the development of a phase rich in the alkyl chain developing as ILs containing long alkyl side chains are added to those without.23 Some studies also show the development of micelle structures of the long-chain IL within the bulk structure of the shorter-chained IL.24 Attractive as the idea of controlling bulk structure is, the understanding available of how the properties of IL mixtures relate to their composition and structure is still at an early stage and so if this approach is to prosper,25 there remains a need for fundamental studies to arrive at the point where mixture properties may be understood and predicted with some confidence.As part of a study aimed initially at understanding the properties of imidazolium ILs at the gas–liquid interface using reactive atom scattering,20,26–36 a series of mixtures was prepared with the composition [C12mim]x[C2mim]1−x[Tf2N] (Fig. 1). It was found that [C12mim][Tf2N] was preferentially enriched at the surface, to a large degree mirroring the behaviour of long-chain amphiphiles in water.29,30 The work on the surfaces of the materials was then complemented by a study of the bulk and an initial report described six compositions investigated using small-angle neutron scattering (SANS) with site-specific deuteration to obtain the necessary contrast.30 There then followed a more detailed examination of mixtures of other compositions.20 This employed eight different H/D contrasts (note that the methyl hydrogens, the imidazolium ring hydrogens and the flexible chain hydrogens of [Cnmim]+ cations can all be deuterated independently of one another, providing differing degrees of neutron contrast). Both studies were complemented by molecular dynamics simulations.
 | ||
| Fig. 1 Structures and abbreviations for the ionic liquids used in this study, showing the two isotopic contrasts used in the SANS experiments. | ||
These experiments showed the evolution of ordering with the mixtures as the proportion of [C12mim][Tf2N] in [C2mim][Tf2N] increased, starting from dilute solutions of small aggregates and then moving towards the emergence of a bicontinuous network where polar (anions and cationic head groups) and non-polar (alkyl chains) parts of the ILs are nano-segregated. This is evidenced by the appearance of a PNPP reflection, incipient from fitting from ca. 24 mol% [C12mim][Tf2N] and quite evident by 52 mol% of the longer-chained salt. Indeed, from Teubner–Strey fitting of the data, the derived amphiphile strength (γ) turned negative between 24 (γ = 0.1) and 32 mol% [C12mim][Tf2N] (γ = −0.1) indicating the onset of percolation, which would typically accompany the appearance of reflections originating from persistent bilayer structures. While the multiple contrasts used did provide some nuancing of the understanding, useful data were obtained readily from mixtures of all-hydrogen and all-deuterium contrasts.
Curious then to develop further the understanding of mixtures this general type, a more extensive small-angle neutron scattering (SANS) study has been undertaken in two parts. In the first, a series of mixtures [Cnmim]x[C2mim]1−x[Tf2N] (n = 4, 6, 8 and 10) was prepared in which longer-chain imidazolium salts are mixed with [C2mim][Tf2N] at different compositions. In the second part, a series of mixtures [Cmmim]x[C12mim]1−x[Tf2N] was prepared (m = 2, 4, 6 and 8) using [C12mim][Tf2N] as the base solvent in mixtures with imidazolium salts of decreasing chain lengths. Results from the previous study of the mixtures [C12mim]x[C2mim]1−x[Tf2N] showed that these new experiments could be carried out with just two isotopologues, as shown in Fig. 1.20 These new data were then compared with those obtained from the pure [Cnmim][Tf2N] (n = 2, 4, 6, 8, 10 and 12) as well as with data obtained from the studies published previously. The results are now presented and discussed.
Experimental
The preparation of the compounds and mixtures used in this study are found in the ESI† along with details of the neutron source and experiments.Small-angle X-ray scattering used a Bruker D8 Discover equipped with a bespoke temperature-controlled, bored-graphite rod furnace, custom built at the University of York. Cu-Kα (λ = 0.154056 nm) radiation was used, generated from a 1 μS microfocus source. Diffraction patterns were recorded on a 2048 × 2048 pixel Bruker VANTEC 500 area detector set at a distance of 121 mm from the sample, allowing simultaneous collection of small- and wide-angle scattering data.
To interpret the scattering data obtained, the Teubner–Strey model,37 which is described in the ESI,† was utilised. It uses empirical fitting parameters which, when combined in different ways, yield the d-spacing, correlation length (ζ) and amphiphile strength (γ) parameters for each sample, whose significance to ILs will become evident in the discussion. Where 0 < γ < 1, the d-spacing is related to the distance between the aggregates, while the correlation length is associated with the density fluctuations within the aggregates, which can be interpreted as the alkyl chain aggregate size. Where −1 < γ < 0, the d-spacing relates to the local bilayer dimension (given by the position of the PNPP and Bragg's law), while the correlation length relates to the alkyl chain domain length scale. The point at which the amphiphile strength changes from negative to positive values is known as the Lifshitz line.
In cases where the Teubner–Strey model did not describe the observed scattering, Lorentz and peak Lorentz models were found useful in describing broad scattering features at low (Lorentz model) and high (peak Lorentz model) values of q. The difference between the d-spacing and correlation length in the Teubner–Strey or peak Lorentz models gives a length scale associated with the polar network, which in all cases is ca. 12 Å and corresponds to the sum of the lengths of the [Tf2N]− anion and the imidazolium head group.
Results
Pure ionic liquids
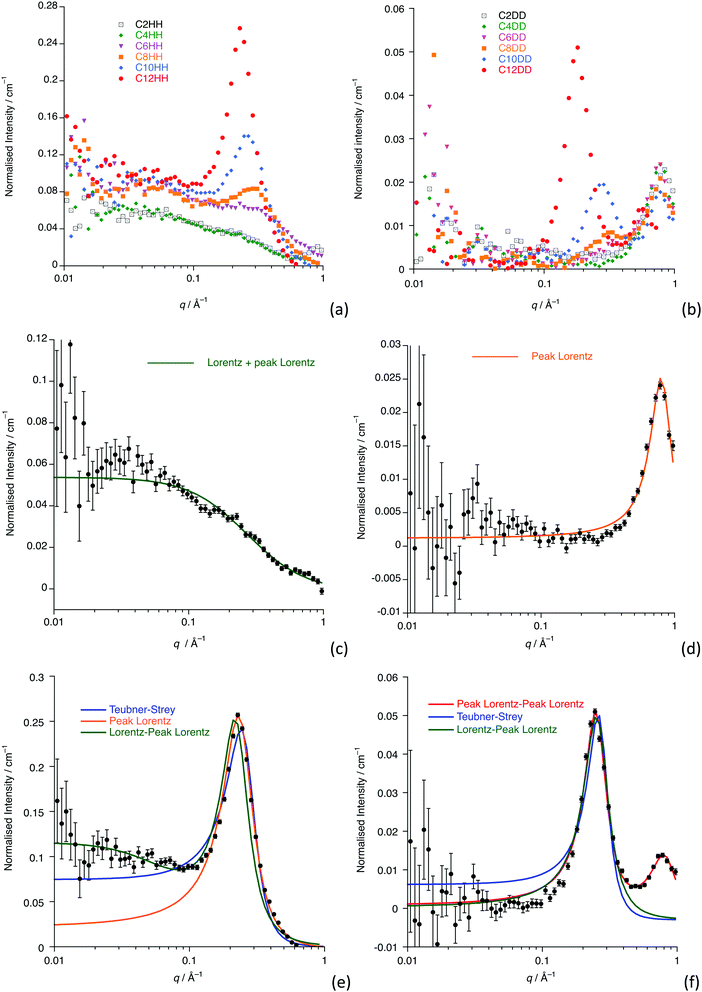
Fig. 2a and b show the data collected for all homologues and isotopologues, while Fig. 2c and d show the data and fits for [C4mim][Tf2N] (C4-HH and C4-DD) and Fig. 2e and f show these data for [C12mim][Tf2N] (C12-HH and C12-DD) as examples of shorter- and longer-chain salts. Remaining plots are found in the ESI† (Fig. S1).Small-angle scattering from ILs has been characterised in terms of three features (not all of which are present for all liquids), which are also seen in the data presented here.38,39 At the shortest length scales (∼1.3 Å−1 in q or ca. 4.8 Å) the liquids usually exhibit a so-called Contact Peak (CP), which has been described as relating to correlations between oppositely charged ions. At intermediate length scales (∼0.8 Å−1 or ca. 7.8 Å) the liquids often display a so-called Charge Ordering Peak (COP), which is related to correlations between like charged ions. Finally, at longer length scales (∼0.25 Å−1 or ca. 25 Å, but as a function of alkyl chain length) a Polar Non-Polar Peak (PNPP) can be seen, where nanosegregation of the charged and aliphatic parts of the liquids occurs. In imidazolium salts of the type [Cnmim][X] (where X is a range of anions), for example, this starts to become visible at around n = 6 and becomes more prominent with increasing alkyl chain length. These basic findings mirror those determined using small-angle X-ray scattering by Deutsch and co-workers.11,23
The SANS data presented here for shorter-chain [Cnmim][Tf2N] ILs (n < 8) simply feature a COP (the CP does not appear in the q-range studied) that appears at the characteristic position of around 0.8 Å−1, which is seen in all the fully deuterated contrasts, as well as in [C2mim][Tf2N]. The scattering intensity for the COP is a function of the difference in scattering length densities (SLDs) between the cationic imidazolium head-group and the anion, which is large in [Cnmim-d2n+7][Tf2N] and small in [Cnmim][Tf2N]. The SANS fitting parameters and their derived values are found in Table 1 (n < 8) and 2 (8 ≤ n ≤ 12). For n < 8, all the [Cnmim-d2n+7][Tf2N] contrasts were well fitted by a single Lorentzian peak that describes the COP, although it is noticeable that a nascent PNPP begins to appear for n = 6. This is consistent with previous work that suggests that alkyl chain ordering, and the PNPP that is associated with this, builds slowly from around n = 6.38,40 The COP shifts to lower values of q with increasing n, which has also been seen in previous work. It has been proposed that this is related to the stretching of the polar network, formed from the cation head-groups and anions, as the non-polar sub phase, formed by the alkyl chains, becomes more established.30,38,40–45
| Lorentz + peak Lorentz | COP position/Å−1 | ||
|---|---|---|---|
| Correlation length/Å | COP length scale/Å | ||
| a Satisfactory Lorentz model fitting of the low-q data for this liquid was not possible, due to the presence of the incipient PNPP, which overlaps with the low-q scattering. | |||
| C2-HH | 5 | 7 | 0.9 |
| C2-DD | — | 8 | 0.81 |
| C4-HH | 4 | — | — |
| C4-DD | — | 8 | 0.78 |
| C6-HH | —a | — | — |
| C6-DD | — | 8 | 0.77 |
For n ≥ 8, the data also show a clear PNPP in the range q = 0.2 to 0.3 Å−1 with a COP again seen for the perdeuterated isotopologues.
For the longer-chain ILs (n ≥ 8), the scattering describing the PNPP can be modelled by a single Lorentzian peak and, where the COP is visible, a model containing two Lorentzian peaks describes both of these features. However, the [Cnmim][Tf2N] (Cn-HH) contrasts have additional scattering at low q (≲0.04 Å−1), which is also seen in the shorter-chain homologues and which is discussed below.
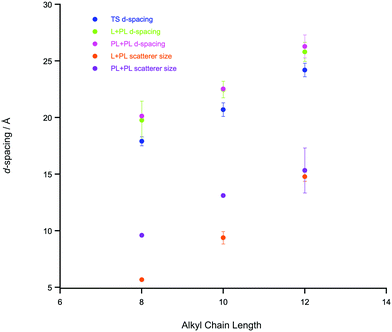
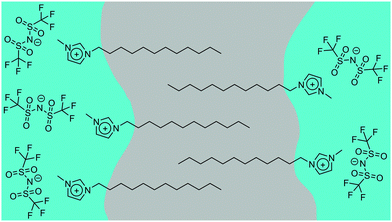
Where n ≥ 8, the system can be described as a bicontinuous network of continuous, apolar domains, comprising the alkyl chains and a continuous, polar network of the [Tf2N]− anions and imidazolium head groups. This is indicated by the clear PNPP and the negative amphiphile strength (γ) derived from the Teubner–Strey model (Table 2). This bicontinuous network changes with increasing chain length (n) with the PNPP moving to lower q and increasing in intensity. Thus, the d-spacing from the fitted models in Table 2 increases from ∼20 Å for [C8mim][Tf2N], to ∼23 Å for [C10mim][Tf2N], to ∼25 Å for [C12mim][Tf2N]. These are related quite closely to the length of the cations, assuming fully extended alkyl chains (17, 19 and 21 Å, respectively estimated from crystallographic data e.g. ref. 46). However, we note that the angle made by the extended chain to the plane of the imidazolium cation can vary significantly [see e.g. Fig. S5 in ref. 47] and in the most extreme case where the chain direction might be close to perpendicular to the imidazolium plane, then the observed separation between the polar and apolar domains can be reduced by as much as ca. 5.5 Å. However, this is a rather extreme situation and, in a fluid medium the average angle would be expected to be significantly smaller. Thus, while the cation lengths quoted should be considered as maxima, they do not affect the overall conclusion that from the length scales obtained, a bilayer structure, likely constructed of interdigitated alkyl chains, is present. The scatterer size, from the Lorentz plus peak Lorentz model and the correlation length from the Teubner–Strey fitting both relate to the size of the scattering objects and these values increase with increasing alkyl chain length from ∼ 6 Å (n = 8) to 17 Å (n = 12). This suggests that the length of the alkyl chain region increases with increasing n and the alkyl chains are either interdigitated or folded, agreeing with the picture given by the d-spacings. The data collected from the fitting for these materials are shown in Fig. 3 and an indicative cartoon of the proposed ordering is presented in Fig. 4. The differences in d-spacings and scatterer sizes between the different models can be accounted from the ways in which the two models determine these sizes. Thus, while the PL model simply determines the peak position, the TS model also accounts for scattering caused by different scattering objects (as can be seen from the equation in the ESI† which shows both a q−4 and a q−2 dependence). This interpretation is consistent with the MD simulations carried out by Shimizu et al. who suggest that the PNPP is well defined by [C7mim][Tf2N] and that the length scale of the apolar network increases with increasing n.38
| Lorentz + peak Lorentz | Teubner–Strey | Peak Lorentz + peak Lorentz | ||||||||
|---|---|---|---|---|---|---|---|---|---|---|
| Correlation length/Å | d-Spacing/Å | Scatterer size/Å | Correlation length/Å | d-Spacing/Å | Amphiphile strength, γ | COP d-spacing/Å | COP scatterer size/Å | PNPP d-spacing/Å | PNPP scatterer size/Å | |
| C8-HH | 10 | 21 | 6 | 5 | 18 | −0.7 | — | — | 21 | 6 |
| C8-DD | — | 18 | 6 | 8 | 18 | −0.9 | 8 | 4 | 20 | 10 |
| C10-HH | 10 | 23 | 9 | 8 | 21 | −0.7 | — | — | 23 | 8 |
| C10-DD | — | 22 | 10 | 8 | 20 | −0.9 | 8 | 5 | 23 | 13 |
| C12-HH | 13 | 27 | 14 | 13 | 25 | −0.8 | — | — | 27 | 13 |
| C12-DD | — | 25 | 15 | 17 | 24 | −0.9 | 8 | 4 | 25 | 17 |
Support for the models proposed here comes from a comprehensive study of [Cnmim][Tf2N] (2 ≤ n ≤ 10) by Canongia Lopes et al. in which molecular dynamics simulations were compared with X-ray scattering data collected by Triolo et al.38,48 The bicontinuous nanostructure was reported to occur when n > 5, with the bicontinuous domains being well defined by n > 6, in good agreement with the interpretation of the SANS data presented here.
SANS of Binary mixtures of [Cnmim][Tf2N] in [C2mim][Tf2N]
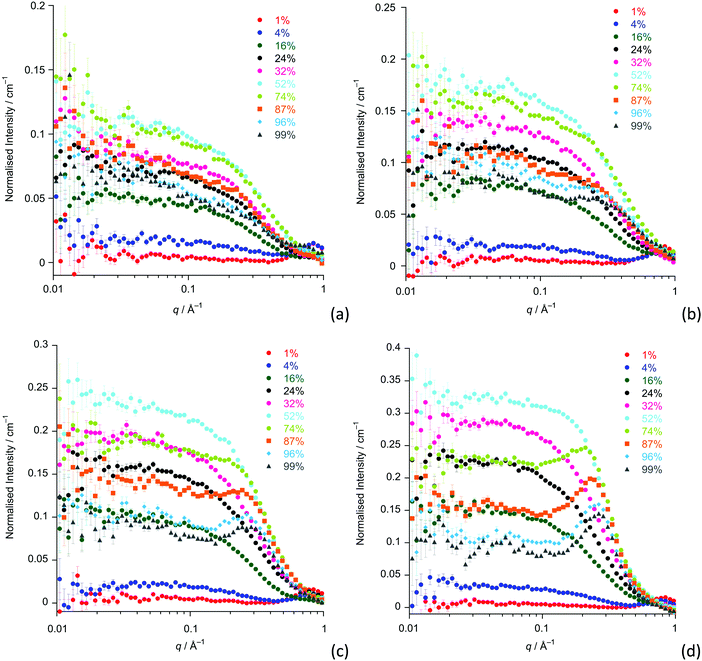
Having established the neutron scattering and appropriate fitting models for our samples of pure [CnC1im][Tf2N] ILs and confirmed that these data present a picture of organisation in these systems that is consistent with previous work, we move to a discussion of mixtures of these compounds that have not been studied previously by small-angle scattering measurements. The compositions and contrasts investigated are given in Table S1 (ESI†), while the SANS data for the [Cnmim]x[C2mim-d11]1−x[Tf2N] contrasts are provided in Fig. 5 (data for the reverse contrasts are provided as Fig. S2, ESI†). The Teubner–Strey model was used to describe all the SANS data, chosen as it proved robust across the whole composition range in previous work on mixtures of [C12mim]x[C2mim]1−x[Tf2N] and as it gave information about length scales for the pure ILs (see above) that was comparable with the other models.20The amphiphile strength parameters for the mixtures are shown in Fig. 6 and are averaged values for the [Cnmim]x[C2mim-d11]1−x[Tf2N] and [Cnmim-d2n+7]x[C2mim]1−x[Tf2N] neutron contrasts (n = 12, 10, 8 and 6). Data for [C4mim]x[C2mim-d11]1−x[Tf2N] and [C4mim-d15]x[C2mim]1−x[Tf2N] are not included as they essentially have no scattering from alkyl chain aggregates at q < 0.4 Å−1 and so do not display any organisation of alkyl chains. However, as can be seen in Fig. 5, these samples do show low-q scattering that indicates the presence of small spherical scattering objects, which can be fitted to a simple spherical form factor with no structure factor contribution or polydispersity (data are found in Table S3, while fits are shown in Fig. S3, ESI†). This is an unexpected result as short chains such as these would not be expected to aggregate to form spherical ‘micelles’. However, experiments carried out by Smith and Prévost on mixtures of hydrogenated and deuterated tetradecane may provide an explanation for the source of this scattering.49 They found that although no aggregates form in this system, scattering objects with a radius of gyration of around 5 Å were present. This can be understood by considering that in these mixtures there is contrast between the hydrogenated and deuterated alkane molecules resulting in distinct scattering objects at the molecular length scale, without the need for aggregation of any component. While our samples are made up of two different cations, they are structurally similar and therefore a similar process can be used to explain this unexpected scattering when mixing ILs with fully deuterated and fully hydrogenated cations. The molecular length of the cations is approximately 9.4 Å, from a crystal structure containing [C4mim]+ as the cation. Fitting the observed low-q scattering suggests spherical scattering objects with a radius of ∼6 Å. This is similar to the size of the cations, and reasonable when molecular motion and rotation of the ion is considered.50
In order to fit these data efficiently, we have assumed that the SLD of the scattering object is equal to that calculated for [C4mim]+ and the bulk SLD is that of the average of all components present in the mixtures.
The variation in the intensity of the scattering from the different samples can be accounted for by the difference in the SLD of bulk versus scattering object decreasing as the concentration of [C4mim]+ increases while the number of scattering objects also increases, leading to an initial increase in scattering followed by a decrease as the SLD difference between the scattering objects and the bulk decreases. For some samples the fitting was complicated by the presence of peaks at high q, which are expected for these samples. The variation in the fitted radius may be due either to the scattering being from different components in the system or from variations within the orientation of the [C4mim]+ cation within this system, in order to fully determine this further contrasts would be required.
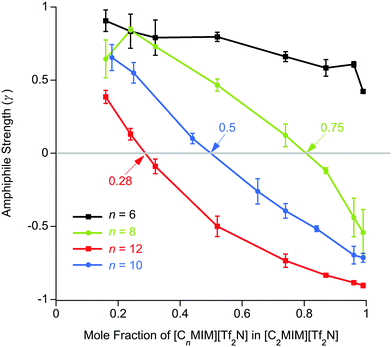
For n ≥ 8, the evolution of the amphiphile strength parameter (γ) with x is similar for different values of n so that γ decreases with increasing x. Positive values (γ, 1; low values of x) indicate the presence of small aggregates of the longer alkyl chains, while the presence of a non-polar sub-phase formed from the longer alkyl chains is established and percolates through the liquid for value of −1 γ < 0. The percolation threshold decreases as n increases, varying from x ≈ 0.75 for n = 8 to x ≈ 0.28 for n = 12 (Fig. 6 and plotted vs. chain length in Fig. S4a, ESI†). The volume fractions of the liquids composed of alkyl chains (apolar volume fraction) at the percolation threshold were then estimated and found to be 0.26 (n = 8), 0.24 (n = 10) and 0.19 (n = 12). A plot of the apolar volume fraction against percolation threshold (Fig. S4b, ESI†) suggests that the apolar volume alone is not the driver for formation of a bicontinuous network i.e. a bicontinuous network is not guaranteed when a critical threshold in the apolar volume fraction of the system is reached. This suggests that in addition to volume-fraction considerations, preferential organisation of the longer chains helps to drive the formation of local bilayer structures in the liquids that lead to percolation at lower x and lower apolar volume fractions for the mixtures containing cations with longer chains. Percolation is not observed where n = 6.
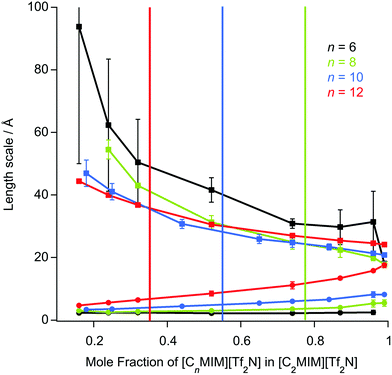
The length scale data obtained from the fitting are plotted in Fig. 7. Thus, decreasing the alkyl chain length of [Cnmim][Tf2N] in binary mixtures in [C2mim][Tf2N] for n = 12, 10, 8, 6, 4, has an interesting effect upon the liquid structure. As the chain length decreases from n = 12 to n = 6, at mole fractions below the percolation threshold the aggregate size decreases, as indicated by the smaller correlation lengths and greater distances between the aggregates (larger d-spacing) are seen. This is intuitive since, as the alkyl chain becomes shorter, the aggregates also become smaller and so can be further apart. This effect is compounded by the prospect that at a given concentration of [Cnmim][Tf2N], there will be fewer aggregates at shorter chain lengths as the cations are less amphiphilic.
After the percolation threshold and the formation of bicontinuous structures, the d-spacings decrease at a slower rate and the correlation lengths begin to increase, although while this is most pronounced when n = 12, it is less clear at shorter chain lengths. The cause of this decrease in the d-spacing after the percolation threshold is less blatant than a simple increase in concentration of aggregates. Instead the decrease in the d-spacing can be attributed to the decrease in the volume of the polar network as the concentration of [C2mim][Tf2N] decreases. Thus, as the concentration of [C2mim][Tf2N] decreases, the d-spacing converges upon that measured for the pure [Cnmim][Tf2N]. For mixtures with [C4mim][Tf2N], however, no structuring is observed as the [C4mim]+ cation is evidently insufficiently amphiphilic to aggregate when dissolved in [C2mim][Tf2N].
SANS of Binary mixtures of [C12mim][Tf2N] in [Cmmim][Tf2N]
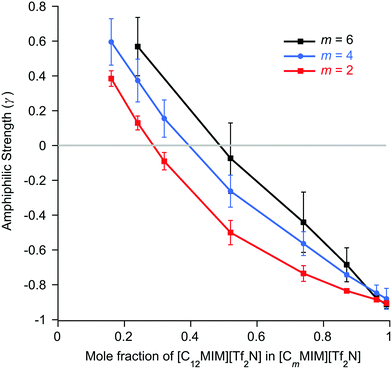
A complementary series of experiments then considered mixtures formed between [C12mim][Tf2N] and [Cmmim][Tf2N] for m = 2, 4, 6 and 8. Compositions are found in Table S2 (ESI†), data for [C12mim]x[Cmmim-d2m+7]1−x[Tf2N] (m = 2, 4 and 6) are provided in Fig. 8 (the reverse contrasts are provided as Fig. S5, ESI†), while amphiphile strength parameters for the same mixtures are shown in Fig. 9.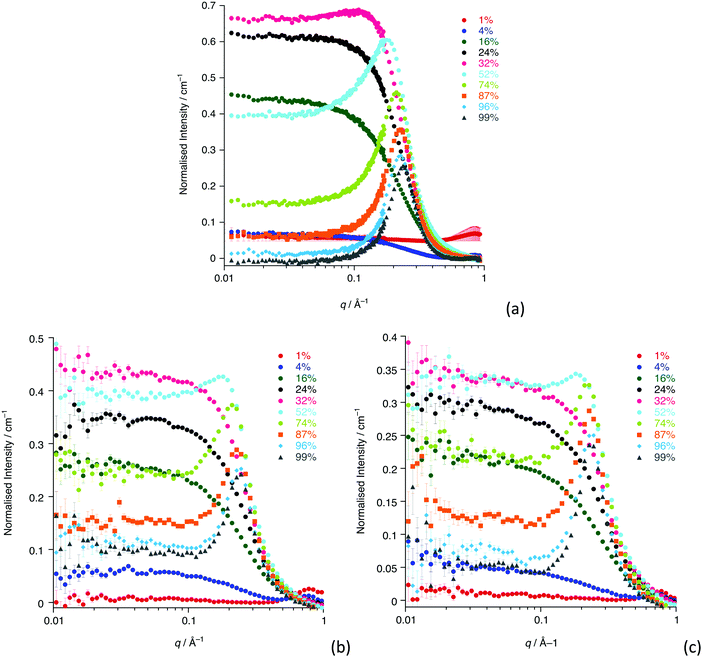 | ||
| Fig. 8 SANS data for: (a) [C12mim]x[C2mim-d11]1−x[Tf2N]; (b) [C12mim]x[C4mim-d15]1−x[Tf2N]; (c) [C12mim]x[C6mim-d19]1−x[Tf2N]. All the data are normalised to the background. | ||
The basic form of the data is the same as found for the mixtures of [Cnmim][Tf2N] in [C2mim][Tf2N]. Isolated aggregates of the C12 alkyl chains are evident at low concentrations of [C12mim][Tf2N]. As the proportion of [C12mim][Tf2N] in the mixtures increases the form of the scattering changes and an incipient PNPP appears, indicating that percolation of the chains has occurred and a bicontinuous network of polar and non-polar domains is established. Perhaps intuitively, the proportion of [C12mim][Tf2N] required for percolation increases with increasing m (x ≈ 0.29 for m = 2 increasing to x ≈ 0.49 for m = 6, Fig. S6a, ESI†), the relationship again being linear. Thus, for mixtures where the ‘base’ IL is more aliphatic (longer alkyl chain), a larger mole fraction of [C12mim][Tf2N] is required in order to form a well-established bilayer structure around the C12 chains. As was seen for the [Cnmim]x[C2mim]1−x[Tf2N] mixtures, the percolation threshold is not linked to a critical apolar volume fraction in the systems, above which a non-polar sub-phase is established (Fig. S6b, ESI†). Instead, the apolar volume fraction of the liquids increases linearly as the percolation threshold increases. The general form of plots of d-spacing and ζ are also similar to those for the mixtures of [Cnmim][Tf2N] in [C2mim][Tf2N] (Fig. S7, ESI†), with d-spacings that decrease steadily with increasing mole fraction of [C12mim][Tf2N] as the correlation lengths increase. These changes are essentially independent of the alkyl chain length of the shorter-chained liquid. This is logical, since the self-organisation in the system that leads to the observed scattering is related to the long-chained IL, which is the same in all of these mixtures.
Binary mixtures of [C12mim][Tf2N] in [C8mim][Tf2N]
The SANS study of the binary mixtures of [C12mim][Tf2N] in [C8mim][Tf2N] ([C12mim]x[C8mim]1−x[Tf2N]) has been singled out as it warrants a more detailed explanation owing to the observation that it does not follow the trends of the other mixtures presented above. The SANS data for both contrasts are shown in Fig. 10. The IL mixtures [C12mim]x[C8mim]1−x[Tf2N] are distinct from all the mixtures discussed above as both pure components have a bicontinuous structure, showing PNPPs in the SANS experiments and negative amphiphile strengths from Teubner–Strey fitting (Table 2). On mixing these two ILs it was expected that they would be compatible and form bicontinuous structures with length scales intermediate between the two components, so that all compositions would show a PNPP. However, this is not the case and Fig. 10 shows that in most cases the PNPP is absent. Furthermore, fitting the data using the Teubner–Strey approach and using the models employed for the other mixture systems proved difficult across most of the compositional range (0.24 < x < 0.96; Fig. S8, ESI†). However, Fig. 11 shows that, as expected, the data did fit well to the Lorentz + peak Lorentz model over most of the composition range except at x = 0.16, 0.24, 0.32 for C12-DD in C8-HH, and x = 0.01, 0.04, 0.16 for C12-HH in C8-DD, where only a Lorentz component was required to fit the data at lower q (> 0.4 Å−1). As the SANS data did not fit well to the Teubner–Strey model and there was a discontinuity in the parameters derived from the Lorentz + peak Lorentz model, it was reasonable to consider whether these data were really indicating the inherent ordering in these mixtures.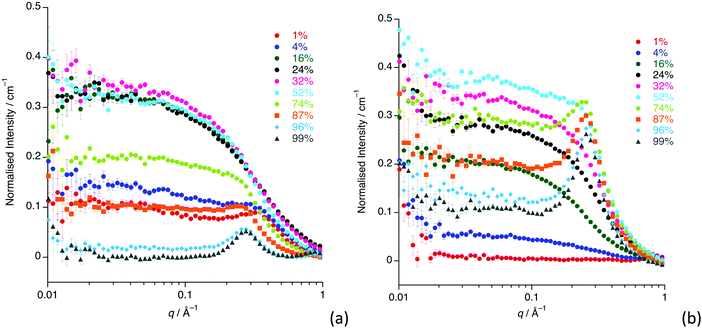 | ||
| Fig. 10 SANS data for all compositions for: (a) [C12mim-d31]x[C8mim]1−x[Tf2N]; (b) [C12mim]x[C8mim-d23]1−x[Tf2N]. | ||
One possible explanation for the observations above would be poor neutron contrast between the apolar and polar components in the liquid. To see if this might be the case, complementary small-angle X-ray scattering (SAXS) measurements were conducted on a subset of the compositions of [C12mim]x[C8mim-d23]1−x[Tf2N] (x = 0.01, 0.04, 0.16, 0.24, 0.52, 0.87, 0.99). These data (Fig. 12) do indeed show that all the compositions show a CP (q ≈ 1.3 Å−1, 4.8 Å), a COP (q ≈ 0.8 Å−1, 7.8 Å) and a PNPP (q ≈ 0.25 Å−1, 25.0 Å for x = 0.99 moving to ca. 0.34 Å−1, 18.5 Å for x = 0.01). The PNPP suggested that all have a bicontinuous structure, as expected, and that the length scale for this increases smoothly with increasing x, as the proportion of the longer chain cation increases. We note that mixtures of the same two ILs were studied by Pontoni et al. using synchrotron radiation and that in this study they also looked at the evolution of the data as a function of temperature. They also found that the position of the CP and COP were essentially invariant with composition, with the position of the PNPP varying with composition.51
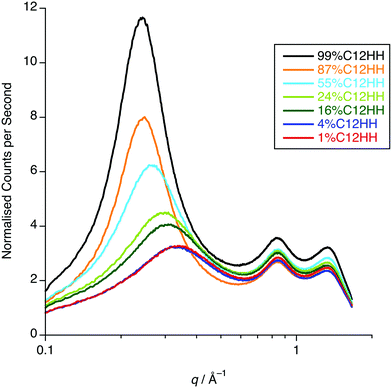 | ||
| Fig. 12 SAXS data for x = 0.01, 0.04, 0.16, 0.24, 0.52, 0.87, 0.99 of [C12mim]x[C8mim-d23]1−x[Tf2N] (C12-HH in C8-DD). | ||
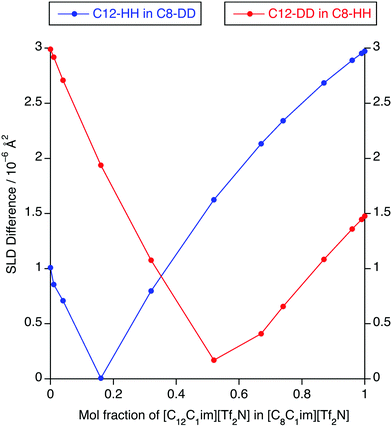
The absence of PNPPs in the SANS data and their presence in all of the SAXS data suggested that there is indeed poor contrast between the apolar and polar components in the SANS experiments, which led to the observations above. The estimated SLD difference between the apolar alkyl chain component and the polar component of the mixtures was calculated using a group contribution scheme (Fig. 13). In this approach, the SLD of the polar component was estimated using the molar ratio and densities of [C1mim][Tf2N] and [C1mim-d9][Tf2N], the density of [C1mim-d9][Tf2N] being estimated from the density and molecular mass of [C1mim][Tf2N] and the molecular mass of the deuterated analogue.30,40 SLDs of the apolar alkyl chains were calculated using the molar ratio and densities of decane for the C12 alkyl chains and hexane for C8 alkyl chains.
For [C12mim]x[C8mim-d23]1−x[Tf2N] mixtures, a PNPP is visible in the SANS data when Δ(SLD) > 2.3 × 10⁻⁶ A2, which occurs at x ≥ 0.74. However, for mixtures of [C12mim-d31]x[C8mim]1−x[Tf2N], the situation is a little more complex. Thus, the PNPP can only be seen in the SANS data when x ≥ 0.87 corresponding to Δ(SLD) = 1.1 × 10⁻⁶ A2. Lower mole fractions of [C12mim-d31][Tf2N] in [C8mim][Tf2N] (x ≤ 0.32) also have Δ(SLD) > 1.1 × 10⁻⁶ A2, yet no PNPP is observed by SANS because at lower x, the mixture is rich in hydrogenated chains, which have good contrast against the bulk liquid and lead to low-q scattering, as seen and discussed for the short-chain ILs above. This effectively masks any low-intensity PNPP, meaning that a larger value of Δ(SLD) is needed to clearly observe the PNPP.
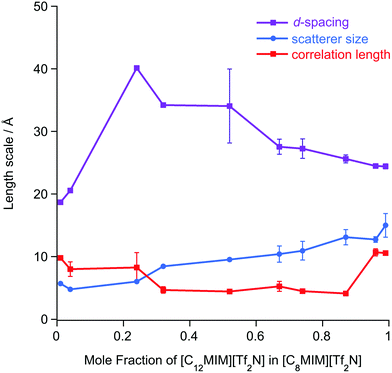
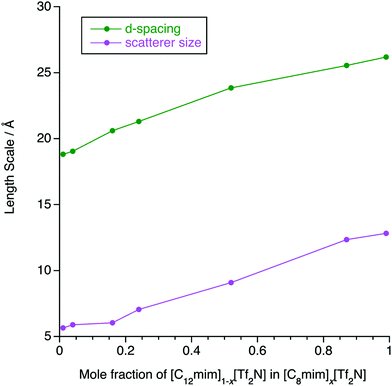
The SAXS data were fitted to a model where the PNPP, COP and CP were each fitted as individual Lorentzian peaks. The parameters derived from this for the PNPP are shown in Fig. 14, from which it can be seen that upon increasing the mole fraction of [C12mim][Tf2N] in [C8mim][Tf2N], both the d-spacing and scatterer size increase smoothly. The d-spacing increases from 18.5 Å for x = 0.01 to 26 Å for x = 0.99 and the scatterer size increases from 6 Å for x = 0.01 to 13 Å for x = 0.99. As all the SAXS data shows a PNPP peak, these mixtures are all interpreted as having a bicontinuous structure. On increasing x, the d-spacing and scatterer sizes both increase at the same rate, giving the picture of an increasing bilayer length scale due to more volume being taken up by the apolar alkyl chains, while the length scale of the polar network (the difference between the d-spacing and the scatterer size) stays constant around 13 Å.
Summary and conclusions
In previous work, mixtures of [C2mim][Tf2N] and [C12mim][Tf2N] have been studied in various contrasts using SANS methods.20,30 These studies showed the evolution of the mixture structure from isolated aggregates of [C12mim]+ cations at lower concentrations of [C12mim][Tf2N] to the formation of a bicontinuous, percolated structure at higher concentrations. As such, in some ways these mixtures can be regarded as analogous to solutions of a long-chain amphiphile ([C12mim]+) in a polar solvent ([C2mim][Tf2N]). The present study extended this work to consider mixtures of other, shorter-chain imidazolium cations dissolved in [C2mim][Tf2N] and found rather parallel behaviour. However, there were chain-length dependencies in the data. Thus, mixtures with both [C8mim][Tf2N] and [C10mim][Tf2N] showed formation of percolated structures at 75 mol% and 50 mol% of the long-chained IL, respectively (compared to 28 wt% for [C12mim][Tf2N]). This was accompanied by the appearance of a PNPP in the scattering pattern. Percolation is driven to lower concentrations of the longer-chain cations as the chain length increases. This is not solely due to the apolar volume fraction of the system, i.e. there is no critical apolar volume fraction that is associated with the formation of a percolated structure. Presumably, preferential organisation of the longer alkyl chains drives the formation of local bilayers found in the percolated structure. However, while aggregates of the [C6mim]+ cation were present in [C6mim]x[C2mim]1−x[Tf2N] mixtures and a nascent PNPP was seen in the scattering data, percolation was not observed, as interpreted through the Teubner–Strey amphiphile strength parameter, γ (Fig. 6). Mixtures including [C4mim][Tf2N], on the other hand, showed no scattering from aggregates. Clearly, as the length of the alkyl chains in these mixtures decreases their ability to support self-organised structures (bicontinuous networks or aggregates of the longer alkyl chains) is suppressed, in a similar way to that seen in the homologous series of pure [Cnmim][Tf2N] ILs.38The second series of mixtures then sought to examine the behaviour of the amphiphilic cation [C12mim][Tf2N] when dissolved in [Cmmim][Tf2N] ILs with increasing chain lengths. Formation of aggregates with increasing proportion of [C12mim][Tf2N] was seen through a development of the observed scattering and in each case, m = 2, 4 and 6, a distinct PNPP was first observed in mixtures containing 52 mol% [C12mim][Tf2N]. Analysis of the data using the Teubner-Strey model showed a pronounced trend with increasing m, with the amphiphile parameter, γ, turning negative (indicating percolation) for [C12mim][Tf2N] mol fractions of ca. 0.3, 0.4 and 0.5 in [C2mim][Tf2N], [C4mim][Tf2N] and [C6mim][Tf2N], respectively. Thus, increasing the chain length of the ‘base’ solvent damps the ability of [C12mim][Tf2N] to percolate and, while this effect is less strong than the inverse where percolation of [Cnmim][Tf2N] in [C2mim][Tf2N] is considered as a function of n (above), nonetheless, approaching double the concentration of [C12mim][Tf2N] is required to form a bicontinuous structure in [C6mim][Tf2N] compared to [C2mim][Tf2N].
Mixtures of [C12mim][Tf2N] and [C8mim][Tf2N] proved an altogether different prospect and, despite each component showing a distinct PNPP as a pure material, the PNPP was only observed in the SANS data at the highest concentrations of [C12mim][Tf2N]. Interestingly, this concentration was not the same in [C12mim-d31]x[C8mim]1−x[Tf2N] mixtures compared to [C12mim]x[C8mim-d22]1−x[Tf2N]. Complementary SAXS data for this system, however, showed a clear and smooth evolution of the PNPP, present in pure [C8mim][Tf2N] with a spacing of 18.5 Å to its value of 26 Å for pure [C12mim][Tf2N]. By determining the SLDs of different contrasts of the two components, the reason for unexpected behaviour observed in the neutron experiments became immediately apparent. By coincidence in many of these mixtures, the SLD difference between the alkyl chains and the bulk liquid was insufficient to observe scattering and observation of a PNPP in the SANS. The X-ray contrast between alkyl chains and the bulk was sufficiently high across all compositions and thus the true evolution of the liquid structure was revealed in the SAXS data.
In conclusion, SANS has been shown to be a powerful tool to probe the bulk structural properties of mixtures of methylimidazolium ILs of varying chain length, although contrast issues need consideration in some mixtures, i.e. [C12mim]x[C8mim]1−x[Tf2N]. The behaviour of these mixtures can then be described according to distinct regimes. Thus, with only the shortest chains, i.e. [C4mim]x[C2mim]1−x[Tf2N], no aggregation or bicontinuous structures are seen, whereas when one chain lengthens slightly as in [C6mim]x[C2mim]1−x[Tf2N], aggregation of the longer-chain cation is seen, but percolation does not occur at any concentration. However, for [C12mim]x[Cmmim]1−x[Tf2N] where m is short (2, 4 or 6), aggregates of [C12mim][Tf2N] are seen at lower concentrations, while a bicontinuous network of polar and non-polar domains is seen at higher concentrations. However, when both chains are long enough to form bicontinuous structures in the pure liquids, i.e. [C12mim]x[C8mim]1−x[Tf2N], then the mixtures are bicontinuous at all compositions, with the d-spacing smoothly changing between the two extremes as the composition changes. Thus, by mixing a relatively small number of ILs it is indeed possible to access a range of different liquid structures and the information above helps to set out design rules that allow some prediction of the structures that may be expected for particular combinations of liquids and compositions.
Author contributions
The materials used in the study were prepared by CPC, SK, LD’A and IK, with some highly deuterated materials being provided by PL. Data were collected by CPC, LD’A, AR, JMS and DWB, and the scattering experiments were overseen on the beamline Sans2D by SER, who also reduced the data prior to analysis; these data were analysed by CPC and NSE. The original draft was prepared by CPC and DWB, with SER, JMS and NSE contributing to the reviewing and editing. The work was conceptualised by JMS and DWB, who also provided supervision and who acquired the funding to carry out the work.Conflicts of interest
The authors declare no conflicts of interest.Acknowledgements
We thank the EPSRC (EP/K039660/1, EP/K032062/1 and EP/T031174/1 – LD'A and NSE), the University of York (CPC, SK, AR) and the Università Degli Studi di Palermo (AR) for financial support, and STFC for neutron beamtime (RB1510160 and RB1610234). The raw neutron data may be found at: https://doi.org/10.5286/ISIS.E.RB1610234.References
- H. Niedermeyer, J. P. Hallett, I. J. Villar-Garcia, P. A. Hunt and T. Welton, Chem. Soc. Rev., 2012, 41, 7780–7802 RSC.
- S. Lall-Ramnarine, S. Suarez, N. Zmich, D. Ewko, S. Ramati, D. Cuffari, M. Sahin, Y. Adam, E. Rosario, D. Paterno and J. Wishart, ECS Trans., 2014, 64, 57–69 CrossRef CAS.
- M. A. Crosio, N. M. Correa, J. J. Silber and R. D. Falcone, Org. Biomol. Chem., 2016, 14, 3170–3177 RSC.
- H. P. Steinruck and P. Wasserscheid, Catal. Lett., 2015, 145, 380–397 CrossRef.
- M. T. Clough, C. R. Crick, J. Gräsvik, P. A. Hunt, H. Niedermeyer, T. Welton and O. P. Whitakerb, Chem. Sci., 2015, 215, 1101–1114 RSC.
- J. J. Fillion and J. F. Brennecke, J. Chem. Eng. Data, 2017, 62, 1884–1901 CrossRef CAS.
- D. Y. Song and J. Chen, J. Chem. Thermodyn., 2014, 77, 137–143 CrossRef CAS.
- D. Y. Song and J. Chen, J. Chem. Eng. Data, 2014, 59, 257–262 CrossRef CAS.
- P. Nancarrow, A. Al-Othman, D. K. Mital and S. Döpking, Energy, 2021, 220, 119761 CrossRef CAS.
- R. Hayes, G. G. Warr and R. Atkin, Chem. Rev., 2015, 115, 6357–6426 CrossRef CAS PubMed.
- D. Pontoni, J. Haddad, M. Di Michiel and M. Deutsch, Soft Matter, 2017, 13, 6947–6955 RSC.
- W. D. Amith, J. C. Araque and C. J. Margulis, J. Phys. Chem. Lett., 2020, 11, 2062–2066 CrossRef CAS PubMed.
- J. C. Araque and C. J. Margulis, J. Chem. Phys., 2018, 149, 7 CrossRef PubMed.
- D. Xiao, L. G. Hines, S. F. Li, R. A. Bartsch, E. L. Quitevis, O. Russina and A. Triolo, J. Phys. Chem. B, 2009, 113, 6426–6433 CrossRef CAS PubMed.
- H. V. R. Annapureddy, H. K. Kashyap, P. M. De Biase and C. J. Margulis, J. Phys. Chem. B, 2010, 114, 16838–16846 CrossRef CAS PubMed.
- H. V. R. Annapureddy, H. K. Kashyap, P. M. De Biase and C. J. Margulis, J. Phys. Chem. B, 2011, 115, 9507–9508 CrossRef CAS.
- R. P. Daly, J. C. Araque and C. J. Margulis, J. Chem. Phys., 2017, 147, 5 Search PubMed.
- J. J. Hettige, H. K. Kashyap, H. V. R. Annapureddy and C. J. Margulis, J. Phys. Chem. Lett., 2013, 4, 105–110 CrossRef CAS PubMed.
- K. Shimizu, M. Tariq, L. P. N. Rebelo and J. N. C. Lopes, J. Mol. Liq., 2010, 153, 52–56 CrossRef CAS.
- C. P. Cabry, L. D'Andrea, K. Shimizu, I. Grillo, P. X. Li, S. Rogers, D. W. Bruce, J. N. C. Lopes and J. M. Slattery, Faraday Discuss., 2018, 206, 265–289 RSC.
- C. C. Weber, N. J. Brooks, F. Castiglione, M. Mauri, R. Simonutti, A. Mele and T. Welton, Phys. Chem. Chem. Phys., 2019, 21, 5999–6010 RSC.
- T. Cosby, U. Kapoor, J. K. Shah and J. Sangoro, J. Phys. Chem. Lett., 2019, 10, 6274–6280 CrossRef CAS PubMed.
- D. Pontoni, M. DiMichiel and M. Deutsch, J. Mol. Liq., 2020, 300, 112280 CrossRef CAS.
- A. Klee, S. Prevost and M. Gradzielski, Chem. Phys. Chem., 2014, 15, 4032–4041 CrossRef CAS PubMed.
- T. L. Greaves and C. J. Drummond, Chem. Rev., 2015, 115, 11379–11448 CrossRef CAS PubMed.
- S. M. Purcell, P. D. Lane, L. D’Andrea, N. S. Elstone, D. W. Bruce, J. M. Slattery, E. J. Smoll, S. J. Greaves, M. L. Costen, T. K. Minton and K. G. McKendrick, J. Phys. Chem. B, 2022, 126, 1962–1979 CrossRef CAS PubMed.
- E. J. Smoll, X. M. Chen, L. M. Hall, L. D'Andrea, J. M. Slattery and T. K. Minton, J. Phys. Chem. C, 2020, 124, 382–397 CrossRef CAS.
- E. J. Smoll, S. M. Purcell, L. D’Andrea, J. M. Slattery, D. W. Bruce, M. L. Costen, K. G. McKendrick and T. K. Minton, J. Phys. Chem. Lett., 2019, 10, 156–163 CrossRef CAS PubMed.
- E. J. Smoll, M. A. Tesa-Serrate, S. M. Purcell, L. D’Andrea, D. W. Bruce, J. M. Slattery, M. L. Costen, T. K. Minton and K. G. McKendrick, Faraday Discuss., 2018, 206, 497–522 RSC.
- D. W. Bruce, C. P. Cabry, J. N. C. Lopes, M. L. Costen, L. D'Andrea, I. Grillo, B. C. Marshall, K. G. McKendrick, T. K. Minton, S. M. Purcell, S. Rogers, J. M. Slattery, K. Shimizu, E. Smoll and M. A. Tesa-Serrate, J. Phys. Chem. B, 2017, 121, 6002–6020 CrossRef CAS PubMed.
- M. A. Tesa-Serrate, E. J. Smoll, L. D’Andrea, S. M. Purcell, M. L. Costen, D. W. Bruce, J. M. Slattery, T. K. Minton and K. G. McKendrick, J. Phys. Chem. C, 2016, 120, 27369–27379 CrossRef CAS.
- S. M. Purcell, M. A. Tesa-Serrate, B. C. Marshall, D. W. Bruce, L. D'Andrea, M. L. Costen, J. M. Slattery, E. J. Smoll, T. K. Minton and K. G. McKendrick, Langmuir, 2016, 32, 9938–9949 CrossRef CAS PubMed.
- M. A. Tesa-Serrate, B. C. Marshall, E. J. Smoll, S. M. Purcell, M. L. Costen, J. M. Slattery, T. K. Minton and K. G. McKendrick, J. Phys. Chem. C, 2015, 119, 5491–5505 CrossRef CAS.
- B. H. Wu, J. M. Zhang, T. K. Minton, K. G. McKendrick, J. M. Slattery, S. Yockel and G. C. Schatz, J. Phys. Chem. C, 2010, 114, 4015–4027 CrossRef CAS.
- C. Waring, P. A. J. Bagot, J. M. Slattery, M. L. Costen and K. G. McKendrick, J. Phys. Chem. Lett., 2010, 1, 429–433 CrossRef CAS.
- C. Waring, P. A. J. Bagot, J. M. Slattery, M. L. Costen and K. G. McKendrick, J. Phys. Chem. A, 2010, 114, 4896–4904 CrossRef CAS PubMed.
- M. Teubner and R. Strey, J. Chem. Phys., 1987, 87, 3195–3200 CrossRef CAS.
- K. Shimizu, C. E. S. Bernardes and J. N. C. Lopes, J. Phys. Chem. B, 2014, 118, 567–576 CrossRef CAS PubMed.
- H. K. Kashyap, J. J. Hettige, H. V. R. Annapureddy and C. J. Margulis, Chem. Commun., 2012, 48, 5103–5105 RSC.
- M. A. A. Rocha, C. M. S. S. Neves, M. G. Freire, O. Russina, A. Triolo, J. A. P. Coutinho and L. M. N. B. F. Santos, J. Phys. Chem. B, 2013, 117, 10889–10897 CrossRef CAS PubMed.
- K. V. Schubert, R. Strey, S. R. Kline and E. W. Kaler, J. Chem. Phys., 1994, 101, 5343–5355 CrossRef CAS.
- A. A. Freitas, K. Shimizu and J. N. C. Lopes, J. Chem. Eng. Data, 2014, 59, 3120–3129 CrossRef CAS.
- K. Shimizu and J. N. C. Lopes, Fluid Phase Equilib., 2016, 418, 181–191 CrossRef CAS.
- K. Shimizu, M. Tariq, A. A. Freitas, A. A. H. Padua and J. N. C. Lopes, J. Braz. Chem. Soc., 2016, 27, 349–362 CAS.
- K. Shimizu and J. N. C. Lopes, J. Mol. Liq., 2015, 210, 257–263 CrossRef CAS.
- Z. Wei, X. Wei, S. Fu, J. Liu and D. Zhang, Acta Crystallogr., Sect. E: Struct. Rep. Online, 2009, 65, o1159 CrossRef CAS PubMed.
- D. W. Bruce, Y. A. Gao, J. N. C. Lopes, K. Shimizu and J. M. Slattery, Chem. – Eur. J., 2016, 22, 16113–16123 CrossRef CAS PubMed.
- O. Russina, A. Triolo, L. Gontrani, R. Caminiti, D. Xiao, L. G. Hines, R. A. Bartsch, E. L. Quitevis, N. Plechkova and K. R. Seddon, J. Phys.: Condens. Matter, 2009, 21, 424121 CrossRef.
- G. N. Smith and S. Prévost, J. Appl. Crystallogr., 2021, 54, 541–547 CrossRef CAS.
- H. Zhang and S. S. Yu, Z. Kristallogr. – New Cryst. Struct., 2019, 234, 757–759 CrossRef CAS.
- D. Pontoni, M. DiMichiel and M. Deutsch, J. Mol. Liq., 2021, 338, 11 CrossRef.
Footnote |
| † Electronic supplementary information (ESI) available. See DOI: https://doi.org/10.1039/d2cp01528e |
| This journal is © the Owner Societies 2022 |

