 Open Access Article
Creative Commons Attribution 3.0 Unported Licence
A natural scheme for the quantitative analysis of the magnetically induced molecular current density using an oriented flux-weighted stagnation graph. I. A minimal example for LiH
Raphael J. F.
Berger
 *a and
Maria
Dimitrova
 *b
*b
aFachbereich für Chemie und Physik der Materialien, Paris-Lodron Universität Salzburg, Jakob-Harringerstr. 2a, A-5020 Salzburg, Österreich, Austria. E-mail: raphael.berger@plus.ac.at
bDepartment of Chemistry, Faculty of Science, University of Helsinki, P.O. Box 55, A. I. Virtasen aukio 1, FI-00014, Finland
First published on 21st September 2022
Abstract
A new natural scheme is introduced to analyze quantitatively the magnetically induced molecular current density vector field, J. The set of zero points of J, which is called its stagnation graph (SG), has been previously used to study the topological features of the current density of various molecules. Here, the line integrals of the induced magnetic field along edges of the connected subset of the SG are calculated. The edges are oriented such that all weights, i.e., flux values become non-negative, thereby, an oriented flux-weighted (current density) stagnation graph (OFW-SG) is obtained. Since in the exact theoretical limit, J is divergence-free and due to the topological characteristics of such vector fields, the flux of all separate vortices (current density domains) and neighbouring connected vortices can be determined exactly by adding the weights of cyclic subsets of edges (i.e., closed loops) of the OFW-SG. The procedure is exemplified by the minimal example of LiH for a weak homogeneous external magnetic field, B, perpendicular to the chemical bond. The OFW-SG exhibits one closed loop (formally decomposed into two edges), and an open line extending to infinity on both of its ends. The method provides the means of accurately determining the strength of the current density even in molecules with a complicated set of distinct vortices.
1 Introduction
Practically all relevant physical changes in molecules are ultimately triggered by the electromagnetic force since the other three fundamental interactions, the weak, the strong and the gravitational interaction are effectively irrelevant to chemistry. Molecules are restricted to interacting with their environment via electronic or magnetic perturbations (that are not necessarily weak). Therefore, studies of the molecular magnetic response are highly relevant not only from a theoretical perspective.In molecular magnetic response theory, the induced electronic current density, J, is the key quantity from which all other magnetic response properties can be calculated in a quasi-classical fashion by evaluating the expectation value integrals. Hirschfelder has coined the term subobservable for quantities for which it is possible to define a formal quantum mechanical operator.1 A series of reviews on the current state of research on magnetically induced molecular current densities is available.2–5 One branch of this research field is concerned with both the topological and the quantitative characterization of J, an undertaking that is analogous to the topology analysis of the electron density based on the quantum theory of atoms in molecules (QTAIM).6,7 The J field typically consists of multiple vortices, some embedded in each other. However, their boundary surfaces may never cross due to charge conservation. These surfaces are known as separatrix surfaces. Topological characterizations of the induced molecular current density field are fairly abundant in the literature6,8–26 and analogies between the QTAIM analysis and the SG graph analysis have been discussed.3 Unlike for bond paths in QTAIM, there are no established empirical rules or simple models of interpretation for the topology of the magnetically induced current density, yet. Large unsymmetric molecules in general do not seem to posses a connected stagnation graph, but rather a collection of isolated stagnation points (see below).
We have recently reported some progress on the quantitative characterization of the current–density field27 from the secondary magnetic field that it induces, Bind, better known as the nucleus-independent chemical shift (NICS), which can be derived from the chemical shielding tensor, σ, by contracting it with the external magnetic field.28 The obtained data are used, for example, to rationalize the aromatic or antiaromatic nature of a compound. For the quantification of the molecular current density, one is typically interested in its flux, Φ, through a particular surface,  , chosen according to chemical intuition or other demands or model ideas, such as the “ring-current” model for molecular systems2 or the integration based on the zero-flux electron density surfaces used in QTAIM.29,30 The idea underlying our recent work27 is to apply the integral form of the Ampère–Maxwell law by evaluating a line integral of Bind instead of evaluating a surface integral of J. The flux is then obtained by line-integration of μ0−1Bind over the boundary line
  of surface
  ,
,
 | (1) |
In this work, we employ the simple example of the lithium hydride molecule to illustrate in simple terms the essence of our method and show how this method can be naturally extended by applying it to the stagnation graph (i.e., the set of zero points) of J, such that the quantification of separate current vortices becomes exact, simple and possible to automate.
Analysis of the magnetically induced current density is done routinely for various molecules, including compounds of potential practical application such as porphyrinoids. Their current density field consists of multiple pathways, the strength of which is difficult to determine using the standard approach of placing an integration plane through the molecule and calculating the strength of the flux across the plane. In our scheme, one first needs to obtain the stagnation graph (SG) of the molecule and then perform the integration along the points of the SG as described in Section 2. Hence, it becomes possible to precisely characterize the magnetically induced current density in molecules where the vortices are hard to identify and discern.
This work is, furthermore, intended as the first of a series, where we outline the new method by increasingly complex examples. The upcoming works in the series are planned to contain studies on II. homo- and heterodiatomic molecules, III. Benzene, IV. Neutral and charged [CnHn]m type annulenes, V. Condensed ring systems and porphyrins, VI. Selected organometallic molecules. Work on them is already under way.
2 Results and discussion
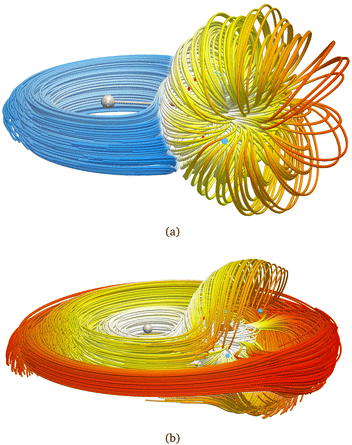
We exemplify our proposed method with the lithium hydride molecule since this gives, to the best of our knowledge, the simplest case of a stagnation graph containing a closed loop and an open line. Thus, it is the simplest case of a molecule that shows two physically distinct (separable) vortices. The topology of the magnetically induced current density field, J, of LiH has been discussed previously in great detail by Stevens and Lipscomb (1964),31 Keith and Bader (1993),7 and later by Pelloni, Lazzeretti and Zanasi (2009),18 so we will only give a summary here. General procedures to compute stagnation points and stagnation lines have been published, as well, and are freely available.9,10 Placing B parallel to the z axis and perpendicular to the Li–H bond (lying along the y direction) results in a J field composed of exactly two separate current vortices, each possessing a central stagnation line (see Fig. 1). Both vortices are separated from each other by a single closed surface of the exact topology and the approximate geometry of a sphere. The spherical vortex domain (inner/toroidal vortex) is completely enclosed in the global domain, extending over the entire molecular space (outer/hydride vortex). The domains are illustrated as streamlines in Fig. 2.
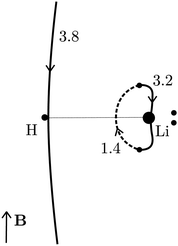
The outer vortex has an open stagnation line, ![[small script l]](https://www.rsc.org/images/entities/char_e146.gif) 1, extending from z = −∞ to z = ∞ and lying in the (y, z) plane. Line
1, extending from z = −∞ to z = ∞ and lying in the (y, z) plane. Line ![[small script l]](https://www.rsc.org/images/entities/char_e146.gif) 1 passes very close to the H atom, only a fraction of an atomic unit, and bends towards it. Above and below the (x, y) plane,
1 passes very close to the H atom, only a fraction of an atomic unit, and bends towards it. Above and below the (x, y) plane, ![[small script l]](https://www.rsc.org/images/entities/char_e146.gif) 1 is bending slightly towards the center of the LiH molecule but straightens out at larger ±z heights. The current vortex around this stagnation line
1 is bending slightly towards the center of the LiH molecule but straightens out at larger ±z heights. The current vortex around this stagnation line ![[small script l]](https://www.rsc.org/images/entities/char_e146.gif) 1 is diatropic, thus, according to our convention, the vortical flow is clockwise if the external field B is pointing in the z direction and the reader looks towards negative z. The approximately spherical inner vortex domain can be seen as inserted in-between the streamlines of the outer vortex which bypass this domain similarly to how a laminar-flowing fluid would pass around a ball fully submerged into it. This results in two isolated “toroidal stagnation points”†p(3,1)+ and p(3,−1)− on the separatrix sphere,
1 is diatropic, thus, according to our convention, the vortical flow is clockwise if the external field B is pointing in the z direction and the reader looks towards negative z. The approximately spherical inner vortex domain can be seen as inserted in-between the streamlines of the outer vortex which bypass this domain similarly to how a laminar-flowing fluid would pass around a ball fully submerged into it. This results in two isolated “toroidal stagnation points”†p(3,1)+ and p(3,−1)− on the separatrix sphere,  , where the outer flow diverges in (and converges from) all directions on
  , respectively.
The inner domain encloses the Li atom, and its radius extends roughly to the midpoint between the two atoms. The geometrical center of  does not lie on the Li atom, but instead, it is significantly shifted away from the H atom. The stagnation line,
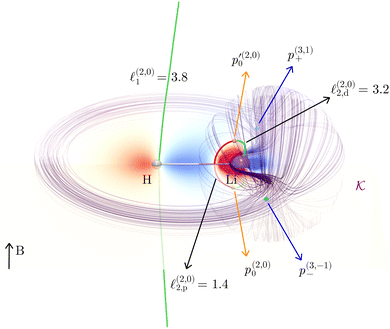
 ![[small script l]](https://www.rsc.org/images/entities/char_e146.gif) 2, of the current–density vortex is closed, which gives rise to a toroidal flow with a (metaphorically speaking) “reflux” region in the middle. On the side towards the H atom, the flux resembles that of a paratropic vortex, while on the remote side of the Li atom, the flux acts as if it were diatropic. The respective parts of the stagnation line are illustrated in red and green in Fig. 3 and 4. We define the two somewhat arbitrary stagnation points p0 and
2, of the current–density vortex is closed, which gives rise to a toroidal flow with a (metaphorically speaking) “reflux” region in the middle. On the side towards the H atom, the flux resembles that of a paratropic vortex, while on the remote side of the Li atom, the flux acts as if it were diatropic. The respective parts of the stagnation line are illustrated in red and green in Fig. 3 and 4. We define the two somewhat arbitrary stagnation points p0 and  (illustrated in orange) where the apparent diatropic and paratropic parts of the critical stagnation line meet as the “branching points” of the closed loop. However, they are not (0,0) branch critical points in the topological sense. The streamline representations show that the current–density flow in the middle region is similar to the water circulating in a waterspout fountain with an inner tube (illustrated using cyan arrows in Fig. 4). The inner stream passes close to the Li atom, roughly perpendicular to both B and the Li–H bond, lying in the (x, y) plane. It has the shape of a double S and contains a heteroclinic streamline line which connects the source critical point p(3,1)+ with the sink critical point p(3,−1)− also inside
  . Critical points can be classified using the Collard–Hall indices (r, s).‡ Points p− and p+ are illustrated in cyan in Fig. 3 and 4.
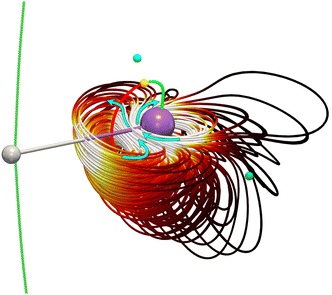 | ||
Fig. 4 The reflux region in the toroidal vortex of the magnetically induced current density field J of LiH. The current flux of this vortex integrates to 4.6 nA T−1, as can be easily derived from Fig. 3 by adding the weights of branches ![[small script l]](https://www.rsc.org/images/entities/char_e146.gif) 2,p and 2,p and ![[small script l]](https://www.rsc.org/images/entities/char_e146.gif) 2,d. 2,d. | ||
The stagnation line of the inner vortex, ![[small script l]](https://www.rsc.org/images/entities/char_e146.gif) 2, is a topological circle (a closed loop) that we split into two branches,
2, is a topological circle (a closed loop) that we split into two branches, ![[small script l]](https://www.rsc.org/images/entities/char_e146.gif) 2,d (with diatropic current vortices in the vicinity) and
2,d (with diatropic current vortices in the vicinity) and ![[small script l]](https://www.rsc.org/images/entities/char_e146.gif) 2,p (with paratropic vortices in the vicinity), connected by the “branching points” p0 and
2,p (with paratropic vortices in the vicinity), connected by the “branching points” p0 and  illustrated in orange. Strictly speaking, this division is arbitrary, and
 ![[small script l]](https://www.rsc.org/images/entities/char_e146.gif) 2 is actually one unbranched topological domain. Nevertheless, this scheme provides a simple example of the general method for determining the current flux that we are outlining here. We also note that this type of toroidal current vortex is, obviously, neither diatropic nor paratropic over its whole domain. Due to charge conservation, no current can pass from one vortex into or out of another one. In LiH, this means that the inner and the outer domains are perfectly separated by surface
2 is actually one unbranched topological domain. Nevertheless, this scheme provides a simple example of the general method for determining the current flux that we are outlining here. We also note that this type of toroidal current vortex is, obviously, neither diatropic nor paratropic over its whole domain. Due to charge conservation, no current can pass from one vortex into or out of another one. In LiH, this means that the inner and the outer domains are perfectly separated by surface  . Hence, a total current flux can be defined for each individual vortex. As a chemical interpretation, one would assign the diamagnetic, spatially unconfined current vortex around
 ![[small script l]](https://www.rsc.org/images/entities/char_e146.gif) 1 to the hydride anion, which dominates the response and encloses a spatially confined toroidal vortex arising from the Li+ cation.
1 to the hydride anion, which dominates the response and encloses a spatially confined toroidal vortex arising from the Li+ cation.
As we have shown previously,27 and since Bind is vanishing at infinity in the z and y directions, the total current flux, Φ![[small script l]](https://www.rsc.org/images/entities/char_e146.gif) 1, of the outer vortex can be obtained from the line integral
1, of the outer vortex can be obtained from the line integral
 | (2) |
Here we have chosen the direction of stagnation line ![[small script l]](https://www.rsc.org/images/entities/char_e146.gif) 1 such that Φ
1 such that Φ![[small script l]](https://www.rsc.org/images/entities/char_e146.gif) 1 becomes positive. In this way, every current–density stagnation graph can be uniquely oriented to yield a directed graph. Furthermore, to each “edge” (line segment) of a stagnation graph, a flux integral can be assigned, such that an oriented edge-weighted graph with strictly positive weights is obtained.
1 becomes positive. In this way, every current–density stagnation graph can be uniquely oriented to yield a directed graph. Furthermore, to each “edge” (line segment) of a stagnation graph, a flux integral can be assigned, such that an oriented edge-weighted graph with strictly positive weights is obtained.
To obtain the current flux of the toroidal current inside  , one can make use of the notion that the total flux is passing through the D-shaped closed stagnation line
 ![[small script l]](https://www.rsc.org/images/entities/char_e146.gif) 2 (composed of
2 (composed of ![[small script l]](https://www.rsc.org/images/entities/char_e146.gif) 2,d and
2,d and ![[small script l]](https://www.rsc.org/images/entities/char_e146.gif) 2,p). Thus,
2,p). Thus,
 | (3) |
 | (4) |
= Φ![[small script l]](https://www.rsc.org/images/entities/char_e146.gif) 2,d + Φ 2,d + Φ![[small script l]](https://www.rsc.org/images/entities/char_e146.gif) 2,p, 2,p, | (5) |
![[small script l]](https://www.rsc.org/images/entities/char_e146.gif) 2,d and
2,d and ![[small script l]](https://www.rsc.org/images/entities/char_e146.gif) 2,p. A simple numerical integration scheme has been applied (see Appendix B for details) through which we have obtained Φ
2,p. A simple numerical integration scheme has been applied (see Appendix B for details) through which we have obtained Φ![[small script l]](https://www.rsc.org/images/entities/char_e146.gif) 1 = 3.8, Φ
1 = 3.8, Φ![[small script l]](https://www.rsc.org/images/entities/char_e146.gif) 2,d = 3.2 and Φ
2,d = 3.2 and Φ![[small script l]](https://www.rsc.org/images/entities/char_e146.gif) 2,d = 1.4 nA T−1. The corresponding surface integrals of J over the (y, z) plane in the region left of
2,d = 1.4 nA T−1. The corresponding surface integrals of J over the (y, z) plane in the region left of ![[small script l]](https://www.rsc.org/images/entities/char_e146.gif) 1 and over the surface enclosed by
1 and over the surface enclosed by ![[small script l]](https://www.rsc.org/images/entities/char_e146.gif) 2 yielded 4.0, and 4.6 nA T−1, respectively, both in very good agreement with the corresponding values of the line integrals (3.8 nA T−1 and 3.2 + 1.4 = 4.6 nA T−1). Details about these computations are given in the appendix.
2 yielded 4.0, and 4.6 nA T−1, respectively, both in very good agreement with the corresponding values of the line integrals (3.8 nA T−1 and 3.2 + 1.4 = 4.6 nA T−1). Details about these computations are given in the appendix.
Any field J partitioned into vortices separated by asymptotic surfaces (separatrices), i.e., the field is decomposable into pairwise disjunct sets, has cyclic stagnation subgraphs defining the vortex, such as the pair of stagnation lines ![[small script l]](https://www.rsc.org/images/entities/char_e146.gif) 1 and
1 and ![[small script l]](https://www.rsc.org/images/entities/char_e146.gif) 2 in the example of the toroidal vortex in LiH. Setting this cyclic subgraph to
2 in the example of the toroidal vortex in LiH. Setting this cyclic subgraph to  in the line integral in eqn (1) gives the current flux, Φ, in this vortex. Then, in order to obtain the flux of a separate vortex, one only has to add the weights of the corresponding cyclic subgraph in the correct orientation (i.e., a plus or minus sign).
Regarding the efficiency and feasibility of the proposed method, there are the following advantages:
• Instead of surface integrals, only line integrals have to be calculated, which roughly leads to scaling of order  versus
 .
.
• For integrals of the current flux for which the stagnation lines are (approximately) known, e.g., the central axis in planar (approximately) symmetric rings, and which yield the total “ring” current,27 no current density has to be calculated directly but instead only the typically simpler chemical shielding tensors have to be computed.
• With this method, there is no ambiguity concerning the precise definition and localization of the vortices under consideration, which is in stark contrast to the commonly used schemes which rely on explicit or implicit topological knowledge that very often was present only in rudimentary form. So it seems highly likely that many of the previous studies where surface integrals of the current density have been calculated based on a casual inspection of streamline graphs or various ad hoc integration schemes are flawed due to ill-defined current domains.
On the contrary one has to face two methodological disadvantages using this method:
• For all but the simplest cases (total current in symmetric ring systems), the SG has to be determined. As outlined above, we suggest that this is only an ostensible disadvantage since integration without knowledge of the topology is at risk of being erroneous, particularly if not at least investigated visually.
• For vortices with open stagnation lines (such as the hydride vortex in our example), one has to integrate relatively far out (i.e., approximately 100 or even 200 atomic units) into the shielding cone of the molecule in order to achieve convergence (see appendix C for one numerical and one analytical example). This is a consequence of the non-local nature of the shielding contributions with respect to the underlying J field.
• As shown previously,17 only relatively small or highly symmetric molecules possess non-trivially connected stagnation subgraphs. Hence, only in such cases, the current–density field can be partitioned into physically well-defined separate (pairwise disjunct) current–density vortices. Thus, only in these cases, it is possible to unambiguously define flux integrals (other than the total molecular flux). This leads to the conclusion that concepts like “bond-currents”, “local ring currents”, or “semi-local ring currents” can actually not be well-defined for molecules without non-trivially connected stagnation subgraphs. Their definition would either require—to the best of our knowledge—a yet unknown unambiguous physical definition, or it should be completely abandoned until we arrive at a deeper understanding of the general topology of molecular current–density fields (a subject on which we are continuously working).
3 Conclusion and outlook
The presented approach effectively gives a complete analysis of all magnetically induced current–density vortices in a molecule. This can be achieved by evaluating the line integral from eqn (1) for each “edge” of the stagnation graph taken with the appropriate sign, i.e., orienting it accordingly. The resulting OFW-SG can be condensed into a schematic diagram, as shown in Fig. 1. In principle, the strategy can be generalized to non-planar and non-cyclic molecules. Hence, the analysis can be carried out for any molecule with a non-trivially connected stagnation graph.Further research is needed to address cases which do not possess a non-trivially connected stagnation graph. This probably applies to the vast majority of molecules. However, one way to deal with this problem is to restrict the analysis to the pseudo-SG,13 where the z component of the induced magnetic field is set to zero, or related methods. Thereby, the topology of the current density field tends to become significantly simpler and usually gets partitioned into smaller separate vortices (current density domains). This comes at the cost that in such fields, the continuity condition is violated, which, strictly speaking, implies that the usual topological tools (such as the Poincaré–Hopf theorem8) are inapplicable. Apart from the usage of pseudo-SGs, we need to arrive at a deeper understanding of the topology of molecular current–density fields for the cases where the SGs are just a collection of isolated points. Ultimately, in this way we could bridge the gap between the intuitive ring-current model and the actual physical current–density field of molecules in general. From our point of view, this is a necessary requirement to give a physically meaningful and mathematically sound definition to any of the traditionally applied schemes for integration of the current density flux. Otherwise, the integration surfaces commonly used in current density analysis studies remain ambiguous and arbitrary to some extent.
Data availability statement
The data that support the findings of this study are available from the corresponding author upon reasonable request.Author contributions
RJFB: conceptualization, investigation, supervision and writing—original draft; MD: funding acquistion, data curation, formal analysis, investigation, software, visualization and writing—review & editing (according to the https://casrai.org/credit/CRediTscheme).Conflicts of interest
There are no conflicts to declare.Appendix A: quantum chemistry calculations
The quantum chemistry calculations were performed using Gaussian 16 Rev. C01.34 The geometry was optimized at the density functional theory level, employing the B3LYP functional35,36 and the aug-cc-pVTZ basis set.37 The nuclear magnetic shielding tensors were calculated using the continuous set of gauge transformation (GSGT) approach.7,38 The current density and the nuclear magnetic shielding tensors in specific points were calculated with the SYSMOIC program.10 It also provided the stagnation graph of the molecule. Two more basis sets from the Dunning family were employed, the quadruple-ζ and the quintuple-ζ versions, to evaluate basis-set convergence of the integrated strength of the current density.The current–density field can be inspected visually on a slice or using streamlines. In this work, we have visualized the results by obtaining the current density on a three-dimensional (3D) grid using the gauge-including magnetically induced current (GIMIC) method3,4,39–41 which is interfaced to quantum chemistry program packages such as Gaussian,42 and employing the Paraview43 program to prepare the graphics. As the name suggests, the method employs gauge-including atomic orbitals (GIAOs)44 rather than GSGT.
Appendix B: convergence between Ampère line integrals and current–surface integrals
A rectangular basis grid was set up in the (y, z) plane consisting of 50 × 100 points with a spacing of 0.01a0 in both dimensions and positioned such that the Li nucleus is centered on the right z edge between two grid points at a distance 0.005a0. The 2 × (100 + 50) − 4 = 296 boundary points {rbi}i∈{1,…,296} were used for the numerical line integration,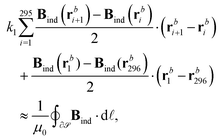 | (6) |
To approximate the surface integral over J, we have used the dual of the base grid which yields 49 × 99 = 4851 points {rdi}i∈{1,…,4851} centered in the squares of the basis grid such that
| Basis set | μ 0 −1 B ind·dl | J·ds | Difference |
|---|---|---|---|
| aug-cc-pVTZ | 3.83 | 4.00 | 0.17 |
| aug-cc-pVQZ | 4.21 | 4.34 | 0.13 |
| aug-cc-pV5Z | 4.41 | 4.47 | 0.05 |
Appendix C: convergence of open-line integrals for different line lengths
C.1 Total current flux in benzene
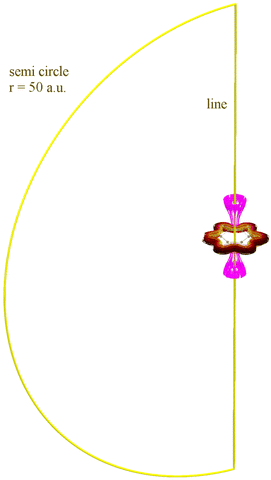
The total current flux in benzene has been numerically integrated by using the r.h.s. of eqn (1) with a set of points at a fixed distance of 0.05 a.u. The points are placed either symmetrically along the z axis (forming a line) or on a semicircle in the x, z plane. In each of the cases, they extend from −height to +height. The resulting line integral values are shown in Table 2. The value of the integral on the semicircle can serve as an indicator of the incompleteness of the finite line integral. Remarkably, an extension of ±100 a.u. is required to achieve numerical convergence to two digits accuracy of the current strength (which is recommended for intermediate results).| Height | Path integral for path | ||
|---|---|---|---|
| Semi circle | Line | Semicircle ∪ line | |
| 50 | 0.01821 | 11.20840 | 11.22661 |
| 100 | 0.00457 | 11.23570 | 11.24027 |
| 200 | 0.00107 | 11.24250 | 11.24357 |
| 400 | −0.00000 | 11.24420 | 11.24420 |
C.2 The flux in an infinitely thin wire loop obtained using the r.h.s. of eqn (1)
According to the Biot–Savart law, an infinitely thin wire loop of radius R placed onto the x, y plane, centered in the origin and sustaining current I yields a magnetic flux of | (7) |
 | (8) |
For R = 1 a.u., we obtain  . Thus, if we want to recover 99.9% of the total current (correct to one digit), z0 needs to extend already to more than 22 a.u.
For molecules with a more diffuse current density distribution and larger ring-current radii, it is plausible that in order to arrive at two digits accuracy, one has to integrate out to a hundred atomic units or more.
Acknowledgements
M. D. thanks the Finnish Cultural Foundation for the research grant. Computational resources were provided by the Finnish Grid and Cloud Infrastructure (persistent identifier urn:nbn:fi:research-infras-2016072533) and the CSC – IT Center for Science, Finland.Notes and references
- J. O. Hirschfelder, J. Chem. Phys., 1978, 68, 5151–5162 CrossRef CAS.
- P. Lazzeretti, Prog. Nucl. Magn. Reson. Spectrosc., 2000, 36, 1–88 CrossRef CAS.
- D. Sundholm, H. Fliegl and R. J. Berger, Wiley Interdiscip. Rev.: Comput. Mol. Sci., 2016, 6, 639–678 CAS.
- D. Sundholm, M. Dimitrova and R. J. F. Berger, Chem. Commun., 2021, 57, 12362–12378 RSC.
- M. Dimitrova and D. Sundholm, in Aromaticity: Modern Computational Methods and Applications, ed. I. Fernández, Elsevier, 2021, ch. 5 Search PubMed.
- J. A. N. F. Gomes, Phys. Rev. A: At., Mol., Opt. Phys., 1983, 28, 559–566 CrossRef CAS.
- T. A. Keith and R. F. W. Bader, J. Chem. Phys., 1993, 99, 3669–3682 CrossRef CAS.
- F. F. Summa, G. Monaco, R. Zanasi and P. Lazzeretti, J. Chem. Phys., 2022, 156, 154105 CrossRef CAS PubMed.
- T. J. P. Irons, A. Garner and A. M. Teale, Chemistry, 2021, 3, 916–934 CrossRef CAS.
- G. Monaco, F. F. Summa and R. Zanasi, J. Chem. Inf. Model., 2020, 61, 270–283 CrossRef PubMed.
- R. J. F. Berger, G. Monaco and R. Zanasi, J. Chem. Phys., 2020, 152, 194101 CrossRef CAS PubMed.
- P. Lazzeretti, Rend. Lincei. Sci. Fis. Nat., 2019, 30, 515–535 CrossRef.
- G. Monaco and R. Zanasi, J. Phys. Chem. A, 2019, 123, 1558–1569 CrossRef CAS PubMed.
- P. Lazzeretti, Challenges and Advances in Computational Chemistry and Physics, Springer International Publishing, 2016, pp. 151–226 Search PubMed.
- S. Pelloni, P. Lazzeretti, G. Monaco and R. Zanasi, Rend. Fis. Accad. Lincei, 2011, 22, 105–112 CrossRef.
- S. Pelloni, R. Carion, V. Liégeois and P. Lazzeretti, J. Comput. Chem., 2011, 32, 1599–1611 CrossRef CAS.
- S. Pelloni and P. Lazzeretti, Int. J. Quantum Chem., 2010, 111, 356–367 CrossRef.
- S. Pelloni, P. Lazzeretti and R. Zanasi, Theor. Chem. Acc., 2009, 123, 353–364 Search PubMed.
- S. Pelloni and P. Lazzeretti, Chem. Phys., 2009, 356, 153–163 CrossRef CAS.
- S. Pelloni and P. Lazzeretti, J. Phys. Chem. A, 2008, 112, 5175–5186 CrossRef CAS.
- S. Pelloni and P. Lazzeretti, J. Chem. Phys., 2008, 128, 194305 CrossRef.
- S. Pelloni, P. Lazzeretti and R. Zanasi, J. Phys. Chem. A, 2007, 111, 8163–8169 CrossRef CAS.
- S. Pelloni and P. Lazzeretti, Theor. Chem. Acc., 2007, 118, 89–97 Search PubMed.
- S. Pelloni and P. Lazzeretti, Theor. Chem. Acc., 2006, 117, 903–913 Search PubMed.
- S. Pelloni, P. Lazzeretti and R. Zanasi, J. Phys. Chem. A, 2007, 111, 3110–3123 CrossRef CAS PubMed.
- S. Pelloni, F. Faglioni, R. Zanasi and P. Lazzeretti, Phys. Rev. A: At., Mol., Opt. Phys., 2006, 74, 012506 CrossRef.
- R. J. F. Berger, M. Dimitrova, R. T. Nasibullin, R. R. Valiev and D. Sundholm, Phys. Chem. Chem. Phys., 2022, 624–628 RSC.
- Z. Chen, C. S. Wannere, C. Corminboeuf, R. Puchta and P. Schleyer, Chem. Rev., 2005, 105, 3842–3888 CrossRef CAS PubMed.
- C. Foroutan-Nejad, J. Vícha and A. Ghosh, Phys. Chem. Chem. Phys., 2020, 22, 10863–10869 RSC.
- B. J. R. Cuyacot and C. Foroutan-Nejad, Nature, 2022, 603, E18–E20 CrossRef CAS PubMed.
- R. M. Stevens and W. N. Lipscomb, J. Chem. Phys., 1964, 40, 2238–2247 CrossRef CAS.
- J. W. Reyn, ZAMP, 1964, 15, 540–557 Search PubMed.
- K. Collard and G. G. Hall, Int. J. Quantum Chem., 1977, 12, 623–637 CrossRef CAS.
- M. J. Frisch, G. W. Trucks, H. B. Schlegel, G. E. Scuseria, M. A. Robb, J. R. Cheeseman, G. Scalmani, V. Barone, G. A. Petersson, H. Nakatsuji, X. Li, M. Caricato, A. V. Marenich, J. Bloino, B. G. Janesko, R. Gomperts, B. Mennucci, H. P. Hratchian, J. V. Ortiz, A. F. Izmaylov, J. L. Sonnenberg, D. Williams-Young, F. Ding, F. Lipparini, F. Egidi, J. Goings, B. Peng, A. Petrone, T. Henderson, D. Ranasinghe, V. G. Zakrzewski, J. Gao, N. Rega, G. Zheng, W. Liang, M. Hada, M. Ehara, K. Toyota, R. Fukuda, J. Hasegawa, M. Ishida, T. Nakajima, Y. Honda, O. Kitao, H. Nakai, T. Vreven, K. Throssell, J. A. Montgomery, Jr., J. E. Peralta, F. Ogliaro, M. J. Bearpark, J. J. Heyd, E. N. Brothers, K. N. Kudin, V. N. Staroverov, T. A. Keith, R. Kobayashi, J. Normand, K. Raghavachari, A. P. Rendell, J. C. Burant, S. S. Iyengar, J. Tomasi, M. Cossi, J. M. Millam, M. Klene, C. Adamo, R. Cammi, J. W. Ochterski, R. L. Martin, K. Morokuma, O. Farkas, J. B. Foresman and D. J. Fox, Gaussian 16 (Revision C.01), Gaussian, Inc., Wallingford CT, 2019 Search PubMed.
- A. D. Becke, J. Chem. Phys., 1993, 98, 5648–5652 CrossRef CAS.
- C. Lee, W. Yang and R. G. Parr, Phys. Rev. B: Condens. Matter Mater. Phys., 1988, 37, 785–789 CrossRef CAS.
- B. P. Prascher, D. E. Woon, K. A. Peterson, T. H. Dunning and A. K. Wilson, Theor. Chem. Acc., 2010, 128, 69–82 Search PubMed.
- J. R. Cheeseman, G. W. Trucks, T. A. Keith and M. J. Frisch, J. Chem. Phys., 1996, 104, 5497–5509 CrossRef CAS.
- J. Jusélius, D. Sundholm and J. Gauss, J. Chem. Phys., 2004, 121, 3952–3963 CrossRef.
- M. Dimitrova and D. Sundholm, in Aromaticity: Modern Computational Methods and Applications, ed. I. Fernández, Elsevier, 2021, ch. 5 Search PubMed.
- J. Jusélius, D. Sundholm and co-workers, GIMIC, Gauge-Including Magnetically Induced Currents, a program for calculating of magnetically induced current density. Available from https://github.com/qmcurrents/gimic/.
- M. Rauhalahti, S. Taubert, D. Sundholm and V. Liegeois, Phys. Chem. Chem. Phys., 2017, 19, 7124–7131 RSC.
- J. Ahrens, B. Geveci and C. Law, ParaView: An End-User Tool for Large Data Visualization, Visualization Handbook, Elsevier, 2005, ISBN-13: 978-0123875822, see also: https://www.paraview.org Search PubMed.
- F. London, Z. Phys., 1930, 63, 245–279 CrossRef CAS.
Footnotes |
| † According to Reyn,32 these two stagnation points can be classified as “three-branched saddle-node with stable two branched plane node” and they are connected by a heteroclinic streamline. |
| ‡ The Collard–Hall index gives rank r and signature s of the Jacobian as an ordered pair (r,s) where s is the sum of the signs of the eigenvalues.33 |
| This journal is © the Owner Societies 2022 |

