 Open Access Article
Creative Commons Attribution 3.0 Unported Licence
An ab initio study of the rovibronic spectrum of sulphur monoxide (SO): diabatic vs. adiabatic representation†
R. P.
Brady
 a,
S. N.
Yurchenko
 *a,
G.-S.
Kim
 b,
W.
Somogyi
a and
J.
Tennyson
 a
a
aDepartment of Physics and Astronomy, University College London, Gower Street, WC1E 6BT London, UK. E-mail: s.yurchenko@ucl.ac.uk
bDharma College, Dongguk University, 30, Pildong-ro 1-gil, Jung-gu, Seoul 04620, Korea
First published on 23rd September 2022
Abstract
We present an ab initio study of the rovibronic spectra of sulphur monoxide (32S16O) using internally contracted multireference configuration interaction (ic-MRCI) method and aug-cc-pV5Z basis sets. It covers 13 electronic states X3Σ−, a1Δ, b1Σ+, c1Σ−, A′′3Σ+, A′3Δ, A3Π, B3Σ−, C3Π, d1Π, e1Π, C′3Π, and (3)1Π ranging up to 66![[thin space (1/6-em)]](https://www.rsc.org/images/entities/char_2009.gif) 800 cm−1. The ab initio spectroscopic model includes 13 potential energy curves, 23 dipole and transition dipole moment curves, 23 spin–orbit curves, and 14 electronic angular momentum curves. A diabatic representation is built by removing the avoided crossings between the spatially degenerate pairs C3Π–C′3Π and e1Π–(3)1Π through a property-based diabatisation method. We also present non-adiabatic couplings and diabatic couplings for these avoided crossing systems. All phases for our coupling curves are defined, and consistent, providing the first fully reproducible spectroscopic model of SO covering the wavelength range longer than 147 nm. Finally, an ab initio rovibronic spectrum of SO is computed.
800 cm−1. The ab initio spectroscopic model includes 13 potential energy curves, 23 dipole and transition dipole moment curves, 23 spin–orbit curves, and 14 electronic angular momentum curves. A diabatic representation is built by removing the avoided crossings between the spatially degenerate pairs C3Π–C′3Π and e1Π–(3)1Π through a property-based diabatisation method. We also present non-adiabatic couplings and diabatic couplings for these avoided crossing systems. All phases for our coupling curves are defined, and consistent, providing the first fully reproducible spectroscopic model of SO covering the wavelength range longer than 147 nm. Finally, an ab initio rovibronic spectrum of SO is computed.
1 Introduction
Sulphur monoxide (SO) has many experimental and observational applications, making it a molecule of continuing interest in spectroscopic and kinetic studies. SO is an important intermediate in the oxidation of sulphur compounds within combustion reactions,1 making SO studies applicable to environmental chemistry since sulphur oxides lead to the acidification/pollution of Earth's atmosphere.2–5 Burkholder et al.6 show the importance of SO within chemical reactions of Earth's atmosphere due to its high reactivity and chemical involvement with N2 and O2. Additionally, UV lasing in SO was demonstrated through optically pumping transitions within the B3Σ−–X3Σ− electronic band7 and then later for UV energy storage lasers.8 SO also has astrophysical importance, its Zeeman splitting has been used to probe the magnetic fields of dense star-forming regions, such as the Orion molecular cloud, for field strengths ≥10−2 G9,10 and its presence within warm chemistry's mean it is an excellent shock tracer.11,12The frontier orbitals of SO resemble that of carbon monoxide where the two π* valence electrons mean SO has a X3Σ− ground state similar to O2 and S2. Being isoelectronic with O2, SO has two low-lying metastable a1Δ and b1Σ+ states which are relatively short lived due to large spin–orbit coupling. SO has been subject to pure rotational,13–15 electronic,16–20 and ro-vibrational21–23 experimental spectroscopic studies. More recently, Bernath et al.24,25 produced empirical line lists for the b1Σ+–X3Σ− and a1Δ–X3Σ− rovibronic bands and for the X3Σ− and a1Δ rovibrational bands of SO. The literature also contains many theoretical studies of SO, the most comprehensive, and one we compare to often, being Yu and Bian26 who give spectroscopic constants on all electronic states we consider here (except (3)1Π) computed through internally contracted multireference configuration interaction (ic-MRCI) methods using aug-cc-pV5Z basis sets. Another important theoretical work is by Sarka and Nanbu27 who study the UV region of SO non-adiabatically where they compute PECs, DMCs, and non-adiabatic couplings (NACs) for the X3Σ−, A3Π, B3Σ−, C3Π, C′3Π, (3)3Σ−, (4)3Π, and (5)3Π states at a MRCI-F12+Q level of theory using aug-cc-pV(5+d)Z basis sets. Sarka and Nanbu27 are also the first to compute cross-sections for SO longer than 190 nm in the UV.
Despite the strong experimental, theoretical, and observational baseline for SO, to this date the existing spectroscopic line list data for SO are limited in coverage. HITRAN28 contains only transitions between electronic states X3Σ−, a1Δ and b1Σ+ considering relatively low vibrational excitations. SO data and spectroscopic databases NIST29 and CDMS30 contain data covering the microwave region only. In this study we aim to provide a strong theoretical base from which an accurate spectroscopic description of SO with large coverage can be made through the refinement of our ab initio model to empirically determined energies in a future work. To achieve this we calculate ab initio potential energy curves (PECs), spin–orbit curves (SOCs), electronic angular momentum curves (EAMCs), and electric (transition) dipole moment curves ((T)DMCs) for the 13 lowest electronic states of SO (X3Σ−, a1Δ, b1Σ+, c1Σ−, A′3Δ, A′′3Σ+, A3Π, B3Σ−, C3Π, d1Π, e1Π, C′3Π, (3)1Π) at an MRCI level of theory using aug-cc-pV5Z basis sets. The relative phases of the the non-diagonal couplings and transition dipole moments provided are fully self-consistent,31 which is crucial for reproducible spectroscopic studies.
Our ab initio curves of SO are adiabatic as computed under the Born–Oppenheimer approximation32 and so the spatially degenerate states e1Π, (3)1Π and C3Π, C′3Π of SO exhibit avoided crossings due to their shared symmetries, where the non-adiabatic effects play important role. The associated non-adiabatic couplings (NACs) arise from the nuclear motion kinetic energy operator acting on electronic wavefunctions and contain first- and second-order differential operators with respect to the nuclear coordinates. Inclusion of NACs within numerical dynamics calculations are computationally costly when using analytical forms for the PECs and couplings because of both the cusp-like nature of PECs and the NACs having singularities at the region of spatial degeneracy.33–36 This makes the fitting of analytical forms to the PECs and couplings almost impossible. Here we explore a diabatisation procedure to transform the adiabatic basis to the diabatic basis using NACs reconstructed from PECs as opposed to obtaining them ab initio,27 where the adiabatic first-order differential couplings are negligible or vanish, at the cost of inducing off-diagonal potential energy couplings,37 or diabatic couplings (DCs).33,34 In this representation, the electronic wavefunctions are smooth which lessens both numerical problems encountered in calculations within the adiabatic representation and the computational cost in computing NACs. Diabatisation helps recover non-Born–Oppenheimer dynamics34,38 and is important for processes such as collisions between open-shell molecules with spatially degenerate electronic states.35,39–42 The importance of the non-adiabatic effects on the spectral properties of SO is analysed.
2 Computational details
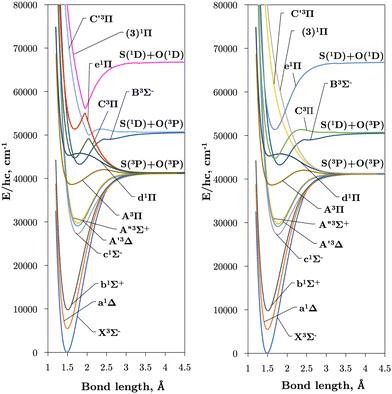
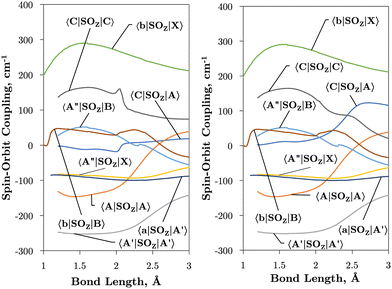
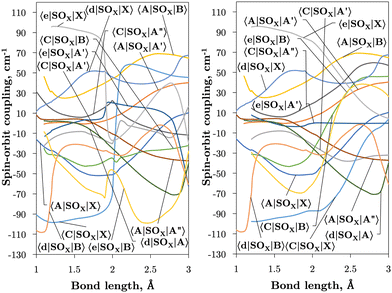
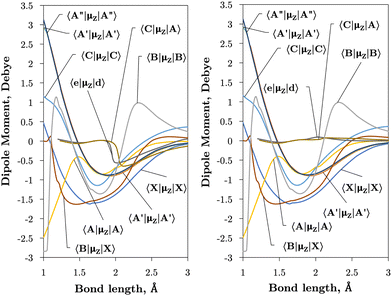
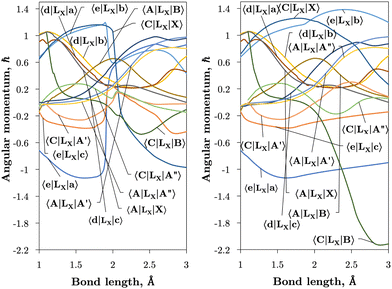
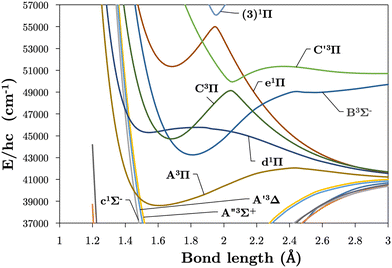
Internally-contracted multi-reference configuration interaction (icMRCI) ab initio calculations for the 13 lowest states of SO correlating with S(3P) + O(3P), S(1D) + O(3P) and S(1D) + O(1D) were performed using Molpro43 with aug-cc-pV5Z basis sets,44,45 using molecular orbitals obtained from state-averaged complete active space self-consistent field (CASSCF) calculations. Under C2V point group symmetry all ab initio calculations started with 14 (8σ, 3πx, 3πy) orbitals which included 6 closed (4σ, 1πx, 1πy) orbitals. The active space occupying 12 active electrons consisted of 8 (5σ–8σ, 2π, 3π) valence orbitals. The PECs, including the 8 bound states X3Σ−, a1Δ, b1Σ+, c1Σ−, A′′3Σ+, A′3Δ, A3Π, and B3Σ− are shown in Fig. 1, as well as the adiabatic e1Π–(3)1Π and C3Π–C′3Π systems. The EAMC, SOCs (both diagonal and non-diagonal), DMCs (diagonal and transition) computed and used later for cross-section calculations are shown in Fig. 2–6 in the original adiabatic representation as computed by Molpro 201543 (left) and the diabatic representation (right). Further discussion of the diabatisation is given in the next section.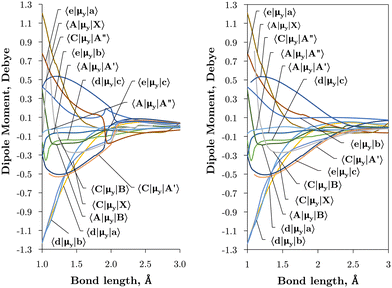 | ||
| Fig. 5 Ab initio transition dipole moment curves (Debye) between states of different symmetry in the adiabatic (left) and diabatic (right) representations as a function of the bond length (Å). | ||
3 Diabatisation
3.1 Non-adiabatic couplings (NACs)
The commonly employed Born–Oppenheimer approximation assumes the nuclear dynamics evolve adiabatically on a single, uncoupled electronic potential energy surface. This results in the appearance of avoided crossings between electronic states that are degenerate in energy at some geometry and large gradients in couplings connecting these states. The Born–Huang expansion46 allows one to recover the non-adiabatic behaviour in the region of the avoided crossing by including non-adiabatic couplings (NACs) which introduce off-diagonal kinetic energy terms in the molecular Hamiltonian. An alternative approach is to transform the electronic Hamiltonian to the diabatic basis, where electronic states are coupled via off-diagonal potential energy terms, termed diabatic couplings (DCs).33,34,37 The transformation from the adiabatic to the diabatic basis is described by a unitary matrix U, which is parametrically dependent on the NAC term, | (1) |
 35,47–49
 | (2) |
Writing the two-state electronic Hamiltonian in terms of the adiabatic potential energy curves Va1(R) and Va2(R),
 | (3) |
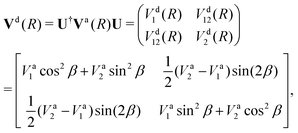 | (4) |
The NAC can be computed via quantum-chemistry methods from the electronic wavefunctions, as done by Sarka and Nanbu27 for SO. It is symmetrical with a cusp at the crossing point Rc. Alternatively, the NAC curves are modelled using, e.g. a Lorentzian,50 as given by
 | (5) |
 | (6) |
 is applied. Fig. 7 illustrates the C3Π–C′3Π NAC modelled in this work using a Lorentzian and Laplacian function. The mixing angle β(R), determined through eqn (2), ranges from 0 to π/2 going through π/4 at the crossing point R = Rc can also be seen in Fig. 7.
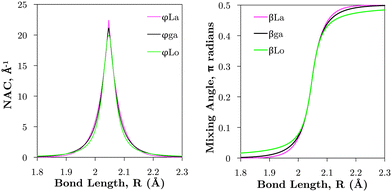 | ||
| Fig. 7 Comparison of example NACs (ϕij) and corresponding diabatic mixing angles (β) between the Lorentzian (‘Lo’), Laplacian (‘La’), and geometrically averaged (‘ga’) cases as described in the text. These curves are computed for the C3Π and C′3Π non-adiabatic interaction (see Section 3.2.1 and Fig. 1). | ||
The Lorentzian was shown to provide a good description of the ab initio NACs around the crossing point48,49,51,52 (see Fig. 7) but diverges at large distances R from Rc causing improper shaped diabatic PECs by decaying too slowly.48,49,51,53 It has been discussed that some damping functions can be introduced to correct the Lorentzian's slow decay using properties such as dipole moments, but determination of their fitting parameters is both difficult and requires extra calculations.50,51 Laplacians underestimate NACs far in the wings and overestimate them near the crossing point.48 One can show that NACs have an overlap dependence on the internuclear separation,51,54R, which is given properly by a Laplacian.48 The undesirable features of these NAC models can be mitigated by their combination48,49,51,53 to which we base our diabatisation procedure on. Our method of augmenting the Lorentzian with a Laplacian is discussed in Section 3.2.
3.2 Diabatisation
Here we explore the so-called ‘property based diabatisation’ method35 and construct diabatic potentials using the condition of having no avoiding crossing, which we define as to minimise their second derivatives in the vicinity of the crossing point Rc: | (7) |
In order to mitigate the undesirable properties of the Lorentzian and Laplacian functional forms, we follow the approach by An and Baeck48 and represent the mixing angle β by the following combination of the mixing angles determined from the Lorentzian and Laplacian NACs in eqn (2), βLo(R) and βLa(R)
 | (8) |
| α × γ = 1.397 | (9) |
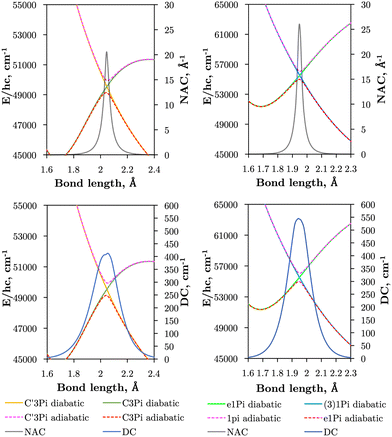
Where our method diverges from that of An and Baeck48 is in the determination of the crossing point Rc and the Lorentzian parameter α. An and Baeck48 obtained Rc and α through fitting a Lorentzian to a NAC computed with Molpro. Instead, we determine a set of parameters {Rc,α} by fulfilling the condition given in eqn (7), to which the Laplacian parameter γ is instantly obtained through eqn (9). Using the theory developed in Section 3.1 and eqn (8) the diabatising transformation Uga corresponding to the ‘geometrically averaged’ NAC is found. With this the diabatic potential energies and DC elements can be obtained through the simple matrix transformation in eqn (4). The diabatic PECs for SO can be seen in Fig. 1 and a closeup of the avoided crossings between the e1Π–(3)1Π and C3Π–C′3Π states of SO superimposed with their DCs, Vgaij, and NACs, ϕgaij, are illustrated in Fig. 8. Fig. 8 shows that the pair of singlet states are coupled more strongly than the triplet states, and also reveals the DCs to be slightly asymmetric. This is to be expected since the DCs depend on the difference Va2–Va1 which can be asymmetrical in nature. We see an effect of this especially in the DC between the triplet states where the adiabatic PEC turning points are offset to each other by ∼0.01 Å.
Table 1 provides values for the optimized NAC parameters α,γ,Rc used to diabatise the energy degenerate pairs, which are visualised in Fig. 8. We see that the effect of diabatisation is to smooth the PECs, as enforced by eqn (7) with no avoided-crossing. The non-Born–Oppenheimer dynamics, initially manifested in the nuclear kintetic energy, has been rotated into the potential and coupling terms connecting the non-adiabatically interacting states. We now produce PECs that can be easily modelled by analytical forms in the diabatic representation, allowing us to tune them to experimental data in a future study where we aim to produce an empirically accurate line list.
| State | α | γ | R c (Å) |
|---|---|---|---|
| e1Π | 52.422 | 0.027 | 1.949 |
| C3Π | 39.859 | 0.035 | 2.047 |
Table 2 compares the equilibrium potential energies, Te (cm−1), equilibrium bond lengths, Re (Å), and dissociation energies, De (eV), of the 11 lowest singlet and triplet states of SO determined directly from the ab initio adiabatic PECs presented in Fig. 1 to both calculations26,27,56–58 and experiment.24,57,59–61 Our bond lengths show good agreement to both theoretical and empirical values, with better agreement to experiment than previous calculations for the b1Σ+, A3Π, and d1Π states. Worse agreements are seen for our Te values, the most accurate being Te(A3Π), Te(C3Π), and Te(e1Π) within 152 cm−1, 210 cm−1, and 338 cm−1 of experiment respectively. Lastly, we see worse agreements between our ab initio dissociation energies to both experiment and calculations, to which we underestimate. It is apparent that our dissociation asymptotes are the major source of inaccuracy in our ab initio SO model and probably arise because we do not include Sulfur specific diffuse functions in our basis set during ab initio calculations. A future goal will be to mitigate the undesirable PEC features by refining our ab initio model to experimental transition data, to which we will address when producing the final SO line list. We note that the reported Bernath et al.24Re values in Table 2 were derived from the Bν=0 rotational constant, and show close agreements to within 0.006 cm−1 Å and 0.002 cm−1 Å to our bond lengths for the a1Δ and b1Σ+ respectively. Our fundamental vibrational energy of the X3Σ− state is found approximately 30 cm−1 too high from the experiment, which is to be expected with MRCI calculations, and provides insight to the accuracy of the other computed states and couplings, which will also require empirical tuning.
| State | T e (cm−1) | D e (eV) | R e (Å) | State | T e (cm−1) | D e (eV) | R e (Å) |
|---|---|---|---|---|---|---|---|
| X3Σ− | 0 | 5.1253 | 1.4821 | A′3Δ | 29![[thin space (1/6-em)]](https://www.rsc.org/images/entities/char_2009.gif) 097.8878 097.8878 |
1.503 | 1.7571 |
| Calc.26 | 0 | 5.418 | 1.4865 | Calc.26 | 29![[thin space (1/6-em)]](https://www.rsc.org/images/entities/char_2009.gif) 828 828 |
1.72 | 1.7649 |
| Expt.59 | 5.429 | 1.481 | B3Σ− | 43![[thin space (1/6-em)]](https://www.rsc.org/images/entities/char_2009.gif) 255.0097 255.0097 |
0.9212 | 1.8121 | |
| Calc.27 | 0 | 5.475 | 1.4925 | Calc.27 | 41![[thin space (1/6-em)]](https://www.rsc.org/images/entities/char_2009.gif) 706.5886 706.5886 |
1.4022 | 1.7868 |
| Expt.60 | 1.481 | Calc.26 | 41![[thin space (1/6-em)]](https://www.rsc.org/images/entities/char_2009.gif) 314 314 |
1.387 | 1.782 | ||
| Calc.56 | 1.481 | Expt.60 | 41![[thin space (1/6-em)]](https://www.rsc.org/images/entities/char_2009.gif) 629 629 |
1.41062 | 1.775 | ||
| Calc.58 | 1.493 | Calc.58 | 41![[thin space (1/6-em)]](https://www.rsc.org/images/entities/char_2009.gif) 206 206 |
1.794 | |||
| a1Δ | 5479.8013 | 4.4486 | 1.4979 | d1Π | 45![[thin space (1/6-em)]](https://www.rsc.org/images/entities/char_2009.gif) 309.0766 309.0766 |
0.0587 | 1.545 |
| Calc.26 | 5936 | 4.682 | 1.4945 | Calc.26 | 44![[thin space (1/6-em)]](https://www.rsc.org/images/entities/char_2009.gif) 166 166 |
0.189 | 1.5475 |
| Expt.59 | 5873 | 4.647 | 1.4919 | Expt.57 | 43![[thin space (1/6-em)]](https://www.rsc.org/images/entities/char_2009.gif) 902 902 |
0.195 | 1.5303 |
| Calc.58 | 5883 | 1.502 | Calc.58 | 44![[thin space (1/6-em)]](https://www.rsc.org/images/entities/char_2009.gif) 975 975 |
0.059 | 1.723 | |
| Expt.24 | 1.4920 | Calc.57 | 44![[thin space (1/6-em)]](https://www.rsc.org/images/entities/char_2009.gif) 471 471 |
0.14 | 1.553 | ||
| b1Σ+ | 9774.1938 | 3.9154 | 1.5057 | A′′3Σ+ | 29![[thin space (1/6-em)]](https://www.rsc.org/images/entities/char_2009.gif) 731.2077 731.2077 |
1.4417 | 1.765 |
| Calc.26 | 10![[thin space (1/6-em)]](https://www.rsc.org/images/entities/char_2009.gif) 548 548 |
4.112 | 1.5062 | Calc.26 | 30![[thin space (1/6-em)]](https://www.rsc.org/images/entities/char_2009.gif) 495 495 |
1.637 | 1.7701 |
| Expt.59 | 10![[thin space (1/6-em)]](https://www.rsc.org/images/entities/char_2009.gif) 510 510 |
4.137 | 1.5001 | Expt.61 | 30![[thin space (1/6-em)]](https://www.rsc.org/images/entities/char_2009.gif) 692 692 |
||
| Calc.58 | 10![[thin space (1/6-em)]](https://www.rsc.org/images/entities/char_2009.gif) 576 576 |
1.514 | Calc.58 | 30![[thin space (1/6-em)]](https://www.rsc.org/images/entities/char_2009.gif) 025 025 |
1.776 | ||
| Expt.24 | 1.5035 | C3Π | 44![[thin space (1/6-em)]](https://www.rsc.org/images/entities/char_2009.gif) 719.2593 719.2593 |
0.5489 | 1.6786 | ||
| A3P | 38![[thin space (1/6-em)]](https://www.rsc.org/images/entities/char_2009.gif) 607.6737 607.6737 |
0.4246 | 1.6079 | Calc.26 | 44![[thin space (1/6-em)]](https://www.rsc.org/images/entities/char_2009.gif) 033 033 |
0.609 | 1.6692 |
| Calc.27 | 38![[thin space (1/6-em)]](https://www.rsc.org/images/entities/char_2009.gif) 879.2948 879.2948 |
0.6441 | 1.5946 | Calc.27 | 44![[thin space (1/6-em)]](https://www.rsc.org/images/entities/char_2009.gif) 909.0901 909.0901 |
0.6027 | 1.6727 |
| Calc.26 | 38![[thin space (1/6-em)]](https://www.rsc.org/images/entities/char_2009.gif) 334 334 |
0.665 | 1.6196 | Expt.57 | 44![[thin space (1/6-em)]](https://www.rsc.org/images/entities/char_2009.gif) 381 381 |
1.654 | |
| Expt.59 | 38![[thin space (1/6-em)]](https://www.rsc.org/images/entities/char_2009.gif) 455 455 |
0.662 | 1.609 | Calc.58 | 44![[thin space (1/6-em)]](https://www.rsc.org/images/entities/char_2009.gif) 038 038 |
1.681 | |
| Calc.56 | 38![[thin space (1/6-em)]](https://www.rsc.org/images/entities/char_2009.gif) 880 880 |
1.613 | e1Π | 51![[thin space (1/6-em)]](https://www.rsc.org/images/entities/char_2009.gif) 347.9346 347.9346 |
0.4524 | 1.6864 | |
| Calc.58 | 38![[thin space (1/6-em)]](https://www.rsc.org/images/entities/char_2009.gif) 931 931 |
1.719 | Calc.26 | 51![[thin space (1/6-em)]](https://www.rsc.org/images/entities/char_2009.gif) 224 224 |
0.45 | 1.6826 | |
| c1Σ− | 27![[thin space (1/6-em)]](https://www.rsc.org/images/entities/char_2009.gif) 274.9752 274.9752 |
1.7679 | 1.7571 | Expt.57 | 51![[thin space (1/6-em)]](https://www.rsc.org/images/entities/char_2009.gif) 558 558 |
1.6774 | |
| Calc.26 | 28![[thin space (1/6-em)]](https://www.rsc.org/images/entities/char_2009.gif) 544 544 |
1.879 | 1.7617 | Calc.58 | 51![[thin space (1/6-em)]](https://www.rsc.org/images/entities/char_2009.gif) 258 258 |
1.685 |
The intersections between states of different symmetries obtained in our calculations can be seen in Fig. 9. The d1Π and C3Π states cross at 1.59 and 1.82 Å, d1Π and B3Σ− at 1.64 and 2.20 Å, both agreeing with Yu and Bian26 intersection locations of 1.62 and 1.80 Å and 1.60 and 2.14 Å, respectively. The intersection of the e1Π with the B3Σ− state occurs at 2.4 Å in our calculations, somewhat larger than the value of 2.3 Å reported by Yu and Bian.26 Since the e1Π and d1Π states become repulsive at 1.92 Å and 1.9 Å respectively, crossings beyond these geometries provide potential predissociation pathways for the C3Π and B3Σ− states. Yu and Bian26 also show that the C′3Π state crosses the B3Σ− state at 2.25 Å, to which they state predissociation of B3Σ− through this C′3Π state is possible. Sarka and Nanbu27 also give intersections R(C,B) = 1.57,2.21 Å as opposed to our values of R(C,B) = 1.67, 2.18 Å.
Lastly, we report further crossings between the c1Σ−, A′3Δ, and A′′3Σ+ states and the A3Π and d1Π states of SO at R(c,A) = 1.46 Å, R(A′,A) = 1.48 Å, R(A′′,A) = 1.50 Å, R(c,d) = 1.40 Å, R(A′,d) = 1.42 Å, and R(A′′,d) = 1.43 Å. These crossings agree with those reported by Yu and Bian26 between c1Σ−, A′3Δ, and A′′3Σ+ with A3Π in the region 1.47–1.51 Å and crossings between c1Σ−, A′3Δ, A′′3Σ+ with d1Π in the region 1.42–1.45 Å.
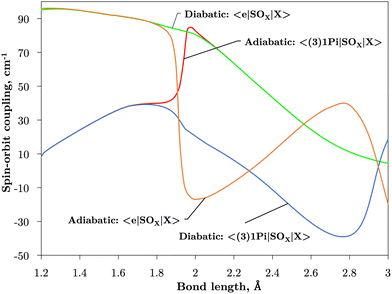
Fig. 2 and 3 plot the z (SOz) and x (SOx) components of the spin–orbit curves of SO over nuclear geometries where the former couple states of same values of Λ (projection of the electronic angular momentum) and the latter couple states of different Λ. We see again that the effect of diabatisation is to smooth out the curves over R, where avoided crossings in the adiabatic picture create steep gradients around the avoided crossing. An example of the diabatisation process can be seen for the 〈e1Π|SOx|X3Σ−〉 and 〈(3)1Π|SOx|X3Σ−〉 pair in Fig. 10. Spin–orbit matrix elements at the internuclear separation of the PEC crossings are important in determining the possible spin–orbit induced predissociation mechanisms that occur between states of different spin multiplicity26 (see Discussion below). Referring to the spin–orbit couplings 〈e1Π|SOx|B3Σ−〉 and 〈d1Π|SOx|B3Σ−〉 in Fig. 3 with the magnitudes of approximately 90 and 20–30 cm−1, respectively, the predissociation of the B3Σ− state through d1Π is likely to be very weak, but will be stronger through the e1Π state. The construction of diabatic SOCs will hence influence the efficiency of pre-dissociation pathways between states of different symmetry (Table 3).
| SO coupling | bra Σ | ket Σ | SO coupling | bra Σ | ket Σ | SO coupling | bra Σ | ket Σ |
|---|---|---|---|---|---|---|---|---|
| 〈A3Π|SOx|X3Σ−〉 | 0 | 1 | 〈e1Π|SOx|X3Σ−〉 | 0 | 1 | 〈b1Σ+|SOz|B3Σ−〉 | 0 | 0 |
| 〈A3Π|SOx|A′3Δ〉 | 0 | 1 | 〈e1Π|SOx|B3Σ−〉 | 0 | 1 | 〈A′3Δ|SOz|A′3Δ〉 | 1 | 1 |
| 〈C3Π|SOx|A′3Δ〉 | 0 | 1 | 〈C3Π|SOx|A′′3Σ+〉 | 0 | 1 | 〈A′′3Σ+|SOz|X3Σ−〉 | 1 | 1 |
| 〈A3Π|SOx|B3Σ−〉 | 0 | 1 | 〈e1Π|SOx|A′3Δ〉 | 0 | 1 | 〈C3Π|SOz|A3Π〉 | 1 | 1 |
| 〈C3Π|SOx|X3Σ−〉 | 0 | 1 | 〈d1Π|SOx|X3Σ−〉 | 0 | 1 | 〈A3Π|SOz|A3Π〉 | 1 | 1 |
| 〈C3Π|SOx|B3Σ−〉 | 0 | 1 | 〈d1Π|SOx|B3Σ−〉 | 0 | 1 | 〈A′′3Σ+|SOz|B3Σ−〉 | 1 | 1 |
| 〈A3Π|SOx|A′′3Σ+〉 | 0 | 1 | 〈b1Σ+|SOz|X3Σ−〉 | 0 | 0 | 〈C3Π|SOz|C3Π〉 | 1 | 1 |
| 〈d1Π|SOx|A′3Δ〉 | 0 | 1 | 〈a1Δ|SOz|A′3Δ〉 | 0 | 0 |
The vibronic intensities are directly affected by the derivatives of the dipole moment with respect to the internucelar separation, R. Since adiabatic curves are prone to strong, steep-gradient variations around avoided crossings, even small inaccuracies in ab initio calculations (including the position of the crossing and the corresponding NAC) can lead to large errors in spectral properties of the molecule. For example, the adiabatic 〈C3Π|DM|X3Σ−〉 dipole moment has a steep gradient at around 2 Å which can be expected to be due to the avoiding crossing between C3Π and C′3Π states, therefore the C3Π–X3Σ− electronic band is expected to be sensitive to the quality of its adiabatic description. The diabatic representation can also be sensitive to the quality of the corresponding curves, but to a significantly lesser extend due to their smooth character.
Comparison with the 〈A3Π|μx|X3Σ−〉, 〈C3Π|μx|X3Σ−〉, and 〈B3Σ−|μz|X3Σ−〉 transition dipoles provided by Sarka and Nanbu27 shows excellent agreements up to dissociation, with values ({ours, Sarka and Nanbu27}) at the ground state equilibrium geometry Re(X3Σ−) = 1.48 Å of {0.16,0.18} D, {0.333,0.337} D, {1.623,1.633} D, respectively.
3.3 Nuclear motion calculations
Duo63 is a general purpose variational (open access‡) code that solves the rovibronic Schrödinger equation for diatomics while allowing an arbitrary number of couplings between various electronic states including spin-spin, spin–orbit, spin-rotation, and rotational Born–Oppenheimer breakdown curves. It is assumed one has solved the Schrödinger equation for the electronic motion a priori in order to obtain PECs, SOCs, EAMCs, (T)DMCs etc. for the electronic states in question. These curves can be supplied to the program as either a grid of ab initio points, or in an analytical form. After solving the Schrödinger equation for the nuclear motion Duo obtains eigenstates and energies for the good quantum numbers J (total angular momentum), and τ (parity); other quantum numbers are assigned on the basis of the largest coefficient in the basis set. The eigenfunctions are used to compute transition line strengths and Einstein A coefficients in order to obtain a complete spectroscopy for the system in question. A detailed methodology of Duo is given by Duo.3.4 The ab initio SO spectrum
Using the diabatic spectroscopic model we produce an ab initio rovibronic spectrum of SO for the system involving the lowest 11 singlet and triplet electronic states of SO covering the wavelength range up to 147 nm. The ‘active’ couplings within the spectrosocpic model used for cross-section calculations include 23 SOCs, 23 (transition) DMCs, and 14 EAMCs in-line with the couplings shown in Fig. 2–6. The vibrational sinc-DVR basis set was defined for a grid of 701 internuclear geometries in the range 0.6–6.0 Å. We select 58, 58, 49, 11, 31, 41, 27, 27, 14, 20, and 36 vibrational wavefunctions for the X3Σ−, a1Δ, b1Σ+, A3Π, B3Σ−, c1Σ−, A′′3Σ+, A′3Δ, C3Π, d1Π, and e1Π, respectively, to form the contracted vibronic basis. In total 15![[thin space (1/6-em)]](https://www.rsc.org/images/entities/char_2009.gif) 364
364![[thin space (1/6-em)]](https://www.rsc.org/images/entities/char_2009.gif) 624 Einstein A coefficients between 119
624 Einstein A coefficients between 119![[thin space (1/6-em)]](https://www.rsc.org/images/entities/char_2009.gif) 600 bound rovibronic states were computed with a maximum total rotational quantum number Jmax = 180 and used to simulate rovibronic absorption spectra at a given temperature using the program ExoCross.64
600 bound rovibronic states were computed with a maximum total rotational quantum number Jmax = 180 and used to simulate rovibronic absorption spectra at a given temperature using the program ExoCross.64
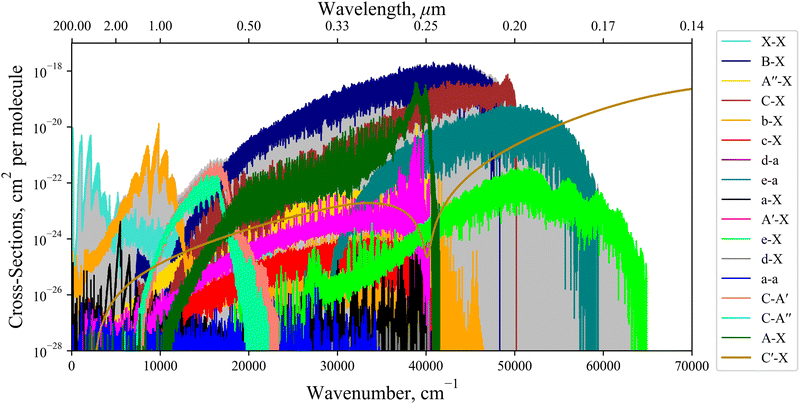
Fig. 11 shows an absorption rovibronic spectrum of SO computed at 5000 K with all bands plotted using different colours, both electric dipole allowed and forbidden. We model the spectrum at a high temperature for a visual aid since at this temperature there is a good separation between different electronic bands. The grey shaded region in Fig. 11 marks the total SO bound-bound absorption at 5000 K, which is mostly traced by the strongest bands with the exception for the region between 12![[thin space (1/6-em)]](https://www.rsc.org/images/entities/char_2009.gif) 000–17
000–17![[thin space (1/6-em)]](https://www.rsc.org/images/entities/char_2009.gif) 000 cm−1. Hence, weaker bands, e.g. ones that break dipole selection rules, have negligible contribution to the total SO opacity and will be less important for low resolution studies such as in astrophysical observations.
000 cm−1. Hence, weaker bands, e.g. ones that break dipole selection rules, have negligible contribution to the total SO opacity and will be less important for low resolution studies such as in astrophysical observations.
The non-bound diabatic states such as C′3Π and (3)1Π are excluded from the bound-bound spectra simulations. Our tests show that the effect of the unbound states on the bound-bound spectra is negligible, and vice versa, the continuum spectra are negligibly affected by the bound electronic states and therefore can be treated separately.
The continuum spectra of the non-bound diabatic C′3Π state is computed using the method described in Pezzella et al.65 and is shown in Fig. 11, plotted in gold and overlaying the bound-bound spectrum to demonstrate its contribution to the total SO opacity. For the continuum state a larger basis set of 5000 wavefunctions was used. The structure energetically above (below) the ‘dip’ at 41![[thin space (1/6-em)]](https://www.rsc.org/images/entities/char_2009.gif) 200 cm−1 is due to absorption to unbound C′3Π states above (below) the S(1D) +O(3P) dissociation. The X3Σ− → C′3Π continuum band continues to 100
200 cm−1 is due to absorption to unbound C′3Π states above (below) the S(1D) +O(3P) dissociation. The X3Σ− → C′3Π continuum band continues to 100![[thin space (1/6-em)]](https://www.rsc.org/images/entities/char_2009.gif) 000 cm−1, peaking at ∼78
000 cm−1, peaking at ∼78![[thin space (1/6-em)]](https://www.rsc.org/images/entities/char_2009.gif) 000 cm−1 which corresponds to the most vertical transitions from states localised around the minima of X3Σ−.
000 cm−1 which corresponds to the most vertical transitions from states localised around the minima of X3Σ−.
We note that the dipole-forbidden bands in Fig. 11 are not computed using quadrupole or magnetic dipole moments, which have very weak intensities, but rather intensities are ‘stolen’ from other transitions. This intensity stealing propagates through the mixture of electronic wave-functions via couplings such as SOCs and EAMCs. For example, the spin-forbidden c1Σ−–X3Σ− band occurs due to the overlap between the c1Σ− wavefunction both with e1Π and d1Π wavefunctions through the EAM couplings, and then with X3Σ− through a secondary mixing via 〈e1Π|SOX|X3Σ−〉 and 〈d1Π|SOX|X3Σ−〉 to produce a direct dipole moment, which dominates over the weaker magnetic and quadrupole moment mechanisms.
We compute absolute intensities for every rovibronic transitions between the lowest 11 diabatic singlet and triplet states of SO covering the entire spectroscopic range up to 147 nm, where NACs are treated. We note that the only other study with similar coverage into the UV on SO is from the theoretical work by Sarka and Nanbu27 who compute cross sections for 190–300 nm. However, our spectroscopic model is both more complete and phase consistent (phases carefully reconstructed, see Section 3.2.2), whereas Sarka and Nanbu27 do not provide any phases.
3.5 Experimental coverage of the ab initio SO spectrum
Currently within the literature a small fraction of the SO spectrum has been measured experimentally covering only the X3Σ−, a1Δ, b1Σ+, A3Π, and B3Σ− states. Fig. 12 reviews the spectroscopic coverage of SO from 24 experimental sources from the literature. Fig. 11 shows our model to supplement the experimental data over the whole spectral range. In particular, we cover the SO spectrum above 40![[thin space (1/6-em)]](https://www.rsc.org/images/entities/char_2009.gif) 000 cm−1 and 12
000 cm−1 and 12![[thin space (1/6-em)]](https://www.rsc.org/images/entities/char_2009.gif) 000–16
000–16![[thin space (1/6-em)]](https://www.rsc.org/images/entities/char_2009.gif) 000 cm−1 where no measurements have been taken for any electronic state. We also plot the available Hitran28 SO line list containing data on the first three electronic states X3Σ−, a1Δ, and b1Σ+. Our ab initio model is able to extend the Hitran coverage up to dissociation at 40
000 cm−1 where no measurements have been taken for any electronic state. We also plot the available Hitran28 SO line list containing data on the first three electronic states X3Σ−, a1Δ, and b1Σ+. Our ab initio model is able to extend the Hitran coverage up to dissociation at 40![[thin space (1/6-em)]](https://www.rsc.org/images/entities/char_2009.gif) 000 cm−1.
000 cm−1.
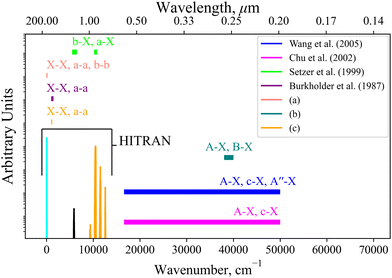 | ||
Fig. 12 Coverage of experimental measurements for 24 sources illustrated by horizontal bars covering the spectral regions measured, where the named works6,18,66,67 include some spectral data, mostly with relative intensities: (a) 14 sources10,14,15,30,68–78 cover X3Σ− → X3Σ−, a1Δ → a1Δ, b1Σ+ → b1Σ+ for 0–125 cm−1; (b) 3 experimental sources17,19,20 cover the A3Π → X3Σ− and B3Σ− → X3Σ− bands for 38![[thin space (1/6-em)]](https://www.rsc.org/images/entities/char_2009.gif) 000–39 000–39![[thin space (1/6-em)]](https://www.rsc.org/images/entities/char_2009.gif) 800 cm−1; (c) 2 experimental sources21,23 cover the X3Σ− → X3Σ− and a1Δ → a1Δ bands for 1040–1125 cm−1. 800 cm−1; (c) 2 experimental sources21,23 cover the X3Σ− → X3Σ− and a1Δ → a1Δ bands for 1040–1125 cm−1. | ||
The aim of a future work is to refine our ab initio SO model to the experimental transition frequencies from these sources and to produce an empirically accurate line list for SO.
4 Effect of diabatisation on the computed spectra
In theory, the adiabatic and diabatic representations should provide identical results, provided that the corresponding NACs and DCs are included. However, due to the computational cost of computing NACs through proper ab initio methods, it is not common practice to include NACs in adiabatic models. Without definition of the NAC, non-Born–Oppenheimer interactions are effectively removed.In this section we analyse the importance of the non-adiabatic couplings between C3Π and C′3Π as well as between e1Π and (3)1Π for computing the (absorption) spectra of SO. To this end we consider our diabatic spectroscopic model to be complete and use it to compute a reference absorption spectrum of SO. This spectrum is then used to compare with an ‘adiabatic’ spectrum of SO computed using the non-adiabatic curves without NACs.
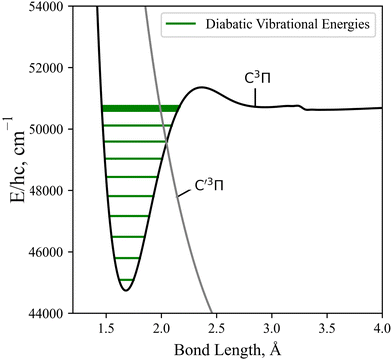
As detailed in Section 3.1, the diabatisation of the potential energy curves induces non-zero off-diagonal elements via corresponding 2 × 2 potential energy matrices in the diabatic representation. These off-diagonal coupling elements will be referred to as diabatic couplings, DCs, which are characterised by cusp shaped curves centered at the avoided crossing. As before, in the diabatic spectrum simulations the unbound states are excluded. Fig. 13 illustrates the vibrational energy levels of the diabatic C3Π, fully bound below its dissociation limit of 50![[thin space (1/6-em)]](https://www.rsc.org/images/entities/char_2009.gif) 700 cm−1.
700 cm−1.
Fig. 14 illustrates the importance of the non-adiabatic effects when modeling the spectra around avoiding crossings for the X3Σ− → C3Π and a1Δ → e′Π bound-bound absorption bands (panel a), and the X3Σ− → C′3Π continuum absorption band (panel b). The adiabatic spectra were computed with the NACs excluded and compared to the diabatic spectra with the non-adiabatic effects fully encountered. Each spectra has been modelled at a temperature of 5000 K – such that hot bands are populated, aiding our comparisons below – with Gaussian profiles of a 0.6 cm−1 half-width-at-half-maximum (HWHM) for the bound-bound spectra and a HWHM of 300 cm−1 for continuum bands.
Great differences between the bound-bound spectra in panel (a) of Fig. 14 are seen towards both the high and low energy regions. In the high energy region the adiabatic spectral bands terminate abruptly at the avoided crossings whereas the diabatic bands continue to the diabatically correlated dissociation asymptotes S(1D) + O(3P) & S(1D) + O(1D) (see Fig. 1). The diabatisation extends these bands by at least a few thousand wavenumbers because of the availability of higher rovibrational states in the deeper diabatic potential wells. For purely bound-bound calculations, the adiabatically computed bands have lower intensities compared to the diabatic spectrum which can be attributed to the increased repulsive character of the adiabatic PECs on the right hand side of the crossing points present. Due to the tunneling through the potential barriers, the adiabatic wavefunctions ‘leak’ to the continuum region thus resulting in reduction of the intensity of their bound absorption spectra. The most interesting feature from Fig. 14 is the extension of the a1Δ → e1Π band beyond the stronger X3Σ− → C3Π band at E/hc > 50![[thin space (1/6-em)]](https://www.rsc.org/images/entities/char_2009.gif) 000 cm−1. Although being relatively weak, this band is not covered by stronger bands and therefore may be observable in the ∼0.18–0.2 μm region, a result only predicted when using a full non-adiabatic theoretical treatment.
000 cm−1. Although being relatively weak, this band is not covered by stronger bands and therefore may be observable in the ∼0.18–0.2 μm region, a result only predicted when using a full non-adiabatic theoretical treatment.
The low intensity regions are very sensitive to changes in the ab initio model and will be also affected by the changes in the shape of couplings between the adiabatic and diabatic representations. The hump-like structure in the C3Π–X3Σ− band at around 10![[thin space (1/6-em)]](https://www.rsc.org/images/entities/char_2009.gif) 000 cm−1 is absent in the adiabatic spectrum because of the unavailability of vibrational states above the avoided crossing. For example, the brightest transitions within this hump for the C3Π–X3Σ− band connect the ν = 13 state which is energetically above the avoided crossing in the adiabatic PEC.
000 cm−1 is absent in the adiabatic spectrum because of the unavailability of vibrational states above the avoided crossing. For example, the brightest transitions within this hump for the C3Π–X3Σ− band connect the ν = 13 state which is energetically above the avoided crossing in the adiabatic PEC.
We note that these regions negligibly contribute to the total SO opacity and so are not important for the SO model, but will be important for other systems where non-adiabatic effects occur in the spectroscopically important regions.
Panel (b) of Fig. 14 presents a similar analysis for the continuum X3Σ− → C′3Π band, which would include an additional bound structure towards longer wavelengths if the NAC is not included in the adiabatic model since the C′3Π PEC in this representation is bound. However, the adiabatic X3Σ− → C3Π bound feature is orders of magnitude weaker than the continuum bands presented here and an analysis on the change of character of bound-bound absorption bands with diabatisation is already provided above. The X3Σ− → C′3Π continuum bands for transitions to unbound C′3Π states above the S(1D) +O(3P) dissociation converge between both representations, since the non-adiabatic effects are far away from the peak at ∼78![[thin space (1/6-em)]](https://www.rsc.org/images/entities/char_2009.gif) 000 cm−1 corresponding to vertical transitions from the electronic ground state. However, if the avoided crossing occurred vertically above the X3Σ− minima, we would expect non-adiabtaic effects to have a greater contribution to the continuum cross sections.
000 cm−1 corresponding to vertical transitions from the electronic ground state. However, if the avoided crossing occurred vertically above the X3Σ− minima, we would expect non-adiabtaic effects to have a greater contribution to the continuum cross sections.
From the comparison above, we show that neglecting NACs within an adiabatic model can lead to drastic differences in the physics gleamed from the computed spectra.
5 Conclusions
In this work, we use multireference methods of electronic structure theory combined with a diabatisation procedure to compute a fully diabatic model for the transient diatomic molecule sulphur monoxide. The model includes 23 spin–orbit, 23 (transition) dipole moment, and 14 electronic angular momentum curves for the X3Σ−, a1Δ, b1Σ+, A3Π, B3Σ−, c1Σ−, A′′3Σ+, A′3Δ, C3Π, d1Π, and e1Π electronic states of SO and were produced ab initio via CASSCF and MRCI methods using aug-cc-pV5Z basis sets. These curves were then used to compute the nuclear motion via solving the fully-coupled Schrödinger equation with the Duo program. A further two electronic states (C′3Π and (3)1Π) were computed along with their couplings, which are essential to forming the diabatic representation. The diabatisation procedure we present is a computationally low cost method to reconstruct the non-adiabatic couplings a priori to nuclear motion calculations. To assess the importance of non-adiabatic effects for the spectroscopy of SO, we compare spectra computed in the diabatic and adiabatic representations without definition of NACs. The most notable difference is the absence of the UV spectrum above ∼50![[thin space (1/6-em)]](https://www.rsc.org/images/entities/char_2009.gif) 000 cm−1 because of the illusionary predissociation from the adiabatic PECs. We also saw the adiabatically computed bound absorption bands to have lower intensities than the diabatic counterparts. It is therefore important to treat NACs for systems where these non-adiabatic interactions occur in spectroscopically important regions since they have drastic effects on spectral structure.
000 cm−1 because of the illusionary predissociation from the adiabatic PECs. We also saw the adiabatically computed bound absorption bands to have lower intensities than the diabatic counterparts. It is therefore important to treat NACs for systems where these non-adiabatic interactions occur in spectroscopically important regions since they have drastic effects on spectral structure.
All coupling curves of SO are defined with self-consistent relative phases, which is crucial for spectral calculations.31 Therefore our spectroscopic model of SO provides a comprehensive and extensive theoretical baseline, which is the first fully reproducible spectroscopic description of SO longer than 147 nm. Since the existing spectroscopic data on SO only covers X3Σ−, a1Δ, b1Σ+, A3Π, and B3Σ−, our ab initio model can be used as a benchmark for future rovibronic methods and calculations.
The topic of our next work will be to build a semi-empirical line list as part of the ExoMol project79,80 for SO through the refinement of our ab initio model to experimental transition data, where we expect to reduce the shift in line positions relative to experiment. The final SO line list will have applications primarily in the atmospheric modelling of exoplanets81–83 and cool stars. Further applications of this empirical SO line list will be in shock zone modelling,11,12,84 SO lasing systems,7,8 and spectroscopy of Venus85,86 and Io.87,88
Data availability
The ab initio curves of SO obtained in this study are phase consistent and are provided as part of the supplementary material to this paper along with our spectroscopic model in a form of a Duo input file. The line list computed with Duo can be directly used with the ExoCross program to simulate the spectral properties of SO. We also provide a Julia source code used for the diabatisation procedure is provided as part of the ESI.†Conflicts of interest
There are no conflicts to declare.Appendix
A.1 The Geometric average of DCs
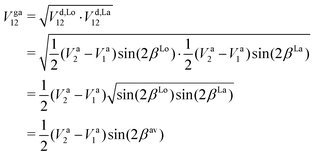
We show here the simple geometric average used to combine the DCs arising from our NACs modelled with a Lorentzian and a Laplacian. We have from eqn (16) of An and Baeck48 the followingwhere in the second line the matrix elements given in eqn (4) are substituted. Comparing the last two lines, one can recover eqn (8), the mixing angle that corresponds to the geometrically averaged DC is then
which corresponds to eqn (15) of An and Baeck.48
A.2 Diabatisation procedure
Non-adiabatic interactions cause steep gradients around the region of the avoided crossings in both PECs and coupling curves. To diabatise these couplings one requires the operation of the unitary transformation matrix given in eqn (1). For some coupling, ζ, and considering two adiabatically interacting states |1〉 and |2〉, the exact transformation for non-diagonal couplings 〈1/2|ζ|k〉, where k ≠ 1, 2, from the adiabatic (‘a’) to the diabatic (‘d’) representation can be found as followsHowever, diagonal couplings also require the off-diagonal counterparts, and transform similarly to the potential energies as,
The computational procedure for performing the diabatisation is straightforward, and is based on the heuristic that the diabatisation should result in continuous potential energy curves that are twice differentiable due to the properties of the wave function and derivatives. For a function represented by a discrete grid of points Vi at geometries Ri, gradients are calculated via finite differences and the task of satisfying this criterion is approximated by minimizing the sum of second derivatives of the function.
To achieve this we optimize the parameters of an arbitrary NAC function, ϕ(R;{p}). The parameters {p} are typically: a central geometry Rc, and a characteristic width ω (see e.g.eqn (5) and (6)). The NAC function, in turn, parameterises the transformation from the adiabatic potential energy operators Vai to the diabatic potential energy operators Vdi at each geometry i, as described by eqn (4).
The optimization itself is easy to achieve using any commonly available optimization libraries. In the present work we use the Julia programming language and the open-source Optim library's Optim.minimizer function to minimize the following loss function using the Nelder–Mead method:89,90
The integration of the NAC function to obtain the mixing angle βi at each geometry is obtained by adaptive Gauss-Kronrod quadrature using the QuadGK.jl library.
Empirically we find that an initial guess for the characteristic width ω with the correct order of magnitude suffices for the optimizer to converge. However, the procedure is somewhat more sensitive to the initial guess for the central geometry Rc as a result we provide a convenience function that attempts to detect the central geometry by searching for the largest absolute value of the second order derivatives of the adiabatic operators. The source code for the diabatisation procedure is provided as part of the ESI.†
Acknowledgements
This work was supported by UK STFC under grant ST/R000476/1. This work made use of the STFC DiRAC HPC facility supported by BIS National E-infrastructure capital grant ST/J005673/1 and STFC grants ST/H008586/1 and ST/K00333X/1. We thank the European Research Council (ERC) under the European Union's Horizon 2020 research and innovation programme through Advance Grant number 883830.References
- A. G. Gaydon, Spectroscopy and combustion theory, Chapman and Hall, Ltd., London, 2nd edn, 1948 Search PubMed.
- M. Wang, Encyclopedia of Energy, Elsevier, New York, 2004, pp. 771–789 Search PubMed.
- G. D. Thurston, International Encyclopedia of Public Health, Academic Press, Oxford, 2nd edn, 2017, pp. 367–377 Search PubMed.
- X. Pan, Encyclopedia of Environmental Health, Elsevier, Oxford, 2nd edn, 2019, pp. 823–829 Search PubMed.
- X. Pan, Encyclopedia of Environmental Health, Elsevier, Burlington, 2011, pp. 290–296 Search PubMed.
- J. B. Burkholder, E. R. Lovejoy, P. D. Hammer, C. J. Howard and M. Mizushima, J. Mol. Spectrosc., 1987, 124, 379–392 CrossRef CAS.
- H. C. Miller, K. Yamasaki, J. E. Smedley and S. R. Leone, Chem. Phys. Lett., 1991, 181, 250–254 CrossRef CAS.
- B. C. Stuart, S. M. Cameron and H. T. Powell, Chem. Phys. Lett., 1992, 191, 273–278 CrossRef CAS.
- F. O. Clark and D. R. Johnson, Astrophys. J., 1974, 191, L87–L91 CrossRef CAS.
- G. Cazzoli, V. Lattanzi, S. Coriani, J. Gauss, C. Codella, A. A. Ramos, J. Cernicharo and C. Puzzarini, Astron. Astrophys., 2017, 605, A20 CrossRef PubMed.
- L. Chernin and C. Masson, Astrophys. J., 1993, 403, L21–L24 CrossRef CAS.
- M. Y. Amin, M. S. Elnawawy and M. A. Elshalaby, Astrophys. Space Sci., 1991, 185, 277–294 CrossRef CAS.
- T. Klaus, S. P. Belov, A. H. Saleck, G. Winnewisser and E. Herbst, J. Mol. Spectrosc., 1994, 168, 235–247 CrossRef.
- S. Yamamoto, Chem. Phys. Lett., 1993, 212, 113–117 CrossRef CAS.
- M. A. Martin-Drumel, F. Hindle, G. Mouret, A. Cuisset and J. Cernicharo, Astron. J., 2015, 799, 115 CrossRef.
- R. Colin, Can. J. Phys., 1968, 46, 1539–1546 CrossRef CAS.
- R. Colin, J. Chem. Soc., Faraday Trans., 1982, 78, 1139–1147 RSC.
- K. D. Setzer, E. H. Fink and D. A. Ramsay, J. Mol. Spectrosc., 1999, 198, 163–174 CrossRef CAS PubMed.
- M. A. A. Clyne and P. H. Tennyson, J. Chem. Soc., Faraday Trans., 1986, 82, 1315–1325 RSC.
- B. C. Stuart, S. M. Cameron and H. T. Powell, J. Phys. Chem., 1994, 98, 11499–11511 CrossRef CAS.
- H. Kanamori, J. E. Butler, K. Kawaguchi, C. Yamada and E. Hirota, J. Mol. Spectrosc., 1985, 113, 262–268 CrossRef CAS.
- M. Wong, T. Amano and P. Bernath, J. Chem. Phys., 1982, 77, 2211–2213 CrossRef CAS.
- H. Kanamori, E. Tiemann and E. Hirota, J. Chem. Phys., 1988, 89, 621–624 CrossRef CAS.
- P. F. Bernath, R. Johnson and J. Liévin, J. Quant. Spectrosc. Radiat. Transfer, 2021, 272, 107772 CrossRef CAS.
- P. F. Bernath, R. Johnson and J. Liévin, J. Quant. Spectrosc. Radiat. Transfer, 2022, 108317 CrossRef CAS.
- L. Yu and W. Bian, J. Comput. Chem., 2011, 32, 1577–1588 CrossRef CAS PubMed.
- K. Sarka and S. Nanbu, J. Phys. Chem. A, 2019, 123, 3697–3702 CrossRef CAS PubMed.
- L. S. Rothman, I. E. Gordon, Y. Babikov, A. Barbe, D. C. Benner, P. F. Bernath, M. Birk, L. Bizzocchi, V. Boudon, L. R. Brown, A. Campargue, K. Chance, E. A. Cohen, L. H. Coudert, V. M. Devi, B. J. Drouin, A. Fayt, J.-M. Flaud, R. R. Gamache, J. J. Harrison, J.-M. Hartmann, C. Hill, J. T. Hodges, D. Jacquemart, A. Jolly, J. Lamouroux, R. J. Le Roy, G. Li, D. A. Long, O. M. Lyulin, C. J. Mackie, S. T. Massie, S. Mikhailenko, H. S. P. Müller, O. V. Naumenko, A. V. Nikitin, J. Orphal, V. Perevalov, A. Perrin, E. R. Polovtseva, C. Richard, M. A. H. Smith, E. Starikova, K. Sung, S. Tashkun, J. Tennyson, G. C. Toon, V. G. Tyuterev and G. Wagner, J. Quant. Spectrosc. Radiat. Transfer, 2013, 130, 4–50 CrossRef CAS.
- A. Kramida, Y. Ralchenko, J. Reader and NIST ASD Team, Atoms, 2020, 8, 56 CrossRef PubMed.
- C. P. Endres, S. Schlemmer, P. Schilke, J. Stutzki and H. S. P. Müller, J. Mol. Spectrosc., 2016, 327, 95–104 CrossRef CAS.
- A. T. Patrascu, C. Hill, J. Tennyson and S. N. Yurchenko, J. Chem. Phys., 2014, 141, 144312 CrossRef PubMed.
- M. Born and R. Oppenheimer, Ann. Phys., 1927, 389, 457–484 CrossRef.
- C. A. Mead and D. G. Truhlar, J. Chem. Phys., 1982, 77, 6090–6098 CrossRef CAS.
- A. W. Jasper, B. K. Kendrick, C. A. Mead and D. G. Truhlar, Non-Born–Oppenheimer Chemistry: Potential Surfaces, Couplings, and Dynamics, World Scientific, 2004, pp. 329–391 Search PubMed.
- T. Karman, M. Besemer, A. van der Avoird and G. C. Groenenboom, J. Chem. Phys., 2018, 148, 094105 CrossRef.
- Y. Shu, Z. Varga, A. G. Sampaio de Oliveira-Filho and D. G. Truhlar, J. Chem. Theory Comput., 2021, 17, 1106–1116 CrossRef CAS PubMed.
- J. B. Delos, Rev. Mod. Phys., 1981, 53, 287–357 CrossRef CAS.
- H. Nakamura and D. G. Truhlar, J. Chem. Phys., 2003, 118, 6816–6829 CrossRef CAS.
- T. Karman, A. van der Avoird and G. C. Groenenboom, J. Chem. Phys., 2016, 144, 121101 CrossRef PubMed.
- Q. Ma, J. Kłos, M. H. Alexander, A. van der Avoird and P. J. Dagdigian, J. Chem. Phys., 2014, 141, 174309 CrossRef PubMed.
- J. Kłos, Q. Ma, M. H. Alexander and P. J. Dagdigian, J. Chem. Phys., 2017, 146, 114301 CrossRef.
- T. de Jongh, T. Karman, S. N. Vogels, M. Besemer, J. Onvlee, A. G. Suits, J. O. F. Thompson, G. C. Groenenboom, A. van der Avoird and S. Y. T. van de Meerakker, J. Chem. Phys., 2017, 147, 013918 CrossRef PubMed.
- H. J. Werner, P. J. Knowles, G. Knizia, F. R. Manby, M. Schütz, P. Celani, W. Györffy, D. Kats, T. Korona, R. Lindh, A. Mitrushenkov, G. Rauhut, K. R. Shamasundar, T. B. Adler, R. D. Amos, A. Bernhardsson, A. Berning, D. L. Cooper, M. J. O. Deegan, A. J. Dobbyn, F. Eckert, E. Goll, C. Hampel, A. Hesselmann, G. Hetzer, T. Hrenar, G. Jansen, C. Köppl, Y. Liu, A. W. Lloyd, R. A. Mata, A. J. May, S. J. McNicholas, W. Meyer, M. E. Mura, A. Nicklass, D. P. O’Neill, P. Palmieri, D. Peng, K. Pflüger, R. Pitzer, M. Reiher, T. Shiozaki, H. Stoll, A. J. Stone, R. Tarroni, T. Thorsteinsson and M. Wang, MOLPRO, version 2015.1, a package of ab initio programs, 2015, https://www.molpro.net.
- T. H. Dunning, J. Chem. Phys., 1989, 90, 1007–1023 CrossRef CAS.
- D. E. Woon and T. H. Dunning, J. Chem. Phys., 1993, 98, 1358–1371 CrossRef CAS.
- M. Born and K. Huang, Dynamical Theory of Crystal Lattices, Clarendon Press, 1988 Search PubMed.
- D. Simah, B. Hartke and H.-J. Werner, J. Chem. Phys., 1999, 111, 4523–4534 CrossRef CAS.
- H. An and K. K. Baeck, J. Chem. Phys., 2015, 143, 194102 CrossRef PubMed.
- K. Baeck and H. An, J. Chem. Phys., 2017, 146, 064107 CrossRef PubMed.
- H. Werner and W. Meyer, J. Chem. Phys., 1981, 74, 5802–5807 CrossRef CAS.
- A. J. C. Varandas, J. Chem. Phys., 2009, 131, 124128 CrossRef CAS PubMed.
- T. Mondal and A. J. C. Varandas, J. Chem. Phys., 2011, 135, 174304 CrossRef CAS PubMed.
- A. J. C. Varandas, J. Chem. Phys., 2011, 135, 119902 CrossRef.
- A. Varandas, Chem. Phys. Lett., 2009, 471, 315–321 CrossRef CAS.
- C.-P. Liu, N. L. Elliott, C. M. Western, Y.-P. Lee and R. Colin, J. Mol. Spectrosc., 2006, 238, 213–223 CrossRef CAS.
- A. C. Borin and F. R. Ornellas, Chem. Phys. Lett., 2000, 322, 149–156 CrossRef CAS.
- C. P. Archer, J. M. F. Elks and C. M. Western, J. Chem. Phys., 2000, 112, 6293–6300 CrossRef CAS.
- A. C. Borin and F. R. Ornellas, Chem. Phys., 1999, 247, 351–364 CrossRef CAS.
- K. P. Huber and G. Herzberg, Molecular Spectra and Molecular Structure IV. Constants of Diatomic Molecules, Van Nostrand Reinhold Company, New York, 1979 Search PubMed.
- K. Norwood and C. Ng, Chem. Phys. Lett., 1989, 156, 145–150 CrossRef CAS.
- H. M. Wang, X. S. Tang, S. K. Zhou, W. J. Zhang and Y. N. Chu, Chem. Phys. Lett., 2005, 407, 78–82 CrossRef CAS.
- B. Rosen, Spectroscopic Data Relative to Diatomic Molecules, Elsevier Science, 2013 Search PubMed.
- S. N. Yurchenko, L. Lodi, J. Tennyson and A. V. Stolyarov, Comput. Phys. Commun., 2016, 202, 262–275 CrossRef CAS.
- S. N. Yurchenko, A. F. Al-Refaie and J. Tennyson, Astron. Astrophys., 2018, 614, A131 CrossRef.
- M. Pezzella, S. N. Yurchenko and J. Tennyson, Phys. Chem. Chem. Phys., 2021, 23, 16390–16400 RSC.
- Y. N. Chu, H. M. Wang, J. Q. Li, P. Cheng and D. Z. Cao, Chem. Phys. Lett., 2002, 366, 147–152 CrossRef CAS.
- H. M. Wang, X. S. Tang, H. Y. Han, J. Q. Li, S. K. Zhou, W. J. Zhang and Y. A. Chu, Chin. J. Chem. Phys., 2005, 18, 670–674 CAS.
- E. Kim and S. Yamamoto, J. Mol. Spectrosc., 2003, 219, 296–304 CrossRef CAS.
- F. X. Powell and D. R. Lide, J. Chem. Phys., 1964, 41, 1413–1419 CrossRef CAS.
- M. Winnewisser, W. Gordy, K. Sastry and R. L. Cook, J. Chem. Phys., 1964, 41, 1687–1691 CrossRef CAS.
- E. Tiemann, J. Mol. Spectrosc., 1974, 51, 316–320 CrossRef CAS.
- W. W. Clark and F. C. Delucia, J. Mol. Spectrosc., 1976, 60, 332–342 CrossRef CAS.
- E. Tiemann, J. Mol. Spectrosc., 1982, 91, 60–71 CrossRef CAS.
- Y. Endo, H. Kanamori and E. Hirota, Chem. Phys. Lett., 1987, 141, 129–132 CrossRef CAS.
- G. Cazzoli, L. Cludi, G. Cotti, C. D. Esposti and L. Dore, J. Mol. Spectrosc., 1994, 167, 468–471 CrossRef CAS.
- T. Klaus, A. H. Saleck, S. P. Belov, G. Winnewisser, Y. Hirahara, M. Hayashi, E. Kagi and K. Kawaguchi, J. Mol. Spectrosc., 1996, 180, 197–206 CrossRef CAS PubMed.
- M. Bogey, S. Civis, B. Delcroix, C. Demuynck, A. F. Krupnov, J. Quiguer, M. Y. Tretyakov and A. Walters, J. Mol. Spectrosc., 1997, 182, 85–97 CrossRef CAS.
- T. Klaus, S. P. Belov and G. Winnewisser, J. Mol. Spectrosc., 1997, 186, 416–421 CrossRef CAS PubMed.
- J. Tennyson and S. N. Yurchenko, Mon. Not. R. Astron. Soc., 2012, 425, 21–33 CrossRef CAS.
- J. Tennyson, S. N. Yurchenko, A. F. Al-Refaie, V. H. Clark, K. L. Chubb, E. K. Conway, A. Dewan, M. N. Gorman, C. Hill, A. Lynas-Gray, T. Mellor, L. K. McKemmish, A. Owens, O. L. Polyansky, M. Semenov, W. Somogyi, G. Tinetti, A. Upadhyay, I. Waldmann, Y. Wang, S. Wright and O. P. Yurchenko, J. Quant. Spectrosc. Radiat. Transfer, 2020, 255, 107228 CrossRef CAS.
- M. Y. Zolotov and B. J. Fegley, Icarus, 1998, 132, 431–434 CrossRef CAS.
- R. Hobbs, P. B. Rimmer, O. Shorttle and N. Madhusudhan, Mon. Not. R. Astron. Soc., 2021, 506, 3186–3204 CrossRef CAS.
- V. A. Krasnopolsky, Icarus, 2012, 218, 230–246 CrossRef CAS.
- R. Bachiller, Annu. Rev. Astron. Astrophys., 1996, 34, 111–154 CrossRef CAS.
- C. Y. Na, L. W. Esposito and T. E. Skinner, J. Geophys. Res.: Atmos., 1990, 95, 7485–7491 CrossRef.
- D. A. Belyaev, F. Montmessin, J.-L. Bertaux, A. Mahieux, A. A. Fedorova, O. I. Korablev, E. Marcq, Y. L. Yung and X. Zhang, Icarus, 2012, 217, 740–751 CrossRef CAS.
- E. Lellouch, Icarus, 1996, 124, 1–21 CrossRef CAS.
- I. de Pater, H. Roe, J. R. Graham, D. F. Strobel and P. Bernath, Icarus, 2002, 156, 296–301 CrossRef CAS.
- J. Bezanson, A. Edelman, S. Karpinski and V. B. Shah, SIAM Rev., 2017, 59, 65–98 CrossRef.
- P. K. Mogensen, J. M. White, A. N. Riseth, T. Holy, M. Lubin, C. Stocker, A. Noack, A. Levitt, C. Ortner, B. Johnson, D. Lin, K. Carlsson, Y. Yu, C. Rackauckas, J. Grawitter, A. Williams, B. Kuhn, B. Legat, J. Regier Cossio, R. Rock, T. R. Covert, B. Pasquier, T. Arakaki, A. Stukalov, A. Clausen, A. Strouwen and B. Deonovic, JuliaNLSolvers/Optim.jl: v1.7.2, 2022, https://zenodo.org/record/7019119.
Footnotes |
| † Electronic supplementary information (ESI) available. See DOI: https://doi.org/10.1039/d2cp03051a |
| ‡ https://github.com/Exomol/Duo)github.com/Exomol. |
| This journal is © the Owner Societies 2022 |

