 Open Access Article
Creative Commons Attribution 3.0 Unported Licence
Dimer photofragmentation and cation ejection dynamics in helium nanodroplets
Michael
Stadlhofer†
,
Bernhard
Thaler†
and
Markus
Koch
 *
*
Graz University of Technology, Institute of Experimental Physics, Petersgasse 16, Graz, Austria. E-mail: markus.koch@tugraz.at
First published on 30th September 2022
Abstract
We present femtosecond pump–probe photoionization experiments with indium dimers (In2) solvated in helium nanodroplets (HeN). At short pump–probe time delays, where the excited In2* is still located inside the droplet, we surprisingly observe detachment of InHen+ ions with n = 1 to ∼30 from the droplet. These ions indicate that fragmentation of In2 occurs and that the kinetic energy release enables In+ to overcome the attractive HeN potential, which typically prevents ion ejection from the droplet. We find that the transient InHen+ signal reveals vibrational wave packet motion in neutral In2*. By correlating the InHen+ signal with the corresponding photoelectrons through covariance detection, we unequivocally identify the ionization pathway leading to InHen+: pump-excitation from the ground-state In2 creates a vibrational wave packet in In2*, followed by probe-ionization to the cationic ground state In2+. Subsequently, a further probe photon promotes the molecule to an excited ionic state In2+* of nonbonding character, leading to fragmentation and kinetic energy release. This interpretation is additionally supported by probe power- and droplet-size dependencies, as well as energetic considerations. Unambiguous assignment of the ionization path to absorption–ionization–dissociation (fragmentation of the ion) in contrast to absorption–dissociation–ionization (fragmentation of the neutral) is enabled by ion ejection and electron–ion correlation. This complementary observable for ultrafast photochemical processes inside HeN will be particularly valuable for more complex systems.
1 Introduction
Ultrafast photochemical reactions typically involve the concerted motion of electrons and nuclei in a non-adiabatic manner. In gas-phase, isolated from environmental influences, femtosecond pump–probe photoionization in combination with electron and/or ion detection has been developed as a versatile and powerful technique for investigating such ultrafast dynamical processes.1–3 While observables like the kinetic energy or angular distribution of photoelectrons primarily provide insight into electronic structure dynamics, properties of the generated ions, such as mass or kinetic energy, inform directly about processes connected to the nuclear structure, like fragmentation. In more complex situations ambiguities in the interpretation can arise, resulting from parallel relaxation pathways,4–6 or from the presence of several similar species, such as chromophore–solvent aggregates of different sizes.2,7–9 In such cases, correlating the photoelectron and -ion spectra through coincidence10 or covariance11 detection provides additional insight by revealing mass-specific electron spectra. Multiple fragmentation pathways or different species can be differentiated by analyzing the mass-specific electron spectra, which serve as a fingerprint of the species at the moment of ionization (parent versus fragment molecule, or size of a molecular aggregate).Despite multifaceted developments in the field of gas-phase time-resolved spectroscopy within the last decades, some classes of molecular systems have evaded observation; examples include fragile molecules or tailor-made assemblies. The cold and controlled conditions provided by superfluid helium nanodroplets (HeN) enable the preparation of a wide range of otherwise inaccessible systems, as demonstrated by over three decades of frequency-domain spectroscopy12 and mass spectrometry.13 Concerning time-domain studies, the opportunities of HeN are currently being explored and a number of photoinduced processes could be identified and characterized, including, among others, molecular alignment,14 coherent nuclear vibration,15–17 bond formation,18 solvent dynamics following electronic excitation,19–22 internal conversion,23 quantum beats,24 intermolecular energy transfer,25 or nanoplasma formation.26,27 These seminal studies have shown that, for pump–probe photoionization, the electron kinetic energy can be used as an accurate observable for processes inside HeN because the helium-influence on free electrons through binary collisions is sufficiently low.28 The influence on ions inside the droplet, in contrast, is substantially larger due to electrostrictive ion–HeN attraction, preventing ions from detachment from the droplet and leading to the accumulation of He atom structures around the ion with solid-like densities, called snowballs.29,30 This ion trapping is a severe hurdle for photochemical studies inside HeN, as it prevents the application of ion-related detection schemes, including coincidence and covariance techniques. Ions are only available as observables if they gain sufficient kinetic energy to overcome the attractive droplet potential. Ion ejection from HeN has only been reported in a few experiments, where the required energy gain results either from Coulomb repulsion between ions (as applied in Coulomb explosion imaging),14 or from vibrational excitation by infrared light.31,32
Here, we present and characterize a new mechanism that facilitates the detection of ions generated inside HeN. The mechanism builds on ionization of the excited molecules with increased laser intensity to reach a repulsive excited state, where the kinetic energy of the ion fragment is sufficient to escape the HeN. In a first step, we show that the time-resolved ion yield can be a good observable for ultrafast intramolecular dynamics of a neutral molecule inside the droplet. In a second step, we use ion–electron correlation by covariance detection to identify the ionization pathway and the corresponding processes that lead to ion ejection from the droplet.
2 Experimental
We investigate indium dimers In2 located inside helium nanodroplets with femtosecond pump–probe photoelectron and -ion spectroscopy. As presented in previous works,15,19 helium droplets with a mean number of 9000 atoms (source parameters: 5 μm nozzle diameter, 15 K temperature, 40 bar stagnation pressure) are doped with, on average, two In atoms. Femtosecond laser pulses are obtained from an amplified Ti:sapphire laser system (800 nm center wavelength, 25 fs pulse duration, 4.2 mJ pulse energy, 3 kHz repetition rate). Pump pulses are tuned to the B3Pg ← X3Pu transition of In2 at 345 nm center wavelength (3.60 eV, 75 meV FWHM) by an optical parametric amplifier. A second harmonic of the laser fundamental at 406 nm (3.05 eV, 30 meV FWHM) provides the probe pulses. The cross correlation signal of the two pulses, defining the temporal resolution of the experiment, is estimated to be below 250 fs.A time-of-flight spectrometer is used to detect the charge-to-mass ratio of ions and the kinetic energies of photoelectrons, applying a magnetic-bottle configuration.33 For correlated detection of electrons and ions, the repeller is switched voltage from −2 V to +2 kV at about 100 ns after the arrival of the laser pulses, in order to obtain both the electron and ion flight times for each laser shot.4–6 Covariance-mapping is applied to establish correlation between electrons and ions based on statistical fluctuations.11
3 Results
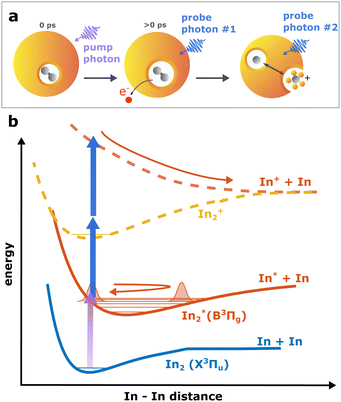
Continuing our recent studies on vibrational wave packet (WP) dynamics in In2 solvated inside HeN with time-resolved photoelectron spectroscopy,15 we surprisingly detect a strong InHen+ ion signal at short pump–probe time delays. This ion signal is unexpected because it must result from ionization of In2 still located inside the droplet, where the attractive droplet potential for ions should prevent ion detection.As depicted in Fig. 1, In2 is excited by a pump pulse, which leads to the propagation of a WP in the excited state and results in a periodic modulation of the ionization probability.15 By ionizing the excited molecule with the probe pulse, the WP motion can be detected as a periodic oscillation of the photoelectron yield as a function of the time delay between the pump and probe pulses (Fig. 2a). The oscillation amplitude decays within the first few picoseconds due to dispersion within the anharmonic potential, as well as due to decoherence induced by the He environment, which could be shown to be exceptionally low compared to conventional solvents.15 The photoexcited In2* molecules are ejected from the droplet after about 50–100 ps in consequence of the repulsive In2*–HeN interaction in the excited state (see Fig. 5 and discussion below). In those bare In2, coherent revivals of the WP oscillation can be observed every ∼150 ps (Fig. 3a), resulting from re-focusing of the initially dispersed wave packet.
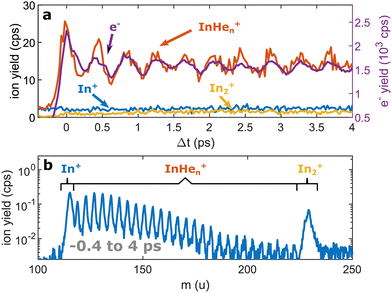 | ||
| Fig. 2 Pump–probe photoionization of In2 inside HeN at short time delays showing the initial WP oscillation. (a) Transient photo-ion signals for different mass channels, in comparison to the transient photoelectron signal.15 (b) Ion mass spectra obtained through integration of the transient signals up to 4 ps. | ||
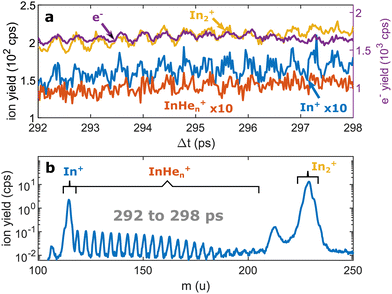 | ||
| Fig. 3 Pump–probe photoionization of In2 at time delays around the first full revival. (a) Transient photo-ion signals for different mass channels and transient photoelectron signal15 for comparison. (b) Ion mass spectra obtained through integration of the transient signals between 292 and 298 ps. The signals at 112 u and 224 u cannot be assigned. | ||
Ion signals from species inside HeN can usually only be expected when the ionization process happens after or close to the ejection following excitation.34 In contradiction to this, we observe a pronounced InHen+ signal immediately after photoexcitation, way before ejection from the droplet (Fig. 2a). The InHen+ ions could, in principle, originate from a single In atom, or from dissociation of a neutral or ionized In2 molecule. The appearance of this signal indicates that the underlying process must involve significant acceleration of the In+. For identifying the processes, it is important to recognize the similarity of the transient InHen+ signal (red trace in Fig. 2a) and the transient electron yield (magenta trace in Fig. 2a), indicating that the InHen+ ions are rooted in the WP motion of the neutral In2. In the following, we show that the ionization path leading to fragmentation and In+ detachment from the droplet proceeds via excitation by two probe photons into a nonbonding cationic state In2+*, as sketched in Fig. 1b. For this, we apply complementary approaches including ion mass spectra for probe-ionization inside and outside the droplet, transient ion yields, covariance-detection of electrons and ions, and ion signal dependencies on the probe-power and the droplet size.
Ion mass spectra
We recorded ion spectra at short time-delays of the initial WP oscillation (<4 ps) and at longer time-delays in the region of the first revival of the WP oscillation (292 ps to 298 ps). The mass spectrum at short time-delays is shown in Fig. 2b: Between the In+ signal at 115 u and the In2+ signal at 230 u the series of peaks with mass separation of 4 u corresponds to the InHen+ with n ranging from 1 to 27. These snowballs are likely formed during ejection of In+ from the droplet with additional binding of helium atoms to the charged atom, as recently also observed in Coulomb explosion imaging35 and photofragmentation experiments36 inside HeN. The additionally present weak In2+ signal (Fig. 2b) we attribute to ionization of bare In2, which might be formed by a certain fraction of small droplets contained in the size distribution, through complete He evaporation upon pickup and dimer formation. The observed In+ signal could come from fragmentation of these bare indium dimers or from ejection of In+ out of the droplet without the pickup of additional helium atoms.Fig. 3b shows the ion masses detected at long time-delays. Both the In+ and In2+ signals are now dominant over InHen+, indicating that they originate from ionization of bare, electronically excited In2*, which have been ejected from the droplet. The relative abundance of In2+ and In+ gives the branching ratio for ionization into the bound cationic ground state relative to ionization into the dissociative cationic state (see Fig. 1). The width of the In2+ peak appears broader than the other peaks, most probably reflecting the In2* kinetic energy distribution after ejection, which will be more precisely determined with velocity map imaging in a future experiment. The InHen+ signal is significantly weaker but still present, which might be connected to the formation and subsequent fragmentation of In2*Hen exciplexes: Excited-state molecules with a number of attached helium atoms. Note that the excited Π state (Fig. 1) can be expected to support the attachment of He atoms, similar to exciplex formation of photo-excited alkali-metal atoms in p-states.18 Additional peaks at 112 u and 224 u could not be assigned.
Time-resolved ion spectroscopy
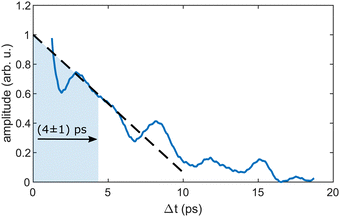
As the similarity of the transient InHen+ signal and the transient photoelectron yield (Fig. 2a) strongly suggests a connection between the vibrating In2 and the ejected InHen+ ions at early time delays, we apply sliding-window Fourier transformation for further quantification (see Fig. 4). With this method, a spectrogram of the transient InHen+ signal is generated, revealing oscillation amplitudes and corresponding frequencies as a function of time. The oscillation frequency remains unchanged at 2.42 THz and the oscillation amplitude decreases with a half-life of (4 ± 1) ps. Both results are in perfect agreement with the electron transients,15 tracing the InHen+ oscillations of solvated In2.At longer pump–probe delays in the range of the first full revival around 295 ps, the In2+ signal dominates (Fig. 3a) and its oscillations again match those of the electron yield. This indicates the preservation of WP coherence during ejection from the droplet. The weaker In+ and InHen+ signals also exhibit the same oscillation, however with much smaller amplitude.
Fig. 5 shows the progression of the InHen+, In2+ and In+ signals over the full time window of the experiment, including the initial WP oscillations (<5 ps, Fig. 2a) and the first revival (∼295 ps, Fig. 3a). The In2+ signal reflects the characteristic ejection behavior: A pronounced onset at 50 ps with a very small ion yield before and a saturating increase up to 300 ps afterwards. The revival structure of the WP signal is also apparent in the In2+ signal: the full revival at ∼295 ps, half revival at ∼150 ps and fractional revivals in between. As this coherent signal was previously analyzed in detail,15 the revivals are, however, not well resolved here due to undersampling. The In+ transient also shows a steady increase, similar to the In2+ signal, but is significantly larger in the beginning and completely lacks a sharp onset. In contrast, the InHen+ signal exhibits a very different transient behavior up to 100 ps (Fig. 5), as it is larger than both the In+ and In2+ signals below 50 ps and not at all monotonic. It increases promptly after the pump pulse excitation, reaching a maximum at ∼45 ps, somewhat before conventional ejection is completed (see also droplet-size dependency measurements and discussion below). Both In+ and InHen+ seem to reach a plateau at 300 ps.
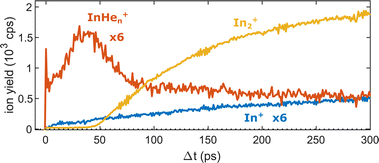 | ||
| Fig. 5 Transient ion yields of the different mass channels up to 300 ps. Note that the In+ and the InHen+ yields are scaled up by a factor of 6. | ||
Electron–ion correlation spectroscopy
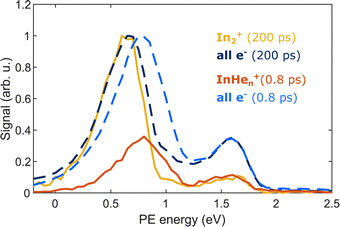
The appearance of InHen+ ions upon In2 ionization enables us to correlate the ionization products – ions and electrons. Fig. 6 compares the electron–ion covariance spectra at short (0.8 ps) and long (200 ps) time-delays. At 200 ps delay (red trace), electrons correlated with In2+ are most prevalent with a peak at 0.65 eV in the energy spectrum, identifying the photoelectron band corresponding to In2* ionization after ejection from the droplet. At 0.8 ps delay (red trace), the electron signal correlated to InHen+ ions peaks at slightly higher energies of 0.8 eV. The location of this peak in the spectrum is a further indication that InHen+ originates from unfragmented In2* molecules and rules out In atoms as the source, since the photoelectron peak for ionization of excited In* atoms (5s26s,2S) would be expected at ∼0.32 eV,19 and the peak for two-photon ionization of ground-state In atoms similarly at ∼0.32 eV.37 Additionally, photoionization of atoms produces sharper peaks.19 The shift to higher energies for in-droplet ionization of In2*, compared to bare In2*, is due to a lowering of the ionization potential by the He environment and possibly also indicates that the bubble expansion resulting from photoexcitation is not completed after 0.8 ps.19Covariance mapping thus provides insight into the reaction pathway leading to InHen+ ion ejection: The photoelectron spectrum correlated to InHen+ indicates that the probe pulse ionizes In2* to the In2+ cationic ground state. Consequently, subsequent excitation to a repulsive In2+* state by a second probe photon must be responsible for fragmentation and ion ejection. The electrons from initial In2* ionization and the InHen+ fragmentation products then originate from the same process and their correlation is identified through covariance detection. Note that the electron–ion covariance spectra (solid lines in Fig. 6) at 0.8 and 200 ps time delay are similar to the full electron spectra (dashed lines), with significant deviations only at the pump-only peak at 1.6 eV. This similarity shows that in this simple situation the spectra corresponding to the questioned InHen+ generation inside the droplet and In2+ generation outside could be separated in time. In more complex situations with multiple parallel ionization channels, the corresponding electron spectra can only be obtained with covariance mapping.
Probe-pulse power dependence
To test the hypothesis of photoinduced dissociation of In2+ through a second probe photon, we monitor the InHen+ yield at short pump–probe delays (0.8 ps) as function of the probe pulse power, in comparison to the power dependencies of In2+ and In+ at long delays (300 ps). Fig. 7 shows these power dependencies in a log–log plot, which allows us to determine the number of probe photons involved in the ionization process of the respective ion from the signal slope. The slopes obtained for the ion fragments, InHen+ and In+, both exceed the value of one, suggesting that two probe photons are involved in the ionization process. In contrast, the unfragmented In2+ results from a single probe-photon process, as its slope falls below one.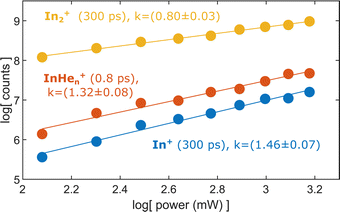 | ||
| Fig. 7 Yield of relevant ions at short and long pump–probe delays in dependence on the probe laser power. | ||
This supports the assumption that at short time delays, the InHen+ signal results from excitation of In2+ to a repulsive In2+* state subsequent to In2 ionization inside the droplet (see Fig. 1). The excited, repulsive state seems to provide sufficient kinetic energy for In+ to escape from the attractive droplet potential, accompanied by InHen+ snowball formation. Without energy transfer of subsequent photoexcitation, ionization to the In2+ cationic ground state remains unobserved due to trapping inside the droplet.
At longer delays, after In2* has been ejected from the droplet, both ionization channels are observed: ionization with one probe photon to the cationic ground state leads to detection of In2+ whereas ionization with two probe photons to the excited cationic state leads to fragmentation and In+ detection.
Helium droplet size dependence
As last step, we investigate the dependence of the InHen+ and In2+ yields at 0.8 ps time delay on droplet size by variation of the nozzle temperature. To compensate for the varying HeN flux for different nozzle temperatures and for different pickup conditions, we normalize both signals to the In2+ signal at 300 ps, which serves as reference for the amount of ionized In2 molecules per laser shot. Results are shown in Fig. 8. The probability of detecting InHen+ (red curve) decreases for larger droplets, while the probability of detecting In2+ (blue curve) is independent of the droplet size, at least down to very small droplets. This trend might indicate that the probability of complete droplet evaporation starts to play a role for these droplets.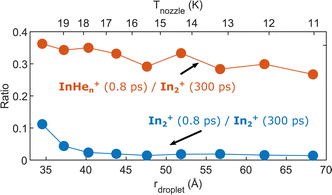 | ||
| Fig. 8 Droplet size dependence of the InHen+ and In2+ yields at short pump–probe delays. Both signals are normalized to the In2+ signal at 300 ps delay. | ||
4 Discussion
The reaction path leading to InHen+ formation and ejection from the droplet can be assigned to two-photon ionization from an electronically and vibrationally excited In2* molecule to a dissociative cationic state. The kinetic energy release due to dissociation enables InHen+ to overcome the attractive droplet potential, at least with some probability. The ejection probability seems to depend on the In2* location at the moment of ionization, indicated in Fig. 5 by the InHen+ signal increase (red trace) within the first ∼40 ps pump–probe delay. The observed InHen+ increase can be explained by pump excitation of In2 to a heliophobic state, triggering the movement of In2* towards the droplet surface within ∼50 ps, evidenced by the onset of the In2+ signal at this delay (yellow line in Fig. 5). Ionization of In2* closer to the droplet surface increases the In+ ejection probability, which nevertheless forms InHen+ due to the attractive He interaction. This interpretation is in line with the dropletsize dependence of the InHen+ signal at fixed pump–probe delay (Fig. 8, red trace): for smaller droplets InHen+ ions detach from the droplet with a higher probability.The InHen+ signal decrease above 45 ps in Fig. 5 reflects the onset of In2* ejection, since InHen+ formation requires ionization inside the droplet, whereas In2* ionization outside the droplet yields In2+ and apparently also fragmentation to In and In+. Interestingly, the InHen+ signal does not decrease to zero but levels off at ∼100 ps instead, which we attribute to the ejection of neutral In2*Hen exciplexes followed by complete fragmentation into In and InHen+ after ionization as no In2Hen+ are present in the mass spectrum near 300 ps (Fig. 3).
To rationalize the proposed ion ejection mechanism, knowledge of the In2+ potential energy curves would be necessary. Since no calculated potentials are available for In2+ we instead consider the potentials of aluminum dimer cations (Al2+) in the ground and excited states,38 since Al2 and In2 have a similar electronic structure. Relevant potentials are shown schematically in Fig. 1. The vertical excitation energy from the ground to the lowest excited state of the cation is approximately 3.0 eV,38 which is in the range of our probe photon energy. With a binding energy of the cationic ground state of about 1.4 eV we estimate the total kinetic energy release to be about 1.6 eV, divided equally between both fragments. The initial velocities of In and In+ fragments is thus about 1160 m s−1. It is known, that particles with velocities above the critical Landau velocity of 56 ms−1 experience strong deceleration due to friction inside HeN.39 This Landau velocity corresponds do 1.8 meV in the case of In, suggesting that the generated In+ must experience a strong drag. Furthermomre, the In+ binding energy to the droplet is ∼90 meV.19 This comparison rationalizes our interpretation: After dissociation, the initially fast In+ (∼1160 ms−1) is efficiently decelerated and can only leave the droplet if it approaches the surface with sufficient energy to escape the holding potential (∼90 meV).
5 Conclusion
In this paper, we identified an ionization–fragmentation channel of In2 molecules fully solvated inside helium nanodroplets. With pump–probe photoionization at early delay times, where the ionization takes place inside the droplet, we observe the ejection of InHen+, despite the attraction of ions by He droplets. The InHen+ yield shows a characteristic modulation, which exactly follows the previously observed electron yield modulation.15 This similarity clearly identifies the coherent vibrational WP motion in the neutral, electronically excited In2* as intermediate state of the ionization path. The ejection of InHen+ allows us to measure the photoelectron spectrum that is correlated to these ions through covariance detection (Fig. 6). The covariance spectrum further solidifies the assumption that excited In2* molecules are ionized, while dissociation to In atoms before ionization seems not to be relevant. We thus conclude that the ionization path proceeds via ionization of the unfragmented In2* and fragmentation occurs in the cationic state (absorption–ionization–dissociation pathway) and not via fragmentation of the neutral In2* and ionization of In fragments (absorption–dissociation–ionization pathway). This conclusion is deduced from the similarity of the photoelectron spectra associated with InHen+ at short delays and In2+ at long delays, after In2* has been ejected. Such unique insight is exclusively provided by correlation spectroscopy and cannot be determined unambiguously by uncorrelated photoelectron and photoion detection.2 Fragmentation after ionization in the cationic state is initiated by absorption of a second probe photon, as indicated by the probe laser power dependence of the InHen+ yield (Fig. 7). Further insight into the fragmentation process could be gained by measuring the fragment velocities in a velocity map imaging detector, in analogy to Coulomb explosion35 and photofragmentation36 measurements. Such an experiment would be particularly interesting in view of the peculiar ion yield transient, shown Fig. 5, and in terms of energy balance investigations, to gain insight into the droplet-induced deceleration through friction.The feasibility of electron–ion coincidence/covariance detection will be especially interesting for photochemical studies on molecular assemblies inside HeN. The versatile techniques available for loading the droplets will provide access to ultrafast processes in novel dopant–acceptor combinations. Photoinduced processes in such assemblies, like charge transfer, often strongly depend on the cluster size.2 While electron–ion correlation is a prerequisite for a size-selective analysis, fragmentation after ionization in consequence of energy transfer to vibrational modes (absorption–ionization–dissociation pathway), significantly biases results obtained with bare clusters in gas phase. The stabilizing properties of He droplets, acting as a thermal bath40 seems promising to cool the cluster and prevent such misleading fragmentation. Correlation spectroscopy in HeN will potentially help to overcome ambiguities encountered by photoelectron spectroscopy of complex systems in gas phase.
Conflicts of interest
There are no conflicts to declare.References
- A. Stolow, A. E. Bragg and D. M. Neumark, Chem. Rev., 2004, 104, 1719–1757 Search PubMed.
- I. V. Hertel and W. Radloff, Rep. Prog. Phys., 2006, 69, 1897–2003 Search PubMed.
- T. Weinacht and B. J. Pearson, Time-Resolved Spectroscopy: An Experimental Perspective, CRC Press, 2019 Search PubMed.
- P. Maierhofer, M. Bainschab, B. Thaler, P. Heim, W. E. Ernst and M. Koch, J. Phys. Chem. A, 2016, 120, 6418–6423 Search PubMed.
- M. Koch, B. Thaler, P. Heim and W. E. Ernst, J. Phys. Chem. A, 2017, 121, 6398–6404 Search PubMed.
- M. Koch, P. Heim, B. Thaler, M. Kitzler and W. E. Ernst, J. Phys. B: At., Mol. Opt. Phys., 2017, 50, 125102 Search PubMed.
- H. Lippert, V. Stert, L. Hesse, C. P. Schulz, I. V. Hertel and W. Radloff, J. Phys. Chem. A, 2003, 107, 8239–8250 Search PubMed.
- V. Stert, L. Hesse, H. Lippert, C. P. Schulz and W. Radloff, J. Phys. Chem. A, 2002, 106, 5051–5053 Search PubMed.
- H. Lippert, V. Stert, L. Hesse, C. Schulz, W. Radloff and I. Hertel, Eur. Phys. J. D, 2002, 20, 445–448 Search PubMed.
- P. Farmanara, W. Radloff, V. Stert, H.-H. Ritze and I. V. Hertel, J. Chem. Phys., 1999, 111, 633–642 Search PubMed.
- L. J. Frasinski, K. Codling and P. A. Hatherly, Science, 1989, 246, 1029–1031 Search PubMed.
- C. Callegari and W. E. Ernst, in Handbook of High Resolution Spectroscopy, ed. F. Merkt and M. Quack, John Wiley & Sons; Chichester, 2011 Search PubMed.
- A. Schiller, F. Laimer and L. Tiefenthaler, in Molecules in Superfluid Helium Nanodroplets, ed. A. Slenczka and J. P. Toennies, Springer International Publishing; Cham, 2022, pp. 67–153 Search PubMed.
- J. H. Nielsen, D. Pentlehner, L. Christiansen, B. Shepperson, A. A. Søndergaard, A. S. Chatterley, J. D. Pickering, C. A. Schouder, A. V. Muñoz, L. Kranabetter and H. Stapelfeldt, in Molecules in Superfluid Helium Nanodroplets, ed. A. Slenczka and J. P. Toennies, Springer International Publishing; Cham, 2022, pp. 381–445 Search PubMed.
- B. Thaler, M. Meyer, P. Heim and M. Koch, Phys. Rev. Lett., 2020, 124, 115301 Search PubMed.
- C. Giese, F. Stienkemeier, M. Mudrich, A. W. Hauser and W. E. Ernst, Phys. Chem. Chem. Phys., 2011, 13, 18769–18780 Search PubMed.
- M. Mudrich, P. Heister, T. Hippler, C. Giese, O. Dulieu and F. Stienkemeier, Phys. Rev. A: At., Mol., Opt. Phys., 2009, 80, 042512 Search PubMed.
- F. R. Brühl, R. A. Trasca and W. E. Ernst, J. Chem. Phys., 2001, 115, 10220–10224 Search PubMed.
- B. Thaler, S. Ranftl, P. Heim, S. Cesnik, L. Treiber, R. Meyer, A. W. Hauser, W. E. Ernst and M. Koch, Nat. Commun., 2018, 9, 4006 Search PubMed.
- M. Mudrich, A. C. LaForge, A. Ciavardini, P. OKeeffe, C. Callegari, M. Coreno, A. Demidovich, M. Devetta, M. D. Fraia, M. Drabbels, P. Finetti, O. Gessner, C. Grazioli, A. Hernando, D. M. Neumark, Y. Ovcharenko, P. Piseri, O. Plekan, K. C. Prince, R. Richter, M. P. Ziemkiewicz, T. Möller, J. Eloranta, M. Pi, M. Barranco and F. Stienkemeier, Nat. Commun., 2020, 11, 1–7 Search PubMed.
- L. Bruder, M. Koch, M. Mudrich and F. Stienkemeier, in Molecules in Superfluid Helium Nanodroplets, ed. A. Slenczka and J. P. Toennies, Springer International Publishing, Cham, 2022, pp. 447–511 Search PubMed.
- U. Bangert, F. Stienkemeier and L. Bruder, Nat. Commun., 2022, 13, 3350 Search PubMed.
- M. P. Ziemkiewicz, D. M. Neumark and O. Gessner, Int. Rev. Phys. Chem., 2015, 34, 239–267 Search PubMed.
- M. Mudrich, F. Stienkemeier, G. Droppelmann, P. Claas and C. P. Schulz, Phys. Rev. Lett., 2008, 100, 023401-1–4 Search PubMed.
- A. C. LaForge, M. Shcherbinin, F. Stienkemeier, R. Richter, R. Moshammer, T. Pfeifer and M. Mudrich, Nat. Phys., 2019, 15, 247–250 Search PubMed.
- S. R. Krishnan, L. Fechner, M. Kremer, V. Sharma, B. Fischer, N. Camus, J. Jha, M. Krishnamurthy, T. Pfeifer, R. Moshammer, J. Ullrich, F. Stienkemeier, M. Mudrich, A. Mikaberidze, U. Saalmann and J.-M. Rost, Phys. Rev. Lett., 2011, 107, 173402 Search PubMed.
- M. Kelbg, M. Zabel, B. Krebs, L. Kazak, K.-H. Meiwes-Broer and J. Tiggesbäumker, Phys. Rev. Lett., 2020, 125, 093202 Search PubMed.
- L. Treiber, B. Thaler, P. Heim, M. Stadlhofer, R. Kanya, M. Kitzler-Zeiler and M. Koch, Nat. Commun., 2021, 12, 4204 Search PubMed.
- M. Theisen, F. Lackner and W. E. Ernst, Phys. Chem. Chem. Phys., 2010, 12, 14861 Search PubMed.
- P. Bartl, C. Leidlmair, S. Denifl, P. Scheier and O. Echt, J. Phys. Chem. A, 2013, 118, 8050–8059 Search PubMed.
- S. Smolarek, N. B. Brauer, W. J. Buma and M. Drabbels, J. Am. Chem. Soc., 2010, 132, 14086–14091 Search PubMed.
- F. Filsinger, D.-S. Ahn, G. Meijer and G. V. Helden, Phys. Chem. Chem. Phys., 2012, 14, 13370–13377 Search PubMed.
- P. Kruit and F. Read, J. Phys. E: Sci. Instrum., 1983, 16, 313–324 Search PubMed.
- J. von Vangerow, F. Coppens, A. Leal, M. Pi, M. Barranco, N. Halberstadt, F. Stienkemeier and M. Mudrich, J. Phys. Chem. Lett., 2017, 8, 307–312 Search PubMed.
- L. Christiansen, J. H. Nielsen, L. Christensen, B. Shepperson, D. Pentlehner and H. Stapelfeldt, Phys. Rev. A, 2016, 93, 023411 Search PubMed.
- A. Braun and M. Drabbels, J. Chem. Phys., 2007, 127, 114303 Search PubMed.
- A. Kramida, Y. Ralchenko, J. Reader and NIST ASD Team, NIST Atomic Spectra Database (ver. 5.9), [Online]. Available: https://physics.nist.gov/asd [2022, July 4]. National Institute of Standards and Technology, Gaithersburg, MD, 2021 Search PubMed.
- M. D. Johnston, S. P. Lockwood and R. B. Metz, J. Chem. Phys., 2018, 148, 214308 Search PubMed.
- N. B. Brauer, S. Smolarek, E. Loginov, D. Mateo, A. Hernando, M. Pi, M. Barranco, W. J. Buma and M. Drabbels, Phys. Rev. Lett., 2013, 111, 153002 Search PubMed.
- A. Scheidemann, B. Schilling and J. P. Toennies, J. Phys. Chem., 1993, 97, 2128–2138 Search PubMed.
Footnote |
| † These authors equally contributed. |
| This journal is © the Owner Societies 2022 |

