 Open Access Article
Creative Commons Attribution 3.0 Unported Licence
Happy photocatalysts and unhappy photocatalysts: electron trap-distribution analysis for metal oxide-sample identification
Bunsho
Ohtani
 * and
Mai
Takashima

Institute for Catalysis, Hokkaido University, Sapporo 001-0021, Japan. E-mail: ohtani@cat.hokudai.ac.jp
First published on 22nd November 2021
Abstract
A strange story, including a new concept of identification of inorganic solid materials and of photocatalyst design, is told here. Why is it that solid materials have not been identified, while organic chemists are required to identify their organic compounds for publication of a report? What is the meaning of identification? Why is it almost impossible to identify inorganic solids? Is it possible to identify an inorganic solid by using a certain fingerprint? Can energy-resolved distribution of electron traps (ERDT) patterns be fingerprint of solid materials? What do ERDT/CBB (conduction-band bottom) patterns tell us about the photocatalytic activity of titania samples?
Identification
Why don't organic chemists get angry about the fact that material scientists do not need to identify their solid products at all, while organic chemists are required to identify their molecular chemicals strictly by elemental composition and nuclear magnetic resonance (or other) analyses when they submit original papers? Before answering the question, it is necessary to consider why such a rule, strict identification of organic compounds, has been established. It might be due to possible confusion when unidentified or misidentified chemicals are reported, i.e., reproducibility cannot be guaranteed without specification (identification) of chemicals.1 Then, for inorganic solid compounds, which do not need to be identified, is there no confusion? It may be commonly experienced that solid catalysts prepared by different researchers using the same recipe, solid samples purchased as the same code name or catalysts stored in different drawers show different properties, performance or activities even though they show no differences in conventional analyses. Yes, material scientists, at least the present authors, believe that there must be undetectable or even indescribable structural differences among those materials because properties, performance or activities must be governed by the “structure” of materials.What is identification?
Going back to identification of organic compounds, the scientific definition of “identification” should be reconsidered. In the field of modern organic chemistry, identification means naming the target molecule following the IUPAC (International Union of Pure and Applied Chemistry) rules for nomenclature. For example, palytoxin, one of the largest identified organic compounds without repeating moieties, is the popular name and the official IUPAC name is too long to show in the main text (see ref. 2). A significant point is that the IUPAC name is unique, i.e., the structure is perfectly specified; inputting this IUPAC name to an application (software) leads to the display of structural formula of palytoxin. Thus, the meaning of identification in the field of organic chemistry is that the molecular formula of a target compound is described by a text, i.e., an IUPAC name.3 Then, the answer for the first question in this article is because, practically speaking, we, chemists, know that inorganic solids cannot be named to show their structure. Actually, in a book of “Nomenclature of Inorganic Chemistry”,4 it is stated, as nomenclature and notation for inorganic solids, “however, in cases where detailed structural information is to be conveyed, fully systematic names can be difficult to construct”. Thus, material scientists are exempt from identification of solid samples by using IUPAC names because the structures of inorganic solids are “indescribable”.5Surface and amorphous-phase structures
Then, do we need to keep worrying about possible confusion, misunderstandings or resignations due to not identifying solid samples? The answer is yes if the identification can be made ONLY by putting a name, i.e., describing the exact structure of the sample.What should be described to specify solid samples? Or what can be described as structural parameters of solid samples? The only possible describable parameter for a solid structure is the bulk crystalline phase, which can be specified by the unit-cell structure, i.e., bulk crystalline structure is described as a crystal name, e.g., anatase, rutile or brookite for titanium(IV)–oxide (titania) samples. However, if amorphous phase(s) is (are) included, we have no way to describe it and the most important problem is we tend to ignore the amorphous phase without checking its presence/absence and knowing its real structure, even composition, since there are no macroscopic, not microscopic, analytical methods for non-crystalline phases. In a similar sense, we often (want to) recognize surface structure as an attachment of the bulk crystalline structure, e.g., “anatase surface”. Again, there are no macroscopic analytical methods for a solid surface structure. Even if we can describe the bulk and surface structures of solid samples, the size of the bulk, particle size, or the size of the surface, specific surface area, should also be described for identification, since properties, performances or activity must have dependence on size.6 Anyway, what inhibits the identification of solid materials is the lack of macroscopic analytical methods to characterize surface and amorphous-phase structures.
Fingerprint
As described above, we have to give up on the idea of identifying solid materials by using names that enable specification of their exact structures. Is there another way for identification?When one of the present authors (bo) was a graduate student, (probably) every chemical laboratory had an infrared spectrometer (IR) for characterization and identification of chemicals (not limited to organic compounds). A part of the IR spectrum in the 650–1300 cm−1 wavenumber region was called a “fingerprint” region; if a sample shows a spectrum in that region that is the same as that of an authentic sample, the sample can be identified to be an authentic sample (still there was/is a problem of how those authentic samples had/have been identified, then). At present, an IR spectrum (and also an NMR spectrum) can be simulated, and all of the peaks are interpreted with molecular formulae, but, at that time, a fingerprint in an IR spectrum did not give the precise structure itself. What was assumed in the fingerprint identification is that chemicals have at least a slight (appreciable/detectable) difference in their fingerprints if they have different structures.
Therefore, if we can obtain a “fingerprint”, reflecting the bulk structure, surface structure and bulk/surface size, of a solid sample, the sample can be identified. In this case, analytical methods for obtaining a sample's fingerprint should be macroscopic.
Electron trap-distribution analysis
The team of the authors define the term “electron trap” of solid materials as an electronic state in which electrons can be accepted and stored. For example, photoirradiation of white titania or light-yellow tungsten(VI) oxide in the presence of an electron donor such as methanol turned the color to gray or blue, respectively, due to the formation of titanium(III) (Ti(III)) or tungsten(V) cations.7 By measuring the amounts of those reduced species in titania samples using methyl viologen, it was found that the amount was saturated by prolonged photoirradiation time and that the saturated amount depended on the kind of titania samples,7i.e., not all of the titanium(IV) ions are reduced to Ti(III) to give a low-valent titanium oxide such as Ti2O3.Based on the assumption that those electron traps have an energy distribution, our group developed a method, reversed double-beam photoacoustic spectroscopy (RDB-PAS), to measure the energy-resolved distribution of electron traps (ERDT) of solid samples.8–10 By combining a datum on conduction-band bottom (CBB) energy, measured using the same setup, an ERDB/CBB pattern is obtained for each solid sample. We started the measurement with titania and then expanded to metal oxides to obtain ERDT/CBB patterns. A few exceptions that did not give any detectable ERDT patterns were nickel(II) oxide, manganese(IV) oxide and pure silica, alumina and zirconia, presumably due to the p-type semiconducting property, intense original absorption at the detection-light wavelength11 and band-gap energy larger than the limit of the RDB-PAS instrument,12 respectively.
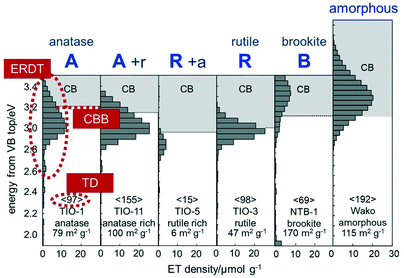
Fig. 1 shows several ERDT/CBB patterns of representative commercial titania samples. It is clear that the ERDT-pattern shape and position as well as the CBB position were at least slightly different depending on the kind of sample and crystalline structure. A significant point is that amorphous titania also showed similar, but a relatively higher energy-shifted (at least partly due to larger energy gap of amorphous phase than that of crystalline titania), ERDT pattern;13 this might be a little strange when compared with the results obtained by conventional analytical methods for solids. Looking at those patterns, pure (but maybe containing an amorphous phase) anatase and rutile samples showed CBB at ca. 3.2 and 3.0 eV, respectively, and these CBB positions were observed also for the other commercial anatase and rutile samples. On the other hand, the anatase rutile-mixed samples (A + r/R + a in Fig. 1 and the other mixture samples) gave different CBB positions between 3.0 and 3.2 eV presumably depending on the anatase/rutile ratio, strongly suggesting that CBB reflects the bulk structure. For the total density (TD; shown in < >) of electron traps, it has been observed that TD was increased with the increase in the specific surface area of commercial titania samples as has been reported previously.8,9,13 This tells us that detected electron traps are not something like point defects randomly formed on the surface but most possibly located in the surface reconstructed structures. If this hypothesis is correct, an ERDT pattern reflects the exposed-surface structure of a sample, and thereby different-morphology particles exposing different kind of lattice facets may give different ERDT patterns. Consequently, CBB, ERDT pattern and TD reflect bulk structure, surface structure and size, respectively, as minimum requisites for solid identification, suggesting that ERDT/CBB patterns can be used as fingerprints of solid materials, at least for titania and other metal oxides (the ERDT/CBB-pattern analyses of solid samples other than metal oxides have already been reported, e.g., carbon nitride,14a layered hydroxide,14b,c and oxyhalides14d).
Degree of coincidence of ERDT/CBB patterns
Then, it seems necessary to examine whether ERD/CBB patterns REALLY identify solid samples or not, though there are at least two problems for this examination. First, all of the parameters, ERDT, CBB and TD, are obtained as analogue data and therefore it is impossible to state digitally, identical/not identical. This is the same for the analysis of (real) fingerprints or DNA for criminal investigations; probability of sample (human) identicalness is shown. Similarly, we introduced a novel index, degree of coincidence by comparison of ERDT/CBB patterns, as shown in the next paragraph. The second problem is that nobody knows how to show whether the ERDT/CBB patterns can specify samples, i.e., how to exclude the possibility that samples exhibiting identical (similar) ERDT/CBB patterns show different properties, performances or activities. This will be discussed in the next section.To calculate the degree of coincidence of ERDT/CBB patterns of a pair of samples, three partial degrees of coincidence are introduced: (i) ERDT-pattern shape without considering the absolute density (ζ(S)), (ii) TD (ζ(D)) and (iii) CBB (ζ(C)) are compared to give each partial degree of coincidence with a 0 (completely different)–1 (identical) range and overall degree of coincidence (ζ) is obtained as a product of the three partial degrees of coincidence.15,16 It has been shown16 that ζ > 0.9 was obtained for a commercial titania sample if sampled carefully from almost the same position in the same container, though ζ was decreased to ca. 0.7–0.8 (but still high enough to be “similar” as shown in the next section) when samples were taken from different positions in the same container.17 These results tell us that ERDT/CBB-pattern analysis is very sensitive to the solid structure, especially the surface structure,17 and that there must be detectable heterogeneity18 in samples even in the same container.19 Anyway, it is expected that the overall degree of coincidence ζ can be used to show identicalness, similarity or differentness of a pair of samples.
Elephant plot
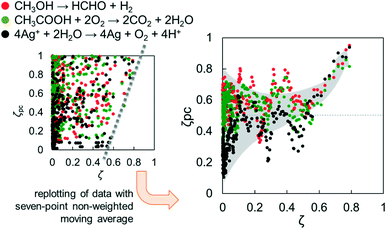
Considering the minimum requisites for solid identification, bulk structure, surface structure and bulk/surface size, are reflected in CBB, ERDT and TD, respectively, in the ERDT/CBB patterns, it is expected that ERDT/CBB patterns can be “fingerprints” of solid materials (at least metal oxides such as titania), but there must be no deductive way to prove this, i.e., it is necessary to continue accumulation of positive results showing appropriateness of the use of ERDT/CBB patterns as fingerprints.Fig. 2 (left) shows a plot of the degree of coincidence of photocatalytic activity (ζPC) in three photocatalytic reactions for a large number of pairs of commercial titania samples as a function of ζ.16 At a glance, the plots are very scattered and there seems to be no correlation between them, but there are no plots in the region of high ζ and low ζPC. In other words, no titania-sample pairs of high ζ gave low ζPC. Fig. 2 (right) is a replot after smoothing by taking the seven-point non-weighted moving average, clearly showing that the plots are scattered at ζ < 0.6, while ζPC increases with increasing ζ at ζ > 0.6 to reach almost unity at ζ > 0.8.20 The reason for this is that different (ζ < 0.6) titania sample pairs show accidentally similar or different activities, but similar sample pairs show similar photocatalytic activities. When we submitted a paper including this plot, a reviewer said “it is not surprising and not a novel finding to see that similar titania photocatalysts show similar photocatalytic activities”. That is true, but that was the first time, as far as we know, for the similarity of solid samples to be evaluated quantitatively using ζ (and therefore the paper was accepted and published8).
Such an elephant plot (like an elephant lifting its nose) can be obtained for other metal oxides such as niobium(V) oxide and cerium(IV) oxide.21 For the process of a photocatalytic reaction, it is probable to assume that electron transfer at the surface of the photocatalyst occurs through electron traps on the surface and this caused the similarity of activities among the samples exhibiting similar ERDT/CBB patterns. However, it has been clarified that even similar physical properties of powder samples, e.g., polishing ability as an abrasive, are observed for sample pairs of high ζ.22
What is active?
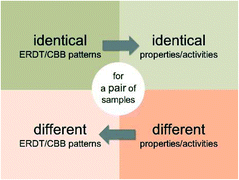
It might be true that similar photocatalysts show similar photocatalytic activities and that samples with different activities show different ERDT/CBB patterns. On the other hand, there is no guarantee for that samples with different patterns show different activities and samples with similar activities show similar patterns, as can be seen in Fig. 2 as a scattered plot in the low ζ (<0.6) range (Scheme 1). | ||
| Scheme 1 True propositions related to identicalness/differentness of ERDT/CBB patterns and properties/activities of samples. | ||
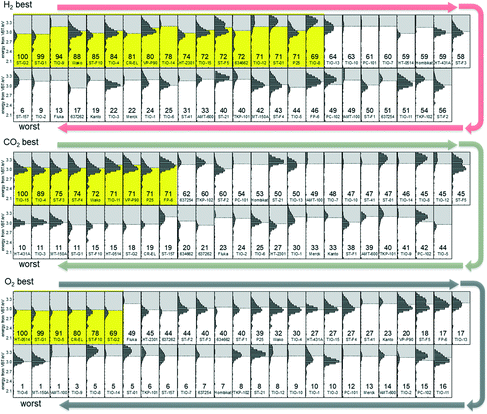
Fig. 3 shows ERDT/CBB patterns of titania samples arranged in descending order of photocatalytic activity for the three kinds of reactions. There seems to be, at a glance, nothing to be noticed, but for the carbon-dioxide and oxygen evolution photocatalytic reactions, ERDT/CBB patterns were similar among the samples with activity higher than two thirds relative activity in each series, while the samples with activity less than two thirds had no similarity in patterns of the neighborhood.
One possible explanation for this is as follows. Photocatalysis is initiated by photoabsorption, i.e., photoexcitation of electrons in the valence band to the conduction band, followed by reaction of excited electrons and positive holes or their recombination. Consequently, the rate of photocatalytic reaction is controlled by the product, but not summation, of efficiencies in, for example, photoabsorption, migration of electron/positive holes escaping their mutual recombination (quantum efficiency), and thereby a certain efficiency reduces the overall rate significantly even if the other efficiencies are sufficiently high. Since (probably) a number of structural parameters have an influence on those efficiencies, similar relatively medium or low levels of activity could be observed even if the detrimental parameter(s) is different. On the other hand, samples possessing well-balanced structural parameters, giving similar ERDT/CBB patterns, show relatively high levels of photocatalytic activity. Since the commercial titania samples used in this study are probably prepared in conventional processes, preparation of a titania photocatalyst with activity higher than 100% may require the development of a novel process or use of an unconventional precursor.
On the other hand, hydrogen-evolution photocatalysts with relatively high activity did not show similarity in ERDT/CBB patterns. Since platinum was deposited in situ, i.e., photoinduced loading of platinum was performed, and only platinum-loaded particles can produce hydrogen, structural characteristics of the photocatalyst may have an influence on both platinum deposition and hydrogen evolution reactions possibly in different ways and therefore there might be no similarity in the neighborhood in Fig. 3. Consequently, it is expected that titania photocatalysts with relative activity higher than 100% can be prepared by controlling the reaction conditions.
Happy photocatalysts and unhappy photocatalysts
One of the present authors (bo) was invited to give a lecture on material science for graduate students in Kyoto University. After the lecture, a graduate student came to the author and said that he found that the different ERDT/CBB patterns of the middle/low activity titania samples resemble Liebig's law of the minimum23 on plant growth; the rate of plant growth is determined solely by the minimum (lowest) factor among many parameters such as water, temperature, sunlight or nitrogen, which is similar (or conceptually identical) to the rate-determining step in a chemical reaction. Yes, the ERDT/CBB-pattern analysis suggests that for the middle/low-activity samples, modification of only the minimum factor (structural property) might not lead to higher activity since a second minimum may be there.Then, another graduate student came to ask the author: “Do you know the first sentence of the novel Anna Karenina24 by Leo Nikolayevich Tolstoy, ‘Happy families are all alike; every unhappy family is unhappy in its own way’?.” Yes, happy (active) photocatalysts are all alike; every unhappy (inactive) photocatalyst is unhappy in its own way.
Those exciting and interesting conversations made the authors recognize the significance of identification of materials, even inorganic solids, and the necessity of novel concepts and methodologies for active photocatalyst design.
Author contributions
Both authors cooperatively wrote the manuscript.Conflicts of interest
There are no conflicts to declare.Acknowledgements
The authors acknowledge co-authors of related papers, laboratory members and all of the people who had discussions with us on solid-material identification.Notes and references
- Misidentifications of organic compounds have still been reported, though, e.g. K. C. Nicolaou and S. A. Snyder, Angew. Chem., Int. Ed., 2005, 44, 1012 CrossRef CAS PubMed.
- IUPAC name of palytoxin: (2S,3R,5R,8R,9S,E)-10-((2R,3R,4R,5S,6R)-6-((1S,2R,3S,4S,5R,11S)-12-((1R,3S,5S,7R)-5-((S)-9-((2R,3R,4R,5R,6S)-6-((2S,3S,6S,9R,10R,E)-10-((2S,4R,5S,6R)-6-((2R,3R)-4-((2R,3S,4R,5R,6S)-6-((2S,3Z,5E,8R,9S,10R,12Z,17S,18R,19R,20R)-21-((2R,3R,4R,5S,6R)-6-((3R,4R,Z)-5-((1S,3R,5R,7R)-7-(2-((2R,3R,5S)-5-(aminomethyl)-3-hydroxytetrahydrofuran-2-yl)ethyl)-2,6-dioxabicyclo[3.2.1]octan-3-yl)-3,4-dihydroxypent-1-en-1-yl)-3,4,5-trihydroxytetrahydro-2H-pyran-2-yl)-2,8,9,10,17,18,19-heptahydroxy-20-methyl-14-methylenehenicosa-3,5,12-trien-1-yl)-3,4,5-trihydroxytetrahydro-2H-pyran-2-yl)-2,3-dihydroxybutyl)-4,5-dihydroxytetrahydro-2H-pyran-2-yl)-2,6,9,10-tetrahydroxy-3-methyldec-4-en-1-yl)-3,4,5,6-tetrahydroxytetrahydro-2H-pyran-2-yl)-8-hydroxynonyl)-1,3-dimethyl-6,8-dioxabicyclo[3.2.1]octan-7-yl)-1,2,3,4,5-pentahydroxy-11-methyldodecyl)-3,4,5-trihydroxytetrahydro-2H-pyran-2-yl)-2,5,8,9-tetrahydroxy-N-((E)-3-((3-hydroxypropyl)amino)-3-oxoprop-1-en-1-yl)-3,7-dimethyldec-6-enamide.
- Although organic chemists may get angry, there is no guarantee that all of the structural parameters, to be specified for identification, have been discovered. A long time ago, we did not know the necessity to specify the stereochemical structure.
- N. G. Connelly, T. Damhus, R. M. Hartshorn and A. T. Hutton, Nomenclature of Inorganic Chemistry, IUPAC Recommendations 2005, The Royal Society of Chemistry, IUPAC, 2005, p. 236 Search PubMed.
- The present authors' understanding is that meanings of “indescribable” and “undescribable” are “difficult to describe, i.e., of little opportunity to describe” and “impossible to describe”, respectively.
- In the strict scientific sense, what we know as size-dependence seems just a speculation, because it is impossible to prepare a series of samples with different particle sizes without changing the bulk and surface structure (even if they are specified).
- S. Ikeda, N. Sugiyama, S.-Y. Murakami, H. Kominami, Y. Kera, H. Noguchi, K. Uosaki, T. Torimoto and B. Ohtani, Phys. Chem. Chem. Phys., 2003, 5, 778–783 RSC.
- A. Nitta, M. Takase, M. Takashima, N. Murakami and B. Ohtani, Chem. Commun., 2016, 52, 12096–12099 RSC.
- A. Nitta, M. Takashima, N. Murakami, M. Takase and B. Ohtani, Electrochim. Acta, 2018, 264, 83–90 CrossRef CAS.
- There is no space to introduce the principle and measurement procedures of RDB-PAS and to discuss the physical meaning of ERDT patterns. For details, see ref. 8 and 9.
- This problem would be solved if an intense near-infrared LED is available.
- This problem would be solved if a spectrometer emitting intense monochromatic light of a wavelength shorter than 250 nm is available.
- (amorphous titania) G. Chen, M. Takashima and B. Ohtani, Chem. Lett., 2021, 50, 644–648 CrossRef CAS.
- (a) C. Chuaicham, S. Karthikeyan, R. R. Pawar, Y. Xiong, I. Dabo, B. Ohtani, Y. Kim, J. T. Song, T. Ishihara and K. Sasaki, Chem. Commun., 2020, 56, 3793–3796 RSC; (b) C. Chuaicham, Y. Xiong, K. Sekar, W. Chen, L. Zhang, B. Ohtani, I. Dabo and K. Sasaki, Appl. Surf. Sci., 2021, 546, 148835 CrossRef CAS; (c) C. Chuaicham, R. R. Pawar, S. Karthikeyen, B. Ohtani and K. Sasaki, J. Colloid Interface Sci., 2020, 577, 397–405 CrossRef CAS PubMed; (d) C. Chuaicham, K. Sekar, B. Vellaichamy, J. Uchida, T. Katsurao, H. Sakabe, B. Ohtani and K. Sasaki, J. Colloid Interface Sci. Search PubMed submitted.
- Considering the meanings, ζ(S), ζ(D) and ζ(C) may correspond to surface structure, bulk/surface size and bulk structure, respectively. In practice, light (0.5) and heavy (2) weights are put on ζ(D) and ζ(C), respectively, by checking the standard deviation of actual results, as described in detail in the paper16.
- A. Nitta, M. Takashima, M. Takase and B. Ohtani, Catal. Today, 2019, 321–322, 2–8 CrossRef CAS.
- This is caused by the lower ζ(S), i.e., the surface-structure parameter, suggesting a possible appreciable difference in surface structures. This might be the reason why we have not recognized such a difference among powder samples, since we could not obtain macroscopic surface analytical results before the development of RDB-PAS.
- It has been suggested that the well-known commercial titania sample Evonik P25 has heterogeneity in the crystal content that is easily detected by X-ray diffractometry: B. Ohtani, O.-O. Prieto-Mahaney, D. Li and R. Abe, J. Photochem. Photobiol., A, 2010, 216, 179–182 CrossRef CAS.
- Another problem may be raised by seeing these results; product name, sample name or code name of a sample is just a label, suggesting similarity but possible inclusion of some differentness, as, e.g., “benzene-like something”. The other problem is how we can prepare a standard sample with high homogeneity for RDB-PAS measurement at least in order to check the reproducibility of ERDT/CBB-pattern acquisition.
- This suggests that a pair of titania samples with ζ > 0.8 can be said to be “identical” as photocatalysts.
- Y. Murakami, A. Nitta, M. A. Akanda, M. Takashima, M. Nagao and B. Ohtani, J. Phys. Chem. C Search PubMed in preparation.
- M. A. Akanda, M. Takashima and B. Ohtani, Catalysts Search PubMed to be submitted.
- T. R. Sinclair and W. R. Park, Agron. J., 1993, 85, 472–476 Search PubMed.
- https://en.wikipedia.org/wiki/Anna_Karenina .
| This journal is © The Royal Society of Chemistry 2022 |


