 Open Access Article
Independent and combined impact of texture manipulation on oral processing behaviours among faster and slower eaters†
R.
Janani
 a,
Vicki Wei Kee
Tan
a,
Ai Ting
Goh
a,
Vicki Wei Kee
Tan
a,
Ai Ting
Goh
 a,
Michelle Jie Ying
Choy
a,
Amanda JiaYing
Lim
a,
Michelle Jie Ying
Choy
a,
Amanda JiaYing
Lim
 a,
Pey Sze
Teo
*a,
Markus
Stieger
b and
Ciarán G.
Forde
 *b
*b
aClinical Nutrition Research Centre (CNRC), Singapore Institute for Food and Biotechnology Innovation, Agency for Science, Technology and Research (A*STAR), Singapore. E-mail: teo_pey_sze@sifbi.a-star.edu.sg
bWageningen University, Sensory Science and Eating Behaviour, Division of Human Nutrition and Health, P.O. Box 17, 6700 AA Wageningen, The Netherlands. E-mail: ciaran.forde@wur.nl
First published on 22nd August 2022
Abstract
Background: Food texture can moderate eating rate and ad libitum energy intake. Many foods are combined with condiments when consumed and the texture and eating properties differ considerably between condiments and carrier foods. Little is known about how combinations of textures impact oral processing or whether these differences are affected by individual eating-styles. Objective: We investigated the impact of texture parameters (unit size, thickness, hardness and lubrication) on oral processing behaviours for carrots and rice-crackers, and tested whether these behaviours differ between ‘faster’ and ‘slower’ eaters. Method: Seventy participants (34 males, 26.0 ± 5.4 years, BMI = 21.5 ± 1.7 kg m−2) consumed 24 weight-matched carrot samples varying in unit size (large/medium/small), thickness (thick/thin), hardness (hard/soft) and lubrication (with/without mayonnaise). In a second step, participants consumed 8 weight-matched cracker samples varying in unit size (large/small), hardness (hard/soft) and lubrication (with/without mayonnaise). Sample consumption was video-recorded for post hoc behavioural annotation to derive specific oral processing behaviours. Participants were divided into ‘faster’ or ‘slower’ eater groups using a post hoc median split based on eating rate of raw carrot. Results: Across texture parameters, hardness had the largest influence (p < 0.001) on eating rate for both carrots and crackers. The independent texture differences for carrot ranked from most to least impact on eating rate was hardness > thickness > lubrication > unit size. For crackers, the rank order of eating rate was hardness > lubrication > unit size. Harder carrot samples with decreased unit size and reduced thickness combined had a larger synergistic effect in reducing eating rate (p < 0.001) than manipulation of any single texture parameter alone. Reducing the unit size of crackers while increasing hardness without lubrication combined (p = 0.015) to produce the largest reduction in eating rate. There were no significant differences between fast and slow eaters on their oral processing behaviours across texture manipulations. Conclusions: Combinations of texture manipulations have the largest impact in moderating oral processing behaviours, and this is consistent across ‘faster’ and ‘slower’ eaters. Changing food-texture presents an effective strategy to guide reformulation of product sensory properties to better regulate eating rate and energy intake, regardless of an individual's natural eating-style.
1. Introduction
Rising rates of diet related non-communicable diseases are associated with the nutrient and eating properties of the modern food environment, and signal the need to develop strategies to help mitigate risks associated with habitual energy overconsumption.1,2 Diets that are both higher in energy density and can be consumed at faster eating rates have been linked to both higher daily energy intakes and increased body mass index (BMI) and fat mass.3,4 Dietary interventions that help reduce the rate and extent of energy intake can help moderate ad libitum energy intake, and offer support to populations at risk of overweight and obesity. Parallel efforts have been made to increase energy intake among vulnerable populations at risk of malnutrition such as the elderly and consumers with impaired masticatory performance.5 Evidence from human feeding trials has shown that the speed at which one eats influences ad libitum energy consumption, with faster eating rates associated with increased energy intake.6–12 Eating rate can be manipulated through the use of verbal instructions6 or through digital visual prompts.10,13 However, this requires a conscious effort for consumers to adapt their eating rate in response to a cue unrelated to the food consumed. Previous research has shown that modifying a food's texture properties offers an effective strategy to moderate eating rate and subsequent energy intake, as consumers adapt their oral processing behaviour and eating rate to the textures experienced during consumption.14,15Several studies to date have explored how food textural properties such as hardness,7,16,17 chewiness,18,19 viscosity,9,20,21 lubrication22–24 and the shape and size of food pieces25–31 influence oral processing behaviour and eating rate. Findings indicate that not all texture manipulations have an equivalent impact on oral processing behaviour and eating rate.32 Most studies to date have investigated the impact of food texture manipulations along a single dimension, such as manipulating viscosity of liquid foods or hardness of solid foods, and observing the subsequent change in oral processing behaviour and eating rate. Less is known about the impact of combined texture modifications such as the combined manipulations of a food's shape, mechanical and tribological properties, and their interactions on oral processing behaviour and eating rate. A recent study investigated the effect of variations to food size, shape and lubrication on oral processing for carrots that were consumed with and without a condiment (i.e. lubrication). Results showed that reducing lubrication, food size and changing food shape from cube to julienne combined decreased eating rate the most.30 However, these interactions are often not intuitive, and require further research to gain a better understanding of the combined texture manipulations that will have the largest impact on oral processing within and across foods of different texture properties. In addition, little is known about the rank order of effects for different texture manipulations within a food and across different foods, when comparing their influence on oral processing. A deeper understanding of the magnitudes of individual and combined effects of the texture parameters could support the development of foods with adapted textures to better guide reformulation of products that can be applied to moderate eating rate, and energy consumption.
Eating rate has been shown to be consistent within an individual over time, yet there is wide variation in eating rates between people.33–35 Little research to date has compared the impact of texture manipulations on oral processing between consumers differing in eating style, such as faster and slower eaters. In a recent study, Goh and colleagues demonstrated that increasing food hardness and chewiness reduced the eating rate of slower eaters, but did not change the eating rate of faster eaters.36 For food texture manipulations to have a universal application, it should exert a consistent influence on both oral processing and eating rate, independent of any underlying differences in eating style. It remains unclear whether differences in an individual's eating rate impact the consistency of the effect of food texture manipulations on oral processing behaviour and eating rate at a population level. Additional research is required to compare differences in eating behaviour observed between faster and slower eaters when multiple texture parameters are manipulated within the same test foods.
The current study investigated the relative influence of a series of food texture variables, namely, unit size, thickness, hardness and lubrication on oral processing behaviour to determine their independent and combined impact on eating rate. Food texture differences were compared in two contrasting food systems (i) carrots (springy/high moisture content) and (ii) crackers (brittle/low moisture content). In a second step, we further sought to compare the impact of food texture manipulations on oral processing behaviour and eating rate between faster and slower eaters.
2. Materials and methods
2.1 Overview of experimental approach
To compare the influence of textural manipulations on oral processing behaviour, participants were video-recorded consuming 24 variants of weight-matched carrot samples (Table 1) and 8 variants of weight-matched cracker samples (Table 2) that differed in unit size, thickness, hardness and lubrication across three test sessions. Video recordings of each participant consuming each sample were analysed post hoc to extract key oral processing characteristics using a pre-defined behavioural coding scheme. The samples were presented in randomised blocks for each test food using a within-subject experimental design where all test samples were consumed by all participants. To determine whether natural variations in participant eating rate impacts the effect of texture on oral processing, participants’ natural eating speed of raw carrots was objectively characterised during a first screening session and used to split participants into ‘faster’ and ‘slower’ eater groups.| Hardness | Hard/soft | |||||||||||
|---|---|---|---|---|---|---|---|---|---|---|---|---|
| Unit sizea | Large (8 cm) | Medium (3 cm) | Small (1.5 cm) | |||||||||
| Thicknessb | Thick (1 cm) | Thin (0.5 cm) | Thick (1 cm) | Thin (0.5 cm) | Thick (1 cm) | Thin (0.5 cm) | ||||||
| Lubrication (lub) | Lub | No lub | Lub | No lub | Lub | No lub | Lub | No lub | Lub | No lub | Lub | No lub |
a Unit size is defined as the length of one carrot piece.
b Thickness is defined as the width of one carrot piece.
c Total weight of carrots refers to weight of carrots only. Samples with lubrication were served with 1 ± 0.04 g of mayonnaise, so at a total sample weight of 12 ± 0.8 g. The ratio between lubricant (mayonnaise) and carrot sample is 1![[thin space (1/6-em)]](https://www.rsc.org/images/entities/char_2009.gif) : :![[thin space (1/6-em)]](https://www.rsc.org/images/entities/char_2009.gif) 11. 11.
|
||||||||||||
| Number of pieces | 1 | 1 | 4 | 4 | 3 | 3 | 11 | 11 | 5 | 5 | 20 | 20 |
| Image |

|

|

|

|

|

|

|

|

|

|

|

|
| Total weight of carrotsc (g) | 11 ± 0.8 | |||||||||||
| Shape | Rectangular | |||||||||||
| Hardness | Hard | Soft | ||||||
|---|---|---|---|---|---|---|---|---|
| Unit sizea | Large (8.2 cm) | Small (5 cm) | Large (8.2 cm) | Small (5 cm) | ||||
| Lubrication (lub) | Lub | No lub | Lub | No lub | Lub | No lub | Lub | No lub |
a Unit size is defined as the diameter of one cracker.
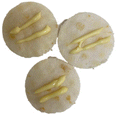
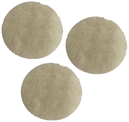
b Total weight of cracker refers to weight of crackers only. Samples with lubrication were served with 2 ± 0.04 g of mayonnaise, so at a total sample weight of 22 ± 0.9 g for hard crackers and 9 ± 0.7 g for soft crackers. The ratio between lubricant and hard cracker is 1![[thin space (1/6-em)]](https://www.rsc.org/images/entities/char_2009.gif) : :![[thin space (1/6-em)]](https://www.rsc.org/images/entities/char_2009.gif) 10 while the ratio between lubricant and soft cracker is 2 10 while the ratio between lubricant and soft cracker is 2![[thin space (1/6-em)]](https://www.rsc.org/images/entities/char_2009.gif) : :![[thin space (1/6-em)]](https://www.rsc.org/images/entities/char_2009.gif) 7.
c The difference in weight between the hard and soft cracker was corrected for by multiplying the weight-derived oral processing parameters (bite size, chews per gram, eating rate) by a correction factor for the hard crackers. 7.
c The difference in weight between the hard and soft cracker was corrected for by multiplying the weight-derived oral processing parameters (bite size, chews per gram, eating rate) by a correction factor for the hard crackers.  . .
|
||||||||
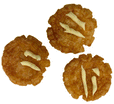
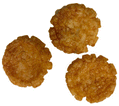
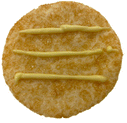
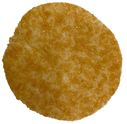
| Number of pieces | 1 | 1 | 3 | 3 | 1 | 1 | 3 | 3 |
|
|
|
|
|
|
|
|
|
| Total weight of crackersb (g) | 20 ± 0.9c | 7 ± 0.7 | ||||||
| Thickness (cm) | 0.75 cm | |||||||
| Shape | Circular | |||||||
2.2 Participants and power calculation
A power calculation based on previous food texture and oral processing studies showed that a minimum of 12 participants was required to detect differences in eating rate of up to 30% between foods, using a within-subject variation of 29% with 90% power and α = 0.05.11,18 A recent study by Goh and colleagues compared natural variations in eating rate and oral processing behaviour in a group of 39 participants divided into ‘faster’ (n = 15) and ‘slower’ (n = 24) eaters.36 The current study recruited a larger number of participants (n = 70) to enable segmentation into ‘faster’ and ‘slower’ eating rate groups, and to account for participant dropouts and missing data. Healthy participants (n = 70, 34 males) with a mean age of 26.0 ± 5.4 years were recruited from the general public of Singapore. Participants were within the normal range for body mass index (18.5–25.0 kg m−2 BMI), with healthy dentition and no self-reported eating difficulties, allergies or intolerances to the test foods. Participants were not currently pregnant, lactating, smoking or trying to lose weight, and had no history of chronic medical illness or medication use that could affect appetite or metabolism. Body composition measures included height and weight which was measured using a stadiometer (SECA 763, Germany), participant body fat percentage which was measured using Bio-electric impedance body composition analysis (Tanita Corp., BC-418, Tokyo, Japan) and waist circumference which was measured using a standard measuring tape at the umbilical position and at mid-respiration. BMI was derived using weight (kg) divided by the height squared (m2). Each participant provided written informed consent prior to the study, and participants were compensated for their time. This study was approved by the A*STAR Institutional Review Board (IRB reference: 2021-004), Singapore.2.3 Test foods
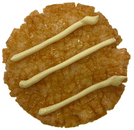
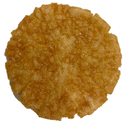
Two test foods were selected to represent contrasting texture properties. Carrots were chosen to validate and build on oral processing comparisons made in a previous study,30 and to represent hard and soft textures with high moisture content. Rice crackers were chosen as a second test food to represent a brittle texture with low moisture content with different mechanical and texture properties to carrot. Within each test food, the samples were matched to have a consistent weight of food served for each variable, and were prepared to vary in unit size (large, medium (only carrots), small), thickness (thick (only carrots), thin(only carrots)), hardness (hard, soft) and lubrication (with and without mayonnaise) in a balanced block design (Tables 1 and 2). This enabled a comparison of the relative influence of texture manipulation on oral processing behaviour for each texture variable alone, and in combination.Prepacked raw carrots (Pasar Brand; Singapore) were manually cut into different unit sizes and thickness. Raw cut carrots were used to represent hard texture samples. The soft carrot variants were prepared by steaming raw cut carrots for 20 minutes. Carrot samples were served at a similar weight of approximately 11 ± 0.8 g. Carrot samples with lubrication were served with approximately 1 ± 0.04 g of mayonnaise (Kewpie; Japan), so at a total sample weight of 12 ± 0.8 g. Three different brands of soy sauce flavoured rice crackers with matched thickness were chosen to represent texture variants in the study. Small hard rice crackers (Kameda Age Ichiban brand; Japan) and large hard rice crackers (Aji Karuta Honey Soy Sauce brand; Japan) were served at similar total weight of 20 ± 0.9 g while the soft (large and small) crackers (Kameda Pota Pota Yaki; Japan) were served at similar total weight of 7 ± 0.7 g. The difference in sample weight between the hard and soft cracker were unavoidable due to differences in sample density between samples. We chose to match samples for volume given the direct impact this has on oral processing behaviour, and this led to subtle differences in final sample weight. However, within each texture, the weights of the crackers were maintained as equivalent, and the overall volume differences between the cracker samples were negligible. Cracker samples with lubrication were served with 2 ± 0.04 g mayonnaise (Kewpie; Japan). Detailed information on each of the texture variables for both carrot and cracker samples are summarised in Tables 1 and 2 respectively.
2.4 Experimental procedure
All data was collected in the sensory booths at the Clinical Nutrition Research Centre, Yong Loo Lin School of Medicine in the National University of Singapore. During a first screening session of 60 min, participants were asked to consume 30 g of raw carrots (2 × 15 g rectangular carrot pieces) while being video recorded. Post hoc coding of these videos enabled an objective characterisation of participants’ habitual eating speed, based on a previously reported approach.16,18 At a group level, participants were median-split into faster and slower eaters based on their eating speed (g min−1).Participants were required to fast for at least 3 hours before each test session to standardise appetite state. Texture variants for each test food were presented on three distinct test days. All samples were presented in a sequential monadic order using a balanced randomised order of presentation within each test food. To check the reproducibility of each sample variant and participant eating behaviour, 6 of the carrot samples were randomly chosen to be served as duplicates for all participants. Post hoc coding of these selected samples and their duplicates were used to verify consistency in eating rate within individuals. Participants were instructed to cleanse their palate with filtered water provided between samples, and oral processing behaviours were video-recorded in individual sensory test booths, equipped with a webcam video recorder at face-level. Participants were instructed to consume each sample fully in their normal way. Video-recordings were post hoc annotated for behavioural analysis. On swallowing each test sample, participants were asked to rate the sensory intensity of the texture attribute ‘hardness’ (the force required to compress the sample during first bite). Data of fracturability, mouth-drying, chewiness and adhesiveness ratings were collected but are not reported. Sensory hardness intensity ratings were captured using 0 to 100 mm visual analogue scale (VAS), anchored by “not at all” (0) to “extremely” (100). All sensory measures were collected using computerised data acquisition software (Compusense Cloud, Guelph, Ontario, Canada), in sensory booths that conform to international standards for the design of test rooms. All carrot samples were cut into their appropriate unit sizes and thicknesses in line with the experimental design, and samples were prepared within 24-hours of each test session. For all carrot and cracker samples that required the addition of condiment (mayonnaise), mayonnaise was added to the samples immediately before serving and all samples were served at room temperature.
2.5 Behavioural coding of oral processing behaviours
The oral processing behaviours of participants for all carrot and cracker samples were quantified through behavioural coding analysis of the videos of participants during consumption, using a previously published standardised method.18,37 Participants were video recorded using a webcam (Logitech HDc310) positioned at face level to capture participants jaw movements during consumption. Participants were informed they were being video recorded, but were unable to view themselves during consumption and were unaware that recordings were used to measure oral processing behaviours. The key oral processing behaviours were manually analysed using the behavioural annotation software ELAN (version 4.9.1; Max Planck Institute for Psycholinguistics, The Language Archive, Nijmegen, The Netherlands). A pre-defined coding scheme was used to capture point events (number of bites, chews, swallows) and the duration of a continuous event (time of food in mouth). From these measures in combination with the total weight of each food sample consumed, oral processing parameters including average bite size (g), average number of chews per bite (no/bite) and eating rate (g min−1) were derived. All behavioural coding was completed by two trained researchers, with blind-validation coding of a minimum of 10% of the videos coded to ensure a standard reliability of ≥80% agreement between coders, in line with previously published approaches for data of this nature.7,18,38 Intra-class correlation coefficient showed excellent consistency between coders, ICC = 0.99–1.00, with the 95% confidence interval ranging from 0.98 to 1.0 prior to data analysis.2.6 Instrumental hardness of carrots and crackers
Instrumental hardness of carrot samples was quantified using a TA·XT plus Stable Micro Systems Texture Analyser (Stable Microsystems Ltd, Surrey, England) as a manipulation check to confirm the differences in hardness between hard (raw) and soft (steamed) carrots. A flat, circular compression plate (75 mm diameter, P/75) was used to compress raw and steamed carrot pieces (rectangular shape, 1.5 cm × 1 cm × 1 cm) at 22 ± 1 °C with a compression speed of 1 mm s−1 to a strain of 5% for raw and steamed carrots. Ten replicates were measured for raw and steamed carrots. As a measure of instrumental hardness for raw and steamed carrots, the force (N) needed to compress to 5% strain was recorded.The hardness of the hard and soft cracker samples was measured using a texture analyser equipped with a 3-point bending rig (HDP/3PB). The test conditions were set as pre-test speed: 1 mm s−1; post-test speed: 10 mm s−1; test speed: 3 mm s−1 and trigger force at 50 g in line with a previously published approach.39 Force at fracture (N) was recorded as the ‘hardness’ of each cracker. Measures were conducted with a minimum of ten replicates for hard and soft crackers differing in unit size (large/small).
2.7 Statistical analysis
Normality and intra-class correlation tests were completed to confirm the normality of data distribution and reliability of replicate measurements, and an average was taken for further analysis. For comparison of eating rate and oral processing behaviours between variants within carrot and cracker samples, estimated means were calculated for each measure using a linear mixed model with sample as fixed effect and subject as random effect. Differences in the oral processing behaviours of samples were tested using a general linear model and significant main effects were compared using post hoc Bonferroni test, with statistical significance set at 5% (α = 0.05). Data are presented as mean ± SEM, unless otherwise stated. Participants were divided into faster and slower eater groups using a median split based on their eating rate (median of eating rate (g min−1)) for 30 g of raw carrots, and in line with a previously published approach.36General linear models were used to analyse the independent and combined effects of unit size, thickness, hardness and lubrication on oral processing behaviours across all 24 carrot and 8 cracker test samples separately. Post hoc Bonferroni adjustments were used to compare means. The strength and direction of association between means of the eating rate and means of the other oral processing behavior parameters of carrot and cracker samples was assessed using Pearson's product-moment correlation analysis. All statistical analyses were completed using SPSS (IBM Version 26, Armonk, New York).
3. Results
Participant characteristics (N = 70) are summarised in Table 3. Participants grouped as “slower” (mean eating rate = 7.9 ± 1.7 g min−1; n = 35) eaters had a significantly lower eating rate than “faster” eaters (mean eating rate = 14.4 ± 3.3 g min−1; n = 35). “Slower” and “faster” eaters did not differ significantly across baseline measures, with the exception of a significant and small difference in body mass index (BMI) with faster eaters having a slightly lower BMI (21.0 kg m−2) than slower eaters (22.0 kg m−2).| Total participants (N = 70, males = 34) | Slower eaters (n = 35, males = 15) | Faster eaters (n = 35, males = 19) | p* | |
|---|---|---|---|---|
| Values are presented as mean (±SD). *p < 0.05 indicate significant difference in baseline measure between ‘slower’ and ‘faster’ eaters (independent t-test, p < 0.05 (2-tailed)).a Eating rate is based on consumption of 30 g of raw carrots. | ||||
| Age (years) | 26.0 (5.4) | 25.2 (6.1) | 26.8 (4.6) | 0.228 |
| Body mass index (kg m−2) | 21.5 (1.7) | 22.0 (1.5) | 21.0 (1.8) | 0.023 |
| Body fat (%) | 22.0 (7.0) | 23.6 (7.5) | 20.4 (6.1) | 0.053 |
| Waist-hip circumference ratio | 0.8 (0.1) | 0.8 (0.1) | 0.8 (0.1) | 0.479 |
| Eating rate (g min−1)a | 11.2 (4.2) | 7.9 (1.7) | 14.4 (3.3) | <0.001 |
3.1 Consistency of eating rate and oral processing within individuals
The intra-class correlation coefficients (ICCs) for seven parameters describing eating behaviours of six carrot samples are reported in Table 4. The average ICC for each oral processing parameter indicate a good consistency for number of chews, chews per bite, chews per gram, oral exposure time (s) and eating rate (g min−1) and a moderate consistency for number of bites and bite size (g). The total average ICC (0.787) indicates good consistency in overall oral processing behaviour across all six carrot samples within participants. The carrot samples summarised in Table 4 and its duplicate were consumed at a similar speed by all participants, indicating that participants were consistent in their eating behaviour for the same samples.| Samples | Bite (no.) | Bite size (g) | Chews (no.) | Chews per bite | Chews per gram | Oral exposure time (ss) | Eating rate (g min−1) | Total average ICCa |
|---|---|---|---|---|---|---|---|---|
| An ICC value of <0.5 indicates poor consistency, 0.50–0.75 indicates moderate consistency, 0.75–0.9 indicates good consistency, and >0.90 indicates excellent consistencya Total average ICC is the average of all ICC values taken across all 6 samples and all 7 eating behaviours | ||||||||
| Small, thick, hard, lub | 0.515 (0.320, 0.668) | 0.464 (0.259, 0.629) | 0.875 (0.806, 0.921) | 0.753 (0.630, 0.839) | 0.868 (0.796, 0.916) | 0.886 (0.823, 0.928) | 0.894 (0.835, 0.933) | 0.787 (0.685, 0.861) |
| Medium, thin, hard, no lub | 0.879 (0.812, 0.923) | 0.675 (0.524, 0.785) | 0.927 (0.886, 0.954) | 0.798 (0.694, 0.870) | 0.940 (0.905, 0.962) | 0.930 (0.890, 0.956) | 0.922 (0.877, 0.951) | |
| Large, thick, soft, lub | 0.805 (0.704, 0.874) | 0.624 (0.457, 0.749) | 0.890 (0.829, 0.930) | 0.790 (0.683, 0.864) | 0.895 (0.837, 0.934) | 0.910 (0.858, 0.943) | 0.829 (0.739, 0.890) | |
| Small, thick, hard, no lub | 0.605 (0.432, 0.735) | 0.573 (0.392, 0.711) | 0.849 (0.768, 0.903) | 0.811 (0.712, 0.878) | 0.840 (0.754, 0.897) | 0.855 (0.776, 0.907) | 0.844 (0.760, 0.900) | |
| Medium, thin, soft, no lub | 0.728 (0.596, 0.822) | 0.577 (0.396, 0.714) | 0.853 (0.774, 0.906) | 0.736 (0.607, 0.827) | 0.861 (0.786, 0.911) | 0.829 (0.739, 0.890) | 0.820 (0.726, 0.885) | |
| Large, thick, hard, lub | 0.609 (0.438, 0.738) | 0.525 (0.332, 0.676) | 0.825 (0.733, 0.888) | 0.781 (0.669, 0.858) | 0.841 (0.757, 0.898) | 0.808 (0.708, 0.876) | 0.850 (0.769, 0.904) | |
| Average ICC for each eating behaviour | 0.690 (0.550, 0.793) | 0.573 (0.393, 0.711) | 0.870 (0.799, 0.917) | 0.778 (0.666, 0.856) | 0.874 (0.806, 0.920) | 0.870 (0.799, 0.917) | 0.860 (0.784, 0.911) | |
3.2 Sensory and instrumental hardness of carrots and crackers
The sensory and instrumental hardness measures for carrots and crackers are summarised in Table 5. Findings confirmed significant differences in perceived hardness between the hard and soft carrot samples (all, p < 0.001). All participants rated the hard carrot samples as significantly higher in perceived hardness than the soft carrot samples, which was also confirmed by instrumental measurements. No significant differences in perceived hardness within soft carrots were observed. Within hard carrots, perceived hardness of the hard, large, thick, no lubrication carrots was significantly higher than for the hard, large, thin, lubrication (p = 0.001); hard, medium, thin, lubrication (p = 0.004); hard, small, thin, lubrication (p = 0.001) and hard, small, thin, no lubrication carrots (p = 0.029). All other hard carrots showed no significant differences in perceived hardness within the harder carrot samples. Hard crackers were rated significantly higher in perceived hardness than soft crackers (all, p < 0.001). Instrumental hardness was significantly (p < 0.05) higher for hard crackers than for soft crackers independent of cracker size. No significant differences in hardness within hard and within soft crackers were observed which was in agreement with instrumental hardness measures of crackers. These results confirm that any observed differences in oral processing behaviours between the ‘hard’ and ‘soft’ samples within carrots or crackers can be attributed to the confirmed differences in hardness between ‘hard’ and ‘soft’ samples.| Sensory hardness | Instrumental hardness (N) | ||||||
|---|---|---|---|---|---|---|---|
| Carrotb | Crackerb | Carrota | Crackerb | ||||
| Data are presented as mean (SEM). Values labelled with different letters for each attribute are different at p < 0.05.a Independent T-test, p < 0.05 (2-tailed).b ANOVA test, p < 0.05. Sensory hardness is defined as the force required to compress the sample during first bite. Instrumental hardness (N) of carrots represents force needed to compress to 5% strain. Instrumental hardness (N) of crackers represents force at fracture. lub: lubrication; no lub: no lubrication | |||||||
| Hard, large, thick, lub | 71ab (2) | Hard, large, lub | 71a (2) | Hard | 2433a (95) | Hard, large | 3719a (70) |
| Hard, large, thick, no lub | 75b (3) | Hard, large, no lub | 73a (2) | Soft | 611b (12) | Hard, small | 3597a (81) |
| Hard, large, thin, lub | 61a (3) | Hard, small, lub | 73a (2) | Soft, large | 2540b (66) | ||
| Hard, large, thin, no lub | 64ab (3) | Hard, small, no lub | 74a (2) | Soft, small | 2595b (35) | ||
| Hard, medium, thick, lub | 69ab (2) | Soft, large, lub | 36b (3) | ||||
| Hard, medium, thick, no lub | 72ab (2) | Soft, large, no lub | 36b (2) | ||||
| Hard, medium, thin, lub | 62a (3) | Soft, small, lub | 36b (2) | ||||
| Hard, medium, thin, no lub | 65ab (2) | Soft, small, no lub | 35b (2) | ||||
| Hard, small, thick, lub | 67ab (2) | ||||||
| Hard, small, thick, no lub | 71ab (2) | ||||||
| Hard, small, thin, lub | 61a (3) | ||||||
| Hard, small, thin, no lub | 64a (3) | ||||||
| Soft, large, thick, lub | 16c (2) | ||||||
| Soft, large, thick, no lub | 20c (2) | ||||||
| Soft, large, thin, lub | 16c (2) | ||||||
| Soft, large, thin, no lub | 17c (2) | ||||||
| Soft, medium, thick, lub | 17c (2) | ||||||
| Soft, medium, thick, no lub | 19c (2) | ||||||
| Soft, medium, thin, lub | 16c (2) | ||||||
| Soft, medium, thin, no lub | 17c (2) | ||||||
| Soft, small, thick, lub | 19c (2) | ||||||
| Soft, small, thick, no lub | 22c (2) | ||||||
| Soft, small, thin, lub | 14c (2) | ||||||
| Soft, small, thin, no lub | 15c (2) | ||||||
3.3 Effect of independent and combined texture manipulations on oral processing behaviours
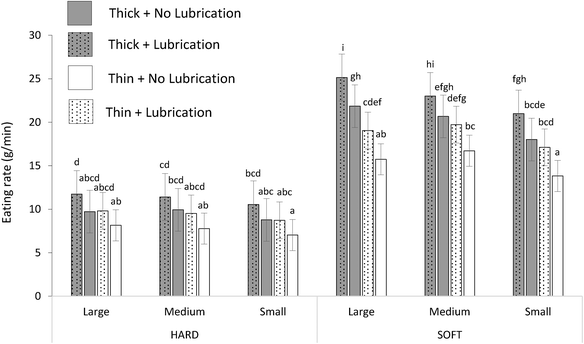
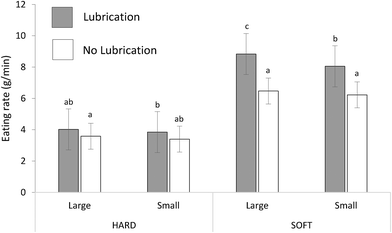
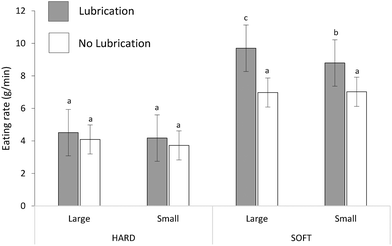
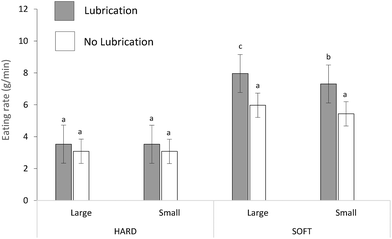
All eating microstructure properties including average bite size (g), chews per bite, chews per gram, and oral exposure time (s) are summarised in ESI (Tables S1 and S2†). These eating microstructure properties combine to produce significant differences in eating rate, and are strongly correlated with overall eating rate (g min−1) as shown in the ESI Tables S3 and S4.† The relationship between oral processing parameters such as bite size (g), chews per bite and oral exposure time (s) and eating rate have previously been described previously.8,9,16,18,34,40 For ease of interpretation, differences in overall eating rate are presented as the main outcome for each of the carrot and cracker texture variants in Fig. 1 and 2. Table 6 summarises the independent and combined effects of unit size, thickness, hardness and lubrication on eating rate (g min−1) for each carrot and cracker variant. These differences in eating rate can be explained by observed differences in the underlying oral processing parameters for each sample, and further detail is available in the supplementary materials (Tables S1 and S2†).| Eating rate (g min−1) | ||||||
|---|---|---|---|---|---|---|
| Overall (N = 70) | Faster eaters (n = 35) | Slower eaters (n = 35) | ||||
| F | p | F | p | F | p | |
| F-Values and p-values are derived from general linear model. p-Values <0.05 are significant. df refers to the degree of freedom. | ||||||
| I. CARROTS | ||||||
| (A) Independent effect | ||||||
| Unit size (df = 2) | 137.367 | <0.001 | 70.956 | <0.001 | 63.413 | <0.001 |
| Thickness (df = 1) | 156.705 | <0.001 | 72.566 | <0.001 | 93.069 | <0.001 |
| Hardness (df = 1) | 99.783 | <0.001 | 52.283 | <0.001 | 55.822 | <0.001 |
| Lubrication (df = 1) | 113.337 | <0.001 | 48.254 | <0.001 | 65.463 | <0.001 |
| (B) Combined effect | ||||||
| i. 2-Way interaction | ||||||
| Unit size × thickness | 125.815 | <0.001 | 63.657 | <0.001 | 71.314 | <0.001 |
| Unit size × hardness | 21.744 | <0.001 | 8.872 | 0.001 | 13.440 | <0.001 |
| Unit size × lubrication | 4.205 | 0.019 | 2.273 | 0.119 | 1.882 | 0.168 |
| Thickness × hardness | 12.911 | 0.001 | 7.733 | 0.009 | 5.080 | 0.031 |
| Thickness × lubrication | 5.810 | 0.019 | 0.253 | 0.618 | 11.215 | 0.002 |
| Hardness × lubrication | 0.367 | 0.547 | 2.565 | 0.119 | 1.126 | 0.296 |
| ii. 3-Way interaction | ||||||
| Unit size × thickness × hardness | 17.059 | <0.001 | 5.564 | 0.008 | 14.794 | <0.001 |
| Unit size × thickness × lubrication | 6.755 | 0.002 | 4.316 | 0.022 | 2.388 | 0.107 |
| Unit size × hardness × lubrication | 0.373 | 0.690 | 0.301 | 0.742 | 0.106 | 0.900 |
| Thickness × hardness × lubrication | 0.106 | 0.746 | 0.005 | 0.941 | 0.187 | 0.668 |
| iii. 4-Way interaction | ||||||
| Unit size × thickness × hardness × lubrication | 0.513 | 0.601 | 0.550 | 0.582 | 0.157 | 0.855 |
| II. CRACKER | ||||||
| (A) Independent effect | ||||||
| Unit size (df = 1) | 722.014 | <0.001 | 377.402 | <0.001 | 405.560 | <0.001 |
| Hardness (df = 1) | 29.876 | <0.001 | 17.986 | <0.001 | 11.856 | 0.002 |
| Lubrication (df = 1) | 317.652 | <0.001 | 153.162 | <0.001 | 169.093 | <0.001 |
| (B) Combined effect | ||||||
| i. 2-Way interaction | ||||||
| Unit size × hardness | 2.670 | 0.107 | 0.049 | 0.826 | 11.203 | 0.002 |
| Unit size × lubrication | 189.723 | <0.001 | 97.593 | <0.001 | 96.245 | <0.001 |
| Hardness × lubrication | 5.411 | 0.023 | 8.529 | 0.006 | 0.147 | 0.703 |
| ii. 3-Way interaction | ||||||
| Unit size × hardness × lubrication | 6.258 | 0.015 | 8.355 | 0.007 | 0.204 | 0.654 |
When texture manipulations were combined for carrots, they had a cumulative impact on carrot eating rate as confirmed by two and three-way interactions (Table 6). The small, hard and thin carrots with no lubrication were consumed slowest (7.0 ± 0.3 g min−1), whereas large, soft and thick carrots with lubrication were consumed fastest (25.1 ± 1.3 g min−1) (Fig. 1). Texture manipulations in combination had a larger effect on participant eating rate than any single texture variable in isolation, as seen in Fig. 1. Increasing the unit size and thickness in combination with either softer texture (unit size × thickness × hardness: p < 0.001) or addition of lubrication (unit size × thickness × lubrication: p = 0.002) significantly increased the eating rate of carrots (Table 6). For example, there was a 3-fold increase in eating rate in response to the combined effect of unit size, thickness and hardness. When texture of carrots without lubrication was changed from small, hard and thin (7.0 ± 0.3 g min−1) to large, soft and thick (21.9 ± 1.2 g min−1) the eating rate increased by a factor of 3. In comparison, only a much smaller 1.2 fold increase in eating rate was observed when a single variable, unit size, was changed (hard, small, thin, non-lubricated: 7.0 ± 0.3 g min−1vs. hard, large, thin, non-lubricated: 8.2 ± 0.4 g min−1).
When texture manipulations were combined for crackers, small, hard crackers without lubrication were consumed the slowest (3.4 ± 0.1 g min−1), whereas large, soft, lubricated crackers were consumed the fastest (8.8 ± 0.3 g min−1) (Fig. 2). As with carrots, combined texture manipulations proved to have the largest effect on eating rate. For example, there was a 2.6-fold increase in eating rate when unit size, hardness and lubrication were manipulated in combination, with a significant three-way interaction between unit size × hardness × lubrication (p = 0.015, Table 6).
Taking the findings of both test foods together, it can be seen that all texture variables tested have varying magnitudes of influence on eating rate. For carrots, hardness had the largest influence on eating rate followed by thickness, lubrication and unit size. For crackers, hardness had as well the largest influence on eating rate followed by lubrication and unit size. Texture combinations proved to have the largest impact in moderating eating rate for both test foods.
3.4 Impact of texture manipulation on oral processing behaviours of faster and slower eaters
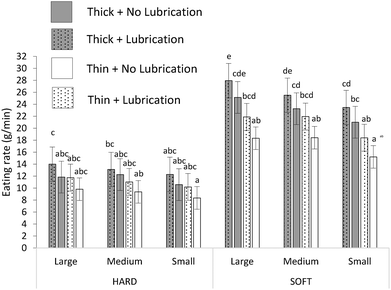
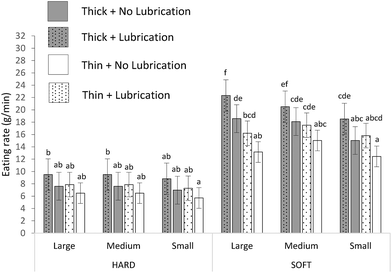
The independent and combined effects of unit size, thickness, hardness and lubrication on oral processing behaviours for carrots and crackers for “faster” and “slower” eaters are provided in ESI Tables S6 and S7.† The differences in the eating rate (g min−1) between faster and slower eaters are shown for all carrots (Fig. 3 and 4) and crackers (Fig. 5 and 6). Faster eaters consumed all carrot samples at a faster eating rate than slower eaters, however there were no significant differences in the independent and combined effects of the texture variables on eating rate between the two groups (Table 6). For both faster and slower eaters, unit size, thickness, hardness and lubrication had significant independent effect (p < 0.001) on eating rate with similar ranking of effect sizes, corresponding to what was observed when comparing across all eaters (see section 3.3.1 and 3.3.2). The combined effect of manipulating all four variables on eating rate remained insignificant (faster eaters: p = 0.58; slower eaters: p = 0.86) while the combined effect of unit size × thickness × hardness manipulations on eating rate remained significant in both groups (faster eaters: p = 0.008; slower eaters: p < 0.001). Results show that the impact of textural manipulations on eating rate are independent of the eating speed of consumers.Fig. 5 and 6 summarise the eating rate (g min−1) of crackers for faster and slower eaters, respectively. As with carrots, all cracker samples were consumed at a faster rate by faster eaters than slower eaters. All texture variables had significant independent effect (p < 0.05) on eating rate with similar hierarchies in variables for both faster and slower eaters (Table 6). Although unit size × hardness × lubrication had a significant combined effect (p = 0.007) on eating rate for faster eaters, this same interaction was not significant for slower eaters (p = 0.654; Table 6). Despite this difference, there were no other differences regarding the impact of food texture on changes in eating rate between faster and slower eaters.
4. Discussion
We sought to explore the relative influence of unit size, thickness, hardness and lubrication and their combined effects on oral processing behaviour in carrots and crackers and whether the impact of these texture parameters on oral processing differs across faster and slower eaters. Findings show that texture manipulations have a robust and consistent effect on oral processing with varying degrees of influence between different texture manipulations. Food hardness had the largest impact on eating rate and oral processing for both test foods, followed by thickness, lubrication and unit size for carrots and followed by lubrication and unit size for crackers, respectively, having increasingly less impact on eating rate independently. For both test foods, the effect of texture manipulations on eating rate were stronger when texture manipulations were combined, compared to the effect of independent texture modifications. We show that texture manipulations had an equivalent impact on eating rate across groups that differ in their habitual eating rate.Understanding how texture influences eating rate can have a direct impact on food intake and metabolism, and could potentially be applied to moderate energy intake within target groups or specific product categories. The impact of varying texture parameters such as hardness or viscosity on eating rate or intake has been well established. In line with previous findings, we confirm that hardness had the largest influence on oral processing for both carrots and crackers. Serving softer, thicker foods in larger units with added lubrication increased eating rate of foods independently, in line with several previous studies.7–9,22–24,27,28,30,41 Beyond the impact of food hardness, our findings demonstrate a hierarchy of effects when specific texture variables are manipulated and combined. Hardness is followed by thickness and lubrication, with unit size having the smallest effect on carrot eating rate. For crackers, hardness is followed by lubrication and unit size. Previous research has shown that changing food hardness from soft to hard produced a 29–58% reduction in eating rate for hamburgers and salads, respectively.7 Similarly, a decrease in eating rate of 29–33% was observed when bread (soft) was changed to cracker (hard) for a composite food.24 However, a smaller effect size was seen when the geometrical parameters of the food were modified. Eating rate of a biscuit snack was reduced by 16% when consumed as nibbles (smaller unit size) compared to bars (larger unit size).31 Similarly, consumption of carrots in julienne form (thin) compared to cubes (thick) decreased eating rate by 17%.30 It is noteworthy that lubrication had relatively small effects on carrot eating rate, whereas previous studies demonstrated large effect sizes. For example, eating rate was 65% lower for bread alone than bread with mayonnaise (lubrication) and 45% lower for potato alone than potato with mayonnaise.23 Similarly, the eating rate for crackers increased 61% when crackers were consumed with mayonnaise and for bread, eating rate increased 58% when consumed with mayonnaise.24 Previous studies used a carrier/mayonnaise weight ratio of 1![[thin space (1/6-em)]](https://www.rsc.org/images/entities/char_2009.gif) :
:![[thin space (1/6-em)]](https://www.rsc.org/images/entities/char_2009.gif) 1 (g/g), whereas the current study had an 11
1 (g/g), whereas the current study had an 11![[thin space (1/6-em)]](https://www.rsc.org/images/entities/char_2009.gif) :
:![[thin space (1/6-em)]](https://www.rsc.org/images/entities/char_2009.gif) 1 weight ratio. While both ratios were realistic for the foods studied, the food/lubricant ratio in our study was considerably smaller than in previous studies.24,30 We conclude that in addition to the tribological properties of the lubricant, the amount of lubricant has a considerable impact on the oral breakdown path of the bolus to swallow.
1 weight ratio. While both ratios were realistic for the foods studied, the food/lubricant ratio in our study was considerably smaller than in previous studies.24,30 We conclude that in addition to the tribological properties of the lubricant, the amount of lubricant has a considerable impact on the oral breakdown path of the bolus to swallow.
The rank order of the effect on eating rate and oral processing behaviour for each texture manipulation depended on the magnitude of each individual texture modification. For example, in the current study instrumental hardness differed four-fold and sensory hardness 2–3 fold between harder and softer carrots. Differences in thickness between thick and thin carrots differed two-fold, whereas unit size manipulation differed by a factor of three, and lubrication was classified as with and without mayonnaise. We acknowledge that a limitation of the current study was that the magnitude of differences of texture manipulations were not equivalent across all manipulations. We chose ecological validity and matched weight served over directly comparable manipulations. For a true comparison of the relative impact of each individual texture manipulation on eating rate, future studies could vary texture attributes by an equivalent perceptual margin such as just noticeable differences (JND's). This approach would ensure that the magnitude of differences between texture manipulations is scaled with the magnitude of perceivable texture differences, and would enable a more balanced comparision of the impact of independent texture manipulations on eating behaviour.
Lubrication may have a larger effect on oral processing behaviour in low moisture foods (crackers) compared to high moisture foods (carrots). In our study the relative effect of adding a lubricant to the test foods on eating rate was comparable for carrots and crackers. Previous research showed that crackers (i.e. dry, low moisture) rapidly absorb moisture from condiments such as mayonnaise during mastication, which assists softening and moistening of bolus particles and contributes to agglomeration, faster eating rates and shorter oro-sensory exposure time.22,24 This is in line with previous findings which showed that the effect of adding butter (lubrication) reduced the number of chews more for toast than for bread.22 In this way, the reported hierarchy of texture influence on oral processing can also be slightly modified by properties of the food. Other food categories were not tested in this study but future research should explore whether the influence of texture is consistent across other food types. Hardness remains the most effective independent texture parameter to manipulate when using texture-based interventions to guide oral processing and energy intake behaviours, though it is often not possible to increase food hardness without significantly reducing a food's hedonic appeal. As such, it is useful to consider individual or combined texture parameters that can significantly influence a food's eating speed, without reducing a food's sensory appeal.
Findings from the current study clearly demonstrate the effect of combining texture variables on oral processing behaviour, with the largest effect observed when pairwise or three-way texture combinations act synergistically to reduce eating speed. A unit size × thickness interaction was shown to significantly reduce the eating rate for carrots. Previous findings showed consumers adjust their bite size in response to food dimensions such as length and thickness,31,41 where changing unit size and thickness together synergistically impacted oral processing by influencing bite size. Previous work by Kohyama and colleagues showed that combined changes in carrot length and thickness significantly reduced eating rate and oro-sensory exposure time.27 Our findings showed combinations of unit size, thickness with either lubrication or hardness significantly moderated eating rate for carrots. Recent findings by van Eck and colleagues showed that manipulating unit size, thickness and lubrication resulted in a larger decrease in eating rate (↓57%) compared to when only lubrication was manipulated (↓35%).30 The current study suggests limitations to the combined effect of texture manipulations, as we did not show significant interaction effects for all texture combinations. All combinations that consist of both lubrication and hardness including three-way texture combinations (unit size × hardness × lubrication; thickness × hardness × lubrication) and four-way texture combinations (unit size × thickness × hardness × lubrication) did not significantly reduce eating rate for carrots. These interactions can best be explained by the concept of a ‘breakdown path’ proposed by Hutchings and Lillford,42 where changing a food's hardness facilitates a sufficient reduction in food structure to reach the threshold for safe swallow. As such, the addition of lubrication may not have had a strong additional effect on the breakdown path to swallow. Taken together, our findings suggest that combinations of texture variables including unit size, thickness and hardness or lubrication will have the strongest impact in moderating eating rate of foods with similar mechanical properties.
Significant combined effects were also observed for crackers, where hardness and lubrication moderated eating rate. This is in agreement with previous findings which showed a larger reduction in eating rate (↓72%) when both hardness and lubrication were modified compared to only hardness (↓34%).24 This suggests that changing hardness in combination with lubrication may be a more effective strategy to increase eating rate for lower moisture foods with similar mechanical properties to crackers. We showed a significant combined effect of unit size and lubrication on eating rate in line with previous findings, where there was a 15% increase in eating rate for flat square crackers (larger surface area) compared to finger-shape crackers (smaller surface area) when both were consumed with cheese dips (lubrication).29 The combined manipulation of unit size, lubrication and hardness had a synergistic effect on eating rate for crackers and will likely have similar effects for foods with similar mechanical and compositional properties.
The current study took a systematic approach to compare a wide number of texture parameters and explore whether they have a synergistic effect on eating rate. It may be possible to consider combinations of texture manipulations to enhance the intake of specific food categories or to apply these changes to moderate energy intake for specific populations or from specific foods. Using texture combinations (unit size, thickness and lubrication) may prove a more realistic strategy to renovate food properties and guide eating behaviour without losing consumer appeal compared to independent modifications of single texture properties. For example, as a public health guideline, encouraging consumers to eat vegetables in whole, large pieces with condiments rather than small pieces, will likely lead to an increased eating rate and promote intake. Beyond ingredient reformulation, it may be possible to also consider applying food texture modifications to develop larger, thicker and more lubricated (e.g. spread, cream) food products that can increase eating rate and intake of nutrient dense foods. Similarly, reducing unit size, thickness and removing lubrication could be applied to slow the intake of snacks and by extending the oro-sensory exposure time, enhance satisfaction per kcal consumed.
We also compared whether faster and slower eaters respond similarly to food textural manipulations and showed that there were no significant differences in the independent and combined effects of the textural manipulations on oral processing between these two groups. A recent study showed that manipulating food hardness and stiffness (‘soft’ white rice vs. ‘hard’ rice cake) significantly slowed eating rate for slower eaters, but not for faster eaters.36 However, differences in hardness and stiffness in that study may have been obscured by a strong effect of unit size, as the geometrical properties of the test food dominated and contributed to an increased eating rate among faster eaters. In controlling the presentation of these variables in a systematic comparison, the current study concludes that both faster and slower eaters are likely to adjust their eating rates in an equivalent manner to the food texture challenges they encounter, all the while retaining the relative difference in their eating speed. Faster eaters tended to consume all foods at a slightly faster rate, but adapted their eating rate to the same extent as slower eaters in response to texture changes. Within the cracker samples, there was a difference between faster and slower eaters, where the combined effect of unit size × hardness × lubrication had a significant impact on faster eaters (p = 0.007) but not on slower eaters (p = 0.654). This may be due to differences in preferred oral processing style or swallow threshold, and the impact this had on the breakdown pathway and agglomeration of cracker samples during oral processing,42 as crackers do not always fit with the food breakdown pathway model.43 Despite large differences in their natural eating style, both faster and slower eaters unconsciously adapted their eating rate to the textural challenges received for carrots and crackers. These findings suggest that texture-based oral processing strategies could be applied across all consumers and that natural variations in eating rate do not significantly impact the effect of texture on oral processing. For example, older consumers with compromised oral processing capacity or saliva flow may benefit from additional lubrication and textures that require less moisture in mouth and fracture and agglomerate easily to reduce the need for longer chewing times.35 Similarly, young children that tend to consume energy dense foods at a faster rate and are at risk of sustained high energy intakes,34,40 may benefit from more challenging texture combinations that require further oral processing to form a bolus that is safe to swallow. Differences in eating rate may impact metabolic response to ingested nutrients36 and have been shown to be highly consistent and predictive of energy intake at an individual level,37 across age, gender and culture.35,44 It is likely that texture based strategies to direct eating behaviours to target energy intake or metabolism can be generalised to different consumer groups in terms of age, gender and ethnicity.35
Future research is needed to test whether texture manipulations will have the same impact on oral processing behaviour for other food types with different texture properties such as toughness (e.g. fibrous foods such as meat), chewiness (e.g. rice cake, gummy bear) or brittleness (e.g. potato chips). Further research is needed with a wide range of food textures to confirm the observed effects on eating rate in the current study. In addition, based on literature6–9 we speculate that the texture led changes in eating rate can influence energy intake based on previous findings, though energy intake was not directly measured in the current study. Previous research has suggested that a minimum 20% reduction in eating rate is required to stimulate a 10–15% decrease in ad libitum energy intake.45 Future studies are needed to determine whether the texture combinations tested in the current study are likely to have a sustained impact on eating rate and ad libitum energy intake. Furthermore, it remains unknown whether texture manipulations within a single food can influence the oral processing behaviour for more complex composite foods (sandwiches, burgers) and whole meals.
Recent research on composite foods has shown that structural changes can influence mastication and oral processing behaviours.24 Hence, it would be meaningful to extend these findings from model composite foods to investigate the influence of textural manipulations on eating rate and intake for more complex meals consisting of multiple interacting texture components. This would reflect a more realistic dietary behaviour comprising of whole meals or composite foods rather than single foods. Previous work by Bolhuis et al. (2014)7 has demonstrated that manipulating hardness of burgers (soft/hard bun) and salads (soft/hard rice and vegetables) led to an increase in chews per bite and oral exposure time per gram of food consumed, and supported a 13% reduction in energy intake for the harder version of a lunchtime meal. Recent findings have demonstrated the role of food texture based differences in eating rate in moderating energy intake from ultra-processed and minimally processed foods, where meal texture was shown to reduce food intake (g) by 21% and meal energy intake (kcals) by 26%.46 These findings highlight the importance of food texture in supporting reformulation efforts47 and future research will extend these texture interventions beyond acute single meal trials to explore the impact of meal texture on dietary intake behaviour (i.e.https://restructureproject.org/).
It is acknowledged that differences in food texture in the current trial were not evenly matched between the different composite stimuli, and that this has influenced the magnitude of the effects when comparing differences of each textures’ relative influence on participants’ oral processing behaviours. Future studies seeking to compare how texture manipulations influence oral processing should consider varying textures by an equivalent magnitude using standardised perceptual criteria such as JND for a more equitable comparison. Future research is needed to build on this study to determine whether these texture based acute differences in eating rate and energy intake can support a longer-term reduction in eating speed and energy intake that can be sustained over time.
Whereas the current study focused primarily on the impact of composite food texture on oral processing behaviours, it is important to highlight that changes in oral processing also influence both the bolus properties at swallow and the metabolic contribution of the oral phase of digestion. Recent findings demonstrate that food texture modifications for an equivalent carbohydrate load stimulate differences in oral processing, which result in differences in bolus surface area and saliva uptake which were associated with changes in temporal glucose release.48 Differences observed between faster and slower eaters can also be reflected in bolus properties at swallow, and the resultant glucose and insulin responses, suggesting that texture modifications will interact with eating style in how they influence metabolic responses.36,49 Further research is needed extend the findings of the current study to differences in food bolus properties across different textures to better understand the impact on metabolic responses.
5. Conclusions
The current study demonstrates that texture manipulations act in synergy to influence oral processing behaviour with combinations of texture modifications such as unit size, thickness, hardness and lubrication having the most robust impact on eating rate. Findings highlight that hardness had the strongest effect on oral processing behaviour among all modifications of individual texture properties. We demonstrate that food texture manipulations affect oral processing for both faster and slower eaters similarly suggesting that the impact of texture manipulations on eating rate are independent of the eating speed of consumers. This indicates that texture-based food modifications to regulate energy intake can be applicable for all consumers independent of their individual eating speed. These findings can inform the development of new and effective texture-based strategies in product reformulation or public health guidelines to modulate habitual energy intake for various consumer groups. Further research is needed to evaluate the impact of texture combinations on intake for more commonly consumed complex foods such as composite foods or whole meals.Ethics
The study was approved by the National Healthcare Group Domain Specific Review Board (NHG DSRB, reference number: 2018/01091), Singapore.Author contributions
CGF and JR: study design. JR, VWKT, ATG, MJYC and AJYL: data collection. JR, VWKT, PST, MS, and CGF: data analysis and interpretation. JR, and CGF: writing. JR, VWKT, ATG, MJYC, AJYL, PST, MS and CGF: review and edit. CGF: overall responsibility for the final manuscript.Conflicts of interest
All authors declare no conflict of interest.Acknowledgements
Supported by the Singapore Biomedical Research Council (grant no. H18/01/a0/E11) Food Structure Engineering for Nutrition and Health (Awarded to PI: C. G. Forde).Notes and references
- K. D. Hall, Did the food environment cause the obesity epidemic?, Obesity, 2018, 26, 11–13 CrossRef PubMed.
- A. Hruby, J. E. Manson, L. Qi, V. S. Malik, E. B. Rimm, Q. Sun, W. C. Willett and F. B. Hu, Determinants and Consequences of Obesity, Am. J. Public Health, 2016, 106, 1656–1662 CrossRef PubMed.
- P. S. Teo, R. M. van Dam and C. G. Forde, Combined Impact of a Faster Self-Reported Eating Rate and Higher Dietary Energy Intake Rate on Energy Intake and Adiposity, Nutrients, 2020, 12, 3264 CrossRef PubMed.
- P. S. Teo, R. M. van Dam, C. Whitton, L. W. L. Tan and C. G. Forde, Consumption of Foods With Higher Energy Intake Rates is Associated With Greater Energy Intake, Adiposity, and Cardiovascular Risk Factors in Adults, J. Nutr., 2021, 151, 370–378 CrossRef PubMed.
- P. S. Teo and C. G. Forde, The Impact of eating rate on energy intake, body composition, and health, in Handbook of eating and drinking: interdisciplinary perspectives, 2020, pp. 715–740 Search PubMed.
- A. M. Andrade, G. W. Greene and K. J. Melanson, Eating slowly led to decreases in energy intake within meals in healthy women, J. Am. Diet. Assoc., 2008, 108, 1186–1191 CrossRef PubMed.
- D. P. Bolhuis, C. G. Forde, Y. Cheng, H. Xu, N. Martin and C. de Graaf, Slow food: sustained impact of harder foods on the reduction in energy intake over the course of the day, PLoS One, 2014, 9, e93370 CrossRef PubMed.
- C. Forde, N. Van Kuijk, T. Thaler, C. De Graaf and N. Martin, Texture and savoury taste influences on food intake in a realistic hot lunch time meal, Appetite, 2013, 60, 180–186 CrossRef CAS PubMed.
- K. McCrickerd, C. M. Lim, C. Leong, E. M. Chia and C. G. Forde, Texture-based differences in eating rate reduce the impact of increased energy density and large portions on meal size in adults, J. Nutr., 2017, 147, 1208–1217 CrossRef CAS PubMed.
- J. L. Scisco, E. R. Muth, Y. Dong and A. W. Hoover, Slowing bite-rate reduces energy intake: an application of the bite counter device, J. Am. Diet. Assoc., 2011, 111, 1231–1235 CrossRef PubMed.
- M. Viskaal-van Dongen, F. J. Kok and C. de Graaf, Eating rate of commonly consumed foods promotes food and energy intake, Appetite, 2011, 56, 25–31 CrossRef PubMed.
- N. Zijlstra, R. de Wijk, M. Mars, A. Stafleu and C. de Graaf, Effect of bite size and oral processing time of a semisolid food on satiation, Am. J. Clin. Nutr., 2009, 90, 269–275 CrossRef CAS PubMed.
- C. K. Martin, S. D. Anton, H. Walden, C. Arnett, F. L. Greenway and D. A. Williamson, Slower eating rate reduces the food intake of men, but not women: implications for behavioral weight control, Behav. Res. Ther., 2007, 45, 2349–2359 CrossRef PubMed.
- M. G. Aguayo-Mendoza, E. C. Ketel, E. van der Linden, C. G. Forde, B. Piqueras-Fiszman and M. Stieger, Oral processing behavior of drinkable, spoonable and chewable foods is primarily determined by rheological and mechanical food properties, Food Qual. Prefer., 2019, 71, 87–95 CrossRef.
- A. C. Mosca, A. P. Torres, E. Slob, K. de Graaf, J. A. McEwan and M. Stieger, Small food texture modifications can be used to change oral processing behaviour and to control ad libitum food intake, Appetite, 2019, 142, 104375 CrossRef PubMed.
- C. Forde, N. Van Kuijk, T. Thaler, C. De Graaf and N. Martin, Oral processing characteristics of solid savoury meal components, and relationship with food composition, sensory attributes and expected satiation, Appetite, 2013, 60, 208–219 CrossRef CAS PubMed.
- M. Lasschuijt, M. Mars, M. Stieger, S. Miquel-Kergoat, C. De Graaf and P. Smeets, Comparison of oro-sensory exposure duration and intensity manipulations on satiation, Physiol. Behav., 2017, 176, 76–83 CrossRef CAS PubMed.
- C. Forde, C. Leong, E. Chia-Ming and K. McCrickerd, Fast or slow-foods? Describing natural variations in oral processing characteristics across a wide range of Asian foods, Food Funct., 2017, 8, 595–606 RSC.
- M. S. M. Wee, A. T. Goh, M. Stieger and C. G. Forde, Correlation of instrumental texture properties from textural profile analysis (TPA) with eating behaviours and macronutrient composition for a wide range of solid foods, Food Funct., 2018, 9, 5301–5312 RSC.
- P. S. Hogenkamp, A. Stafleu, M. Mars, J. M. Brunstrom and C. de Graaf, Texture, not flavor, determines expected satiation of dairy products, Appetite, 2011, 57, 635–641 CrossRef PubMed.
- N. Zijlstra, M. Mars, R. A. de Wijk, M. S. Westerterp-Plantenga and C. de Graaf, The effect of viscosity on ad libitum food intake, Int. J. Obes., 2008, 32, 676–683 CrossRef CAS PubMed.
- L. Engelen, A. Fontijn-Tekamp and A. van der Bilt, The influence of product and oral characteristics on swallowing, Arch. Oral Biol., 2005, 50, 739–746 CrossRef PubMed.
- A. Van Eck, E. Franks, C. J. Vinyard, V. Galindo-Cuspinera, V. Fogliano, M. Stieger and E. Scholten, Sauce it up: influence of condiment properties on oral processing behavior, bolus formation and sensory perception of solid foods, Food Funct., 2020, 11, 6186–6201 RSC.
- A. van Eck, N. Hardeman, N. Karatza, V. Fogliano, E. Scholten and M. Stieger, Oral processing behavior and dynamic sensory perception of composite foods: Toppings assist saliva in bolus formation, Food Qual. Prefer., 2019, 71, 497–509 CrossRef.
- M. G. Aguayo-Mendoza, G. Chatonidi, B. Piqueras-Fiszman and M. Stieger, Linking oral processing behavior to bolus properties and dynamic sensory perception of processed cheeses with bell pepper pieces, Food Qual. Prefer., 2021, 88, 104084 CrossRef.
- M. Aguayo-Mendoza, M. Santagiuliana, X. Ong, B. Piqueras-Fiszman, E. Scholten and M. Stieger, How addition of peach gel particles to yogurt affects oral behavior, sensory perception and liking of consumers differing in age, Food Res. Int., 2020, 134, 109213 CrossRef PubMed.
- K. Kohyama, Y. Nakayama, I. Yamaguchi, M. Yamaguchi, F. Hayakawa and T. Sasaki, Mastication efforts on block and finely cut foods studied by electromyography, Food Qual. Prefer., 2007, 18, 313–320 CrossRef.
- K. Shiozawa, Y. Ohnuki, Y. Mototani, D. Umeki, A. Ito, Y. Saeki, N. Hanada and S. Okumura, Effects of food diameter on bite size per mouthful and chewing behavior, J. Physiol. Sci., 2016, 66, 93–98 CrossRef PubMed.
- A. Van Eck, A. Van Stratum, D. Achlada, B. Goldschmidt, E. Scholten, V. Fogliano, M. Stieger and D. Bolhuis, Cracker shape modifies ad libitum snack intake of crackers with cheese dip, Br. J. Nutr., 2020, 124, 988–997 CrossRef CAS PubMed.
- A. Van Eck, C. Wijne, V. Fogliano, M. Stieger and E. Scholten, Shape up! How shape, size and addition of condiments influence eating behavior towards vegetables, Food Funct., 2019, 10, 5739–5751 RSC.
- P. L. Weijzen, D. G. Liem, E. Zandstra and C. De Graaf, Sensory specific satiety and intake: The difference between nibble-and bar-size snacks, Appetite, 2008, 50, 435–442 CrossRef CAS PubMed.
- D. P. Bolhuis and C. G. Forde, Application of food texture to moderate oral processing behaviors and energy intake, Trends Food Sci. Technol., 2020, 106, 445–456 CrossRef CAS.
- M. D. de Lavergne, J. A. Derks, E. C. Ketel, R. A. de Wijk and M. Stieger, Eating behaviour explains differences between individuals in dynamic texture perception of sausages, Food Qual. Prefer., 2015, 41, 189–200 CrossRef.
- A. Fogel, A. T. Goh, L. R. Fries, S. A. Sadananthan, S. S. Velan, N. Michael, M.-T. Tint, M. V. Fortier, M. J. Chan and J. Y. Toh, Faster eating rates are associated with higher energy intakes during an ad libitum meal, higher BMI and greater adiposity among 4· 5-year-old children: Results from the Growing Up in Singapore Towards Healthy Outcomes (GUSTO) cohort, Br. J. Nutr., 2017, 117, 1042–1051 CrossRef CAS PubMed.
- E. C. Ketel, M. G. Aguayo-Mendoza, R. A. de Wijk, C. de Graaf, B. Piqueras-Fiszman and M. Stieger, Age, gender, ethnicity and eating capability influence oral processing behaviour of liquid, semi-solid and solid foods differently, Food Res. Int., 2019, 119, 143–151 CrossRef PubMed.
- A. T. Goh, G. Chatonidi, M. Choy, S. Ponnalagu, M. Stieger and C. G. Forde, Impact of Individual Differences in Eating Rate on Oral Processing, Bolus Properties and Post-Meal Glucose Responses, Physiol. Behav., 2021, 113495 CrossRef CAS PubMed.
- K. McCrickerd and C. G. Forde, Consistency of eating rate, oral processing behaviours and energy intake across meals, Nutrients, 2017, 9, 891 CrossRef PubMed.
- K. K. Haidet, J. Tate, D. Divirgilio-Thomas, A. Kolanowski and M. B. Happ, Methods to improve reliability of video–recorded behavioral data, Res. Nurs. Health, 2009, 32, 465–474 CrossRef PubMed.
- T. Qadri, S. Z. Hussain, A. H. Rather, T. Amin and B. Naseer, Nutritional and storage stability of wheat-based crackers incorporated with brown rice flour and carboxymethyl cellulose (CMC), Int. J. Food Prop., 2018, 21, 1117–1128 CrossRef CAS.
- A. Fogel, A. T. Goh, L. R. Fries, S. A. Sadananthan, S. S. Velan, N. Michael, M. T. Tint, M. V. Fortier, M. J. Chan, J. Y. Toh, Y. S. Chong, K. H. Tan, F. Yap, L. P. Shek, M. J. Meaney, B. F. P. Broekman, Y. S. Lee, K. M. Godfrey, M. F. F. Chong and C. G. Forde, A description of an ‘obesogenic’ eating style that promotes higher energy intake and is associated with greater adiposity in 4.5year-old children: Results from the GUSTO cohort, Physiol. Behav., 2017, 176, 107–116 CrossRef CAS PubMed.
- S. C. Hutchings, J. E. Bronlund, R. G. Lentle, K. D. Foster, J. R. Jones and M. P. Morgenstern, Variation of bite size with different types of food bars and implications for serving methods in mastication studies, Food Qual. Prefer., 2009, 20, 456–460 CrossRef.
- J. B. Hutchings and P. Lillford, The perception of food texture–the philosophy of the breakdown path, J. Texture Stud., 1988, 19, 103–115 CrossRef.
- A. J. Rosenthal and A. Pang, Oral processing of crackers: Changes in the secondary textural characteristics, J. Nutr., Food Lipid Sci., 2018, 1, 01–05 CrossRef.
- S. Park and W. S. Shin, Differences in eating behaviors and masticatory performances by gender and obesity status, Physiol. Behav., 2015, 138, 69–74 CrossRef CAS PubMed.
- C. G. Forde, From perception to ingestion; the role of sensory properties in energy selection, eating behaviour and food intake, Food Qual. Prefer., 2018, 66, 171–177 CrossRef.
- P. S. Teo, A. J. Lim, A. T. Goh, J. Y. M. Choy, K. McCrickerd and C. G. Forde, Texture-based differences in eating rate influence energy intake for minimally processed and ultra-processed meals, Am. J. Clin. Nutr., 2022, 116(1), 244–254 CrossRef PubMed.
- M. J. Gibney, Food texture trumps food processing in the regulation of energy intake, Am. J. Clin. Nutr., 2022, 116(1), 9–10 CrossRef PubMed.
- J. Y. M. Choy, A. T. Goh, G. Chatonidi, S. Ponnalagu, S. M. M. Wee, M. Stieger and C. G. Forde, Impact of food texture modifications on oral processing behaviour, bolus properties and postprandial glucose responses, Curr. Res. Food Sci., 2021, 4, 891–899 CrossRef CAS PubMed.
- A. T. Goh, J. Y. M. Choy, X. H. Chua, S. Ponnalagu, C. M. Khoo, C. Whitton, R. M. van Dam and C. G. Forde, Increased oral processing and a slower eating rate increase glycaemic, insulin and satiety responses to a mixed meal tolerance test, Eur. J. Nutr., 2021, 60, 2719–2733 CrossRef CAS PubMed.
Footnote |
| † Electronic supplementary information (ESI) available. See DOI: https://doi.org/10.1039/d2fo00485b |
| This journal is © The Royal Society of Chemistry 2022 |

