TOF mass spectra of zircon M257 measured by VUV laser desorption ionization†
Feng
Liu
a,
Haoyu
Shi
a,
Kui
Liang
a,
Jia
Wang
a,
Tao
Long
b,
Zhanping
Li
c and
Yuxiang
Mo
 *a
*a
aDepartment of Physics, State Key Laboratory of Low-Dimensional Quantum Physics, Tsinghua University, Beijing 100084, China. E-mail: ymo@mail.tsinghua.edu.cn
bInstitute of Geology, Chinese Academy of Geological Sciences, Beijing SHRIMP Center, Beijing, China
cDepartment of Chemistry, Beijing Key Laboratory of Microanalytical Methods and Instrumentation, Tsinghua University, Beijing, 100084, China
First published on 22nd November 2021
Abstract
A method was developed to measure the time-of-flight (TOF) mass spectra of zircon M257 based on our significantly improved vacuum ultraviolet (VUV) laser desorption ionization (VUVDI) mass spectrometer. A zircon sample embedded in an epoxy slice was inserted in the middle of an extraction electric field. A high voltage pulse was applied to the side surface of the slice to correct the deformation of the electric field arising from the polarization of the epoxy slice. A mass gate was also used in the TOF tube to maintain the sensitivities of the microchannel plate detector towards U+ and Pb+ fragments by depleting the earlier signals in the TOF spectra. For comparison, a TOF-SIMS mass spectrum of M257 was also recorded, using Bi1+ as the primary ion beam. We found that the VUVDI-TOF spectrum with a sampling volume of ∼2 fL (2 × 10⁻¹⁵ L) has similar signal to noise ratios with those of TOF-SIMS spectrum with a sampling volume ∼2000 fL. The Hf+, Pb+, Th+ and U+ and their oxide signals in the VUVDI-TOF spectra were found to feature more intense signals than those in TOF-secondary ion mass (SIMS) spectra. Similar results were also observed for the ion fragments Zr2On+(n = 1–4), ZrSiO2+ and ZrSiO3+.
1. Introduction
The laser desorption ionization (LDI) method has been used to measure the mass spectra of solid samples for over 50 years.1–7 In its original form, it is conceptually simple and easy to implement: a focused nanosecond pulsed laser beam with a fixed wavelength in the infrared (IR), visible or ultraviolet (UV) region ablates the surface of a solid sample and forms a hot plasma, and ion fragments can be detected using various mass spectrometry methods, for example, time-of-flight (TOF), quadrupole, and magnetic sector mass analyzers. With the advantages of high sensitivities and simple procedures for sample preparation, LDI methods have been applied in various fields, such as the detection of trace elements in lunar meteorites.7 However, the inherent drawbacks of LDI methods are obvious: broad fragment kinetic energy distributions that make it difficult to act as an ion source in high-resolution mass spectrometry, and tight focusing of the laser beams producing mostly atomic or small molecular fragments, which make it unsuitable for the analysis of organic samples.Recently, many new techniques have been developed to overcome the above-mentioned drawbacks.8–14 For example, orthogonal time-of-flight methods are used to sample only some of the ionic fragments with less kinetic energy distributions,8 which considerably improves the mass resolution of the LDI mass spectra. Femtosecond pulsed laser beams have been used as the desorption ionization source, which provide a relatively cold ionization method.9–14 Important progress has also been made in the application of nanosecond extreme ultraviolet (EUV, 46.9 nm, 26.4 eV) and vacuum ultraviolet (VUV, 125 nm 9.9 eV) laser beams.15–20 Unlike the cases of IR, UV and even DUV lasers, EUV/VUV lasers have such high single photon energies that they can directly ionize all metallic elements and almost all polyatomic molecules in the solid state, the mechanism of EUV/VUV desorption ionization (EUVDI/VUVDI) thus being fundamentally different from those using IR, UV and DUV lasers. In terms of VUV lasers, there is another notable advantage, the single photon energies of the VUV laser are usually 2 to 3 eV above the work-functions of the metallic elements and are similar to the ionization energies of most organic molecules in the gas phase. The VUVDI method is therefore expected to produce relatively cold plasma that could be used as an ion source in a high-resolution mass spectrometer.
VUV and EUV laser beams can be focused down to a spot with a submicrometer diameter and a few or sub-nanometer depth, and mass spectrometry images with such spatial resolution have already been demonstrated.15–20 Because of the very low volumes sampled by the VUV laser, the number of product ions is around two to three orders lower than those with an ablation size of tens of micrometers. The sensitivity of the instrument is therefore essential to the success of the VUVDI method. Therefore, to maximize the collection efficiency of the ion fragments, in our previous experimental setup, samples mounted on a quartz plate were placed at the center of an extraction electric field.18–20 However, the polarization of the quartz plate under the electric field distorted the extraction electric field, which resulted in a loss in signals, particularly for heavy ion fragments. In this paper, we report a method to correct the distortions to the extraction electric field.
As a demonstration of our improved instrument, we have measured the mass spectra of zircon M257, which has been one of the famous reference materials in Pb–U dating since it was characterized in 2008.21–27 Its main chemical components are ZrO2 (66%) and SiO2 (32%), and the main trace elements Hf, Pb, Th and U have contents of 10![[thin space (1/6-em)]](https://www.rsc.org/images/entities/char_2009.gif) 610, 83.2, 229 and 853 μg g−1, respectively (μg g−1 ≅ ppm). There are also rare earth elements present at ppm level.21–26
610, 83.2, 229 and 853 μg g−1, respectively (μg g−1 ≅ ppm). There are also rare earth elements present at ppm level.21–26
For quantitative analysis of the elemental content of the zircon grains, secondary ion mass spectrometry (SIMS) with a magnetic sector mass analyzer and multi-detectors is widely used, which has the advantages of high sensitivity, accuracy and submicrometer lateral resolution.28,29 However, for simultaneous analysis of multiple elements and zircon oxides, the SIMS method with time-of-flight mass analyzer (TOF-SIMS) is more convenient. We also measured the mass spectra of M257 using the latter method. The experimental results indicated that the newly improved VUVDI method has the potential to be an in situ TOF mass spectrometry method by which to measure the trace elements in the surfaces of solid samples with high sensitivity and spatial resolution.
2. Experimental method
2.1 VUVDI-TOF mass spectra
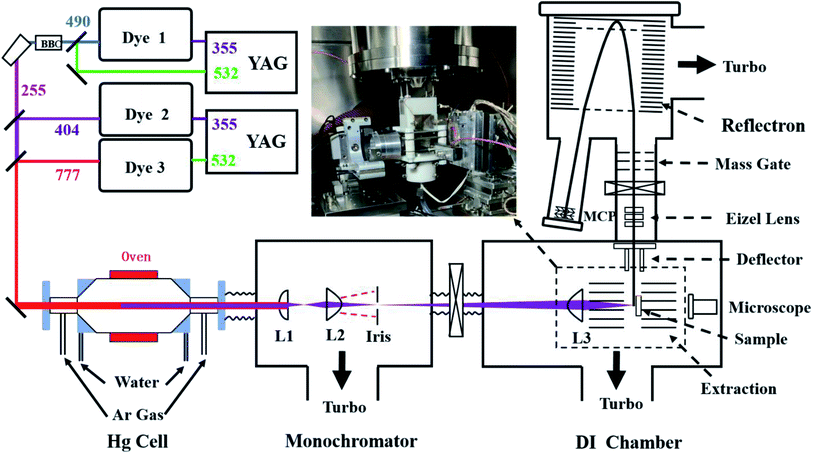
The VUVDI-TOF mass spectrometer has been described in detail previously.18–20 In comparison with the previous one, the present setup has been mainly improved in three way: (1) the linear TOF tube in the previous setup has been replaced by a two-stage reflectron to increase the mass resolution, (2) the wavelength of the VUV photon has been changed from 125 nm (9.9 eV) to 130 nm (9.5 eV) to enhance the overall VUV intensities, and (3) a pulsed electric field has been added to correct the distorted extraction electric field due to the polarization of the sample mount located in the extraction electric field.A schematic diagram of the setup is shown in Fig. 1. A 130 nm VUV laser beam was generated via four-wave mixing method using three collimated laser beams and a heated Hg cell.18,30,31 The temperature of the Hg cell was kept at ∼500 K. The three fundamental laser beams were fixed at wavelengths of 777.7, 404.5 and 255.0 nm with pulse energies of around 10, 10 and 1 mJ per pulse, respectively. The 777.7 and 404.5 nm lasers were generated by two dye lasers pumped using the same YAG laser. The 255 nm laser beam was generated from the sum-mixing of the second harmonics (532 nm) output of another YAG laser with the 490 nm dye laser beam pumped also using the YAG laser. The repetition rate of the VUV laser was 20 Hz.
As shown in Fig. 1, in the monochromator chamber, a combination of two MgF2 lenses (L1 and L2, L2 is aspherical) and an iris of ϕ 30 μm was used to separate the VUV beam from the fundamental laser beams and to control the VUV spot size before the final focus lens. The final lens (L3) is aspherical with f = 30 mm, which is located in the desorption ionization (DI) chamber. The monochromator and LDI chambers were respectively pumped using a turbopump (1200 L s−1), and the pressures for both chambers were ∼1 × 10⁻⁴ Pa. The size of the fundamental and VUV laser beams at the iris were ∼ϕ 5 mm and ∼ϕ 15 μm, respectively, therefore, only ∼1 × 10⁻⁵ of the fundamental laser beam went through the iris. The ablated spot size was ϕ 0.5–2 μm, depending on the size of the focus spot, VUV energies and the samples. We measured the crater size of a Qinghu zircon, another widely used reference,32 using an atomic force microscope under typical experimental conditions, where the average size of the crater for one VUV pulse ablation was about ϕ 0.5 μm, with a depth of ∼0.5 nm per pulse (Fig. S1 and S2†). Because of the similar physical properties between zircons M257 and Qinghu, we expected a similar crater size for zircon M257. The intensity of the VUV laser was measured as ∼100 mV per pulse before the final focus lens using the photoelectric effect of a Cu plate, estimated to be about 200 nJ per pulse.
It was noted that the transmissions of MgF2 crystals in the VUV region are strongly dependent on the wavelengths and the quality of the crystals. We used three MgF2 lenses and one MgF2 window, as mentioned above. We estimated that the overall transmissions were around 5% and 10% for VUV light at 125 and 130 nm, respectively. The efficiencies for the generation of 125 and 130 nm laser intensities from four wave mixing, which are dependent on the fundamental laser intensities, are comparable.31
The ions were extracted using a delayed high voltage pulse (+3500 V) with a delay of ∼100 ns relative to the VUV laser pulse. The ion-source had a single-stage structure with an electric field of ∼3180 V cm−1. The extracted ions were analyzed using a newly built two-stage reflectron TOF tube, which was pumped using two 300 L s−1 turbopumps with a pressure of 2 × 10⁻⁶ Pa. The total field free flight distance for the ions was ∼1600 cm. A Z-stack detector consisting of three ϕ 55 mm microchannel plates (North Night Vision Corp., Nanjing, China) was used as the ion detector. The anode of the detector was connected to a digital oscilloscope (Teledyne LeCroy HDO 6104, bandwidth 1 GHz, 12 bit vertical resolution, 2.5 GHz sampling rate) using a 50 Ohm cable. The TOF mass spectra were recorded by the digital oscilloscope and averaged in the oscilloscope for 6000 pulses or 300 s. To avoid mass fractionation due to the deep hole effect,24 the VUV laser scanned an area of 10 × 10 μm2 with a 3D linear piezo stage with a step of 0.5 μm per pulse. The first five layers were used as the cleaning processes. In total, 30 layers were used. The depth of the ablation was ∼20 nm. Therefore, the sample used in the measurements was about 2 fL (1 fL = 10−15 L). The resolution of the mass spectra was ∼2600 at m/z 206 and the mass accuracy was better than 0.01 Da.
For zircon M257, the signals in the VUVDI-TOF mass spectra were dominated by SiO+, Zr+ and ZrO+ fragments.21–26 These ions lower the sensitivity of the MCP detector towards heavier ions. To maintain the sensitivity of the MCP detector towards Pb+ and U+ fragments, a pulsed mass gate was used to deflect ions with mass weights of less than those of the ZrO2+ fragments. The mass gate consisted of two parallel electrodes with fine mesh perpendicular to the ion flight-path, in which one electrode was grounded and a high electric voltage pulse was applied through the other. The mass gate was located at an earlier position in the TOF tube, see Fig. 1.
2.2 Sample and compensation electric field
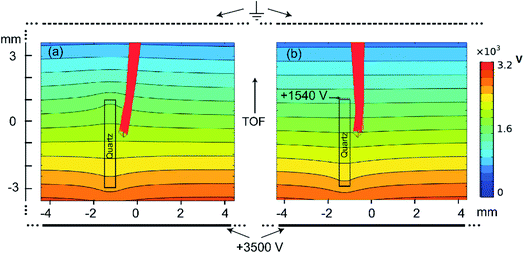
The M257 samples were well polished following the general procedures of the sample treatments in zircon dating using the SIMS method. The samples were embedded in an epoxy slice that was held by a 3D stage nanometer positioner. The size of the epoxy slice was 0.5 × 4 × 40 mm3. The epoxy slice was placed under the extraction electric field with its wide side parallel to the direction of the electric field, as shown in Fig. 1. The thin side of the slice was covered by copper foil of 30 μm in thickness or coated with Ag film. A pulsed voltage (∼1600 V) was applied to this copper foil along with an electric pulse applied to the extraction electrode about 100 ns after the VUV laser.As we mentioned, an insulator under an extraction electric field will be polarized and deform the electric field for extraction. We found that this polarization effect resulted in the loss of ion signals, which was worse for heavier ion fragments. To understand the effect of polarization on the electric field strengths and ion trajectories, we calculated the extraction electric field with a quartz slice inside it using the COMSOL (Version 5.4) software. Fig. 2(a) and (b) show the potential contours of the electric field and ion trajectories without and with the compensation electric field, respectively. It can be seen in panel (a) that the extraction electric field strength was distorted, and that the ion trajectories have angles 10° relative to the TOF tube axis, while in panel (b), the distortions to the extraction electric field are mostly eliminated, and the trajectories of the ions are almost parallel to the TOF tube axis. Because of the trajectories, the ions produced in the case of no compensation electric field have less probability of reaching the detector, therefore, the polarization of the epoxy slice decreased the number of ions that hit the MCP detector.
2.3 TOF-SIMS spectra
The SIMS spectra were measured using a commercial TOF. SIMS 5–100 instrument (Ion-TOF, GmbH, Germany). The primary pulsed ion beam was Bi1+ and the instrument was operated at 30 keV (10 kHz). The scanned area of the primary beam was 200 × 200 μm2. For every three scans of the primary beam (5 seconds), an ablation beam of O2+ cleaned the surface (2 seconds). The spectrum for M257 was accumulated for 300 s. The depth of the ablation volume was estimated to be ∼50 nm. The ablated volume was ∼2000 fL, i.e. ∼1000 times larger than that of the volume ablated by the VUV laser. The resolution of the SIMS mass spectra was ∼6000, with a mass accuracy of ∼0.003 dalton.3. TOF mass spectra of zircon M257
3.1 Survey of the mass spectra
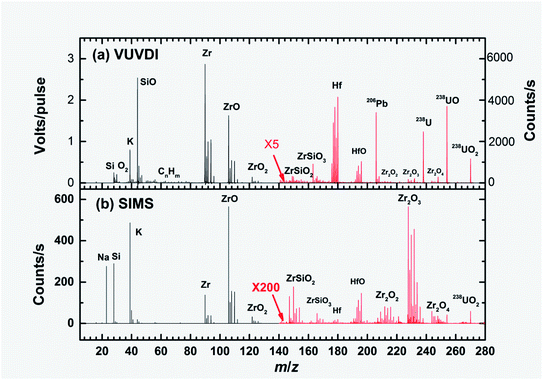
Fig. 3(a) and (b) show the overall TOF mass spectra of zircon M257 measured using the VUVDI and SIMS methods, respectively. Note that the signal intensities were averaged and are presented in terms of volts per pulse and counts per second in the VUVDI-TOF and TOF-SIMS spectra, respectively, due to the different signal recording methods. For semi-quantitative comparison of the signal intensities between the two methods, we assumed that a 10 mV per pulse in the VUVDI-TOF spectra corresponded to ∼20 counts per second (our MCP detector has a response of 5–50 mV for a single ion) considering the repetition rates (20 Hz) of our VUV laser.Because of strong matrix effects, the ion signal intensities in the VUVDI-TOF (TOF-SIMS) spectra are dependent on many factors, such as the laser (primary) beam intensities, laser beam (primary beam) spot size and charge buildup in the sample surface. Therefore, the comparison of signal intensities between the two methods is only semi-quantitative or even qualitative.
To maintain the sensitivity of the MCP detector towards ion fragments of m/q > 140, we deflected the lighter masses using the mass gate in the TOF tube in obtaining the VUVDI spectra, as mentioned above. In Fig. 3(a), the mass spectrum with m/q > 140 was increased 5 times and was measured using the mass gate. For the TOF-SIMS spectra, there was no mass gate available from the instrument, therefore, for the convenience of comparison, we increased the signal intensity by 200 times for this section of the spectrum, as indicated in Fig. 3(b).
For the SIMS spectra, it can be seen that the Zr+ and ZrO+ fragments dominate. For the VUVDI spectra, both fragments are also among the strongest ones, however, in contrast to those of the SIMS mass spectra, the heavier masses (over 140) still have appreciable intensities, which is particularly true for the Hf+, U+ and Pb+ isotopes. In the VUVDI spectra, the Hf+ signals have intensities of ∼0.4 V per pulse (∼800 counts per second), about 1/8 of the maximum signal of Zr+, 3 V per pulse (∼6000 counts per second). In the SIMS spectra, the Hf+ signals have intensities of 0.1 counts per second, about 1/6000 of the maximum signals of ZrO+, 600 counts per second.
3.2 Rare earth elements in the TOF mass spectra
Elemental analysis has been one of the main applications of laser ablation and SIMS mass spectrometry methods.1–3,21–27 Panels (a) and (b) in Fig. 4 show the mass spectra in the range of rare earth elements (REEs) that are particularly interesting in the chemical composition analysis of zircon minerals.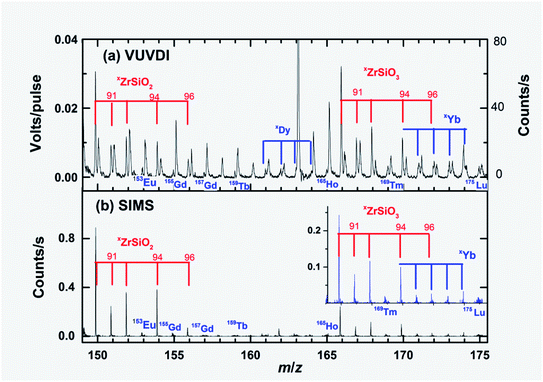 | ||
| Fig. 4 Expanded mass spectra of Fig. 3 showing ZrSiO2+ and ZrSiO3+ fragments. Several observed rare earth elements are also shown in the figure. For panel (a), when there are two unresolved peaks, the right side of the peaks are from hydrocarbon ions originating from epoxy that supported the zircon. The y-axis on the right side of panel (a) shows the signal intensities in terms of approximate counts per second. | ||
The contents of REEs in zircon M257 are in the range of 0.4–25 ppm from light to heavy elements.21,23 Only very weak signals (<0.1 counts per second) of 153Eu+, 155Gd+, 157,159Tb+, 161-164Dy+, 165Ho+, 168Tm+,171–174Yb+ and 175Lu+ were observed in the TOF-SIMS mass spectra. For the VUVDI-TOF mass spectra, these signals were also very weak, however, they were stronger than those observed in the TOF-SIMS spectra, as can be seen from Fig. 4. The content of Yb was previously measured to be 45 ppm in M257.21 The isotope 174Yb is thus ∼15 ppm according to the isotopic compositions. The signals of 174Yb+ were 0.05 count per second and 0.05 V per pulse (100 counts per second) from the TOF-SIMS and VUVDI-TOF mass spectra, respectively. Therefore, the VUVDI-TOF method is obviously more sensitive in comparison with the TOF-SIMS method for the detection of Yb. Based on this fact, we may also conclude that the VUVDI method can be used to detect elements at as low as 10 ppm with an ablation volume of 2 fL. Unfortunately, there were some interference signals from hydrocarbon cations, CxHyOz+, in the VUVDI-TOF spectra, which are to the right of the peaks of the REEs. These hydrocarbon ions originate from the contamination of the epoxy mount. In the TOF-SIMS mass spectra, the interference ion signals were negligible. This may be due to two reasons: (a) the primary ion beam in the SIMS method ablated more molecules from the surface of the zircon than those ablated by the VUV laser beam, and (b) the surface cleaning process using the O2+ beam may also play a role.
3.3 U+, Th+, Pb+ and Hf+ fragments in the TOF mass spectra
As can be seen from Fig. 1(b), the ion signals of 238U+, 238UO+,238UO2+, 206–208Pb+, 232Th+ and 232ThO+ are very weak in the TOF-SIMS spectrum, in contrast with measurements using magnetic sector SIMS instruments with a continuous O− primary beam.21–23 The later methods have large counting rates for these ion fragments and have been widely used in the measurement of Pb/U ratios in U–Pb dating. The main reason for this difference is that the TOF-SIMS method employs a pulsed primary beam, therefore, the interaction time of the primary beam with the sample is about two or three orders less than that of the continuous primary beam used in the sector-based SIMS method.Table 1 lists the ion intensities (heights of the peaks) of Pb+, Th+, U+ and their oxides in the VUVDI-TOF spectrum shown in Fig. 3. It was noted that the relative signal intensities between the different element isotopes, for example the ratio of [206Pb+]/[238U+], were dependent on the experimental conditions and matrix effects. For the isotopic ratios between [206Pb+], [207Pb+] and [208Pb+], the matrix effects and mass fractionation of the samples should be negligible, however, dynamic ranges and mass fractionation of the instrument may still play a role. A protocol for the quantitative analysis of the elemental content of zircon is out of the scope of the present work.
| a The TOF spectra were measured under typical experimental conditions using an average of 6000 laser pulses and a sampling volume of ∼2 fL. Note that the relative signal intensities among the ions were dependent on the experimental conditions and matrix effects. | |||||||||
|---|---|---|---|---|---|---|---|---|---|
| 206Pb | 207Pb | 208Pb | 238U | 238UO | 238UO2 | 232Th | 232ThO | 232ThO2 | |
| Volts per pulsea | 0.3408 | 0.0196 | 0.0319 | 0.2475 | 0.3708 | 0.1166 | 0.0219 | 0.0290 | 0.0022 |
The [207Pb]/[206Pb] isotope ratios in zircon can be directly used in dating. Our measured [207Pb+]/[206Pb+] ratio, based on the heights of the corresponding peaks, was 0.058 (±0.005), which is in good agreement with the recognized value of [207Pb]/[206Pb], of 0.05889. For the [208Pb]/[206Pb] ratio, our measured value [208Pb+]/[206Pb+] was 0.094 (±0.009), which is very different from the recognized value of 0.0834. One of the reasons for this is that there is an interference in the signal of [208Pb+] from 176HfO2+, as can be seen from Fig. 5(b). However, the interference of 174HfO2+ to 206Pb+ should be negligible due to the low abundance, 0.0016, of 174Hf. Note that accurate isotopic ratios should be derived based on statistics of pulse to pulse or statistics of average ratios in a short time. With further improvements in the mass resolution of the present instrument (for example, m/Δm = 6000), the VUVDI-TOF method could be employed in the accurate measurement of [207Pb]/[206Pb] isotope rations, which is critical in the Pb–U dating of zircons. It is also interesting to note that 206PbO+ was also observed in the VUVDI-TOF mass spectra, which is rarely observed in the SIMS method.
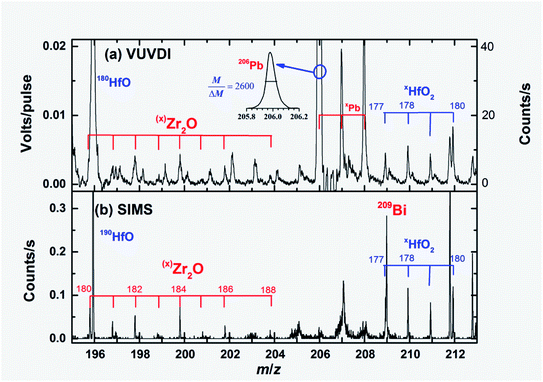 | ||
| Fig. 5 Expanded mass spectra of Fig. 3 showing Zr2O+ and HfO2+ fragments. The mass resolution of the VUVDI-TOF spectra is ∼2600, as shown by the peak of 206Pb. The 209Bi+ in the TOF-SIMS spectra originated from the primary beam of the SIMS. The y-axis on the right side of panel (a) shows the signal intensities in terms of approximate counts per second. | ||
The [206Pb]/[238U] ratio is perhaps the most important quantity in Pb–U dating. The [206Pb]/[238U] ratio of zircon M257 was previously measured to be 0.091 using the TIMS method.21 The measured [206Pb+]/[238U+] ratio is 1.38 using the VUVDI method, which is much greater than 0.091. If we sum all the oxides of 238U+, the [206Pb+]/{[238U+] + [238UO+] + [238UO2+]} ratio is 0.46, is still much greater than 0.091. Therefore, it can be observed that the sensitivity towards Pb of the VUVDI method is higher than that of U.
In the SIMS method, element abundances or relative ratios in an unknown zircon can be determined using the relative sensitivity factors (RSF) of a reference zircon that has similar matrix effects to the unknown zircon. However, it has long been recognized that the RSF values of [206Pb]/[238U] are strongly dependent on matrix effects and the experimental conditions.29 [206Pb]/[238U] ratios are usually determined using a so-called power law:29,33
 | (1) |
The [206Pb]/[238U] ratios can be determined by measuring the parameters, b, of the unknown and reference zircon grains under the same experimental conditions. Because the VUVDI method is in some way like the SIMS method, future studies should be carried out to investigate if such correlations also exist in VUVDI measurements.
3.4 Oxides in the TOF mass spectra
The zircon mainly consists of ZrSiO4. In both the VUVDI-TOF and TOF-SIMS spectra, the ionic fragments ZrSiO2+ and ZrSiO3+ were observed, as shown in panels (a) and (b) of Fig. 4, respectively. However, the parent ion ZrSiO4+ was not observed, which may be due to its instability. The signal intensities of ZrSiO2+ and ZrSiO3+ in the TOF-SIMS spectra were weak, 0.8 and 0.1 counts per second, respectively. In the VUVDI-TOF spectra, they were both ∼0.03 V per pulse (60 counts per second), stronger than those in the TOF-SIMS spectra. Our previous studies showed that for organic samples, the VUVDI-TOF spectra have lower levels of fragmentation than those in the TOF-SIMS spectra or have relatively intense signals for heavier masses than those in the TOF-SIMS mass spectra.16 The present results on the mass spectra of ZrSiO2+ and ZrSiO3+ show similar trends.The zirconium oxides Zr2Om+ (m = 1, 2, 3 and 4) were also observed, as seen in Fig. 1, 5 and 6. The isotopologue abundance ratios of (x)Zr2 are helpful in the assignment of mass spectra, which were 0.26, 0.12, 0.19, 0.04, 0.21, 0.04, 0.09, 0.00, 0.04,0.00, and 0.01 from x = 180 to 190, respectively. For the TOF-SIMS spectra, the signals of Zr2O3+ are very strong in comparison with those of Zr2O4+. In the VUVDI-TOF, the signals of Zr2O3+ and Zr2O4+ are comparable.
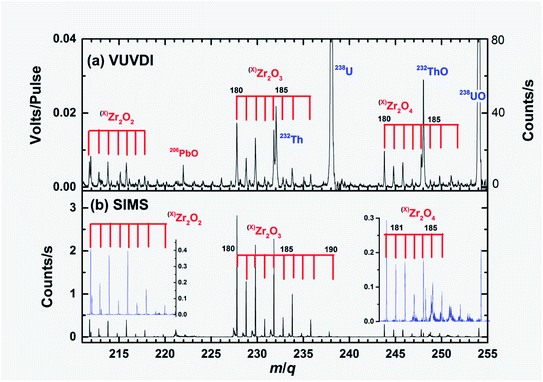 | ||
| Fig. 6 Expanded mass spectra of Fig. 3 showing the Zr2O2+, Zr2O3+ and Zr2O4+ fragments. Note that there are almost no 232Th+, 238U+, 232ThO+ and 238UO+ signals in the TOF-SIMS spectra. The y-axis on the right side of panel (a) shows the signal intensities in terms of approximate counts per second. | ||
As seen in Fig. 6(a), the (184)Zr2O3+ and (184)Zr2O4+ mass peaks interfere with those of 232Th+ and 232ThO+. Therefore, it is necessary to resolve the two peaks in the U–Th dating of zircon. (190)Zr2O3+ and (190)Zr2O4+ can interfere with 238U+ and 238UO+, however, the effects are lower than 0.05% of the total signals in the VUVDI-TOF spectra.
4. Summary
We measured the VUVDI-TOF mass spectra of zircon M257 using our previously reported instrument, however, there are three important modifications of the instrument: (a) to enhance the overall intensities of the VUV laser, its wavelength has been changed from 125 to 130 nm, (b) to compensate the polarization effect of the epoxy slice under the extraction electric field that was used as the mount of the zircon sample, a high voltage pulse was applied to the side of the slice, and (c) the linear TOF tube was replaced by a reflectron TOF tube.For comparison, a mass spectrum of zircon M257 was measured using the TOF-SIMS method with a Bi1+ primary beam. The experimental results showed that the two methods have similar signal-to-noise ratios, although there were three orders of magnitude differences in the sampling volumes, 2 fL for the VUVDI and ∼2000 fL for the TOF-SIMS. For the signals of U+, Pb+ and Th+ and their oxides, the signals in the VUVDI-TOF spectra are stronger than those obtained from TOF-SIMS spectra. Similar results were observed for Zr2On+ (n = 1–4), ZrSiO2+ and ZrSiO3+. The experimental results demonstrated that the VUVDI-TOF method has the potential to be used as a tool in the detection of Pb, U, Th, Zr and Hf elements in zircon grains with a spatial resolution of 10 × 10 μm2.
Conflicts of interest
There are no conflicts to declare.Acknowledgements
This work was funded by Projects No. 21833003, 21773134, and 21327902 supported by the National Natural Science Foundation of China.References
- G. E. Bernal, L. P. Levine and J. F. Ready, Rev. Sci. Instrum., 1966, 37, 938 CrossRef.
- N. C. Fenner and N. R. Daly, Rev. Sci. Instrum., 1966, 37, 1068 CrossRef CAS.
- V. A. Azov, L. Mueller and A. A. Makarov, Mass Spectrom. Rev., 2020, 41, 100 CrossRef PubMed.
- L. Hanley, R. Wickramasinghe and Y. P. Yung, Annu. Rev. Anal. Chem., 2019, 12, 225 CrossRef CAS PubMed.
- C. Bhardwaj and L. Hanley, Nat. Prod. Rep., 2014, 31, 756 RSC.
- R. O. Lawal, F. Donnarumma and K. K. Murray, J. Mass Spectrom., 2019, 54, 281 CrossRef CAS PubMed.
- S. Frey, R. Wiesendanger, M. Tulej, M. Neuland, A. Riedo, V. Grimaudo, P. Moreno-Garcia, A. C. López, M. Mohos, B. Hofmann, K. Mezger, P. Broekmann and P. Wurz, Planet. Space Sci., 2020, 182, 104816 CrossRef CAS.
- L. Chen, L. Lin, Q. Yu, X. Yan, W. Hang, J. He and B. Huang, J. Am. Soc. Mass Spectrom., 2009, 20, 1355 CrossRef CAS PubMed.
- R. Hergenröder, O. Samek and V. Hommes, Mass Spectrom. Rev., 2006, 25, 551 CrossRef PubMed.
- Y. Cui, I. V. Veryovkin, M. W. Majeski, D. R. Cavazos and L. Hanley, Anal. Chem., 2015, 87, 367 CrossRef CAS PubMed.
- M. He, Y. Meng, S. Yan, W. Hang, W. Zhou and B. Huang, Anal. Chem., 2017, 89, 565 CrossRef CAS PubMed.
- Z. Yin, Z. Xu, R. Liu, W. Hang and B. Huang, Anal. Chem., 2017, 89, 7455 CrossRef CAS PubMed.
- R. Wiesendanger, V. Grimaudo, M. Tulej, A. Riedo, R. Lukmanov, N. Ligterink, R. Fausch, H. Shea and P. Wurz, J. Anal. At. Spectrom., 2019, 34, 2061 RSC.
- M. Tulej, N. F. W. Ligterink, C. de Koning, V. Grimaudo, R. Lukmanov, P. K. Schmidt, A. Riedo and P. Wurz, Appl. Sci., 2021, 11, 2562 CrossRef CAS.
- I. Kuznetsov, J. Filevich, F. Dong, M. Woolston, W. L. Chao, E. H. Anderson, E. R. Bernstein, D. C. Crick, J. J. Rocca and C. S. Menoni, Nat. Commun., 2015, 6, 6944 CrossRef CAS PubMed.
- T. Green, I. Kuznetsov, D. Willingham, B. E. Naes, G. C. Eiden, Z. Zhu, W. Chao, J. J. Rocca, C. S. Menoni and A. M. Duffin, J. Anal. At. Spectrom., 2017, 32, 1092 RSC.
- L. A. Rush, J. B. Cliff, D. D. Reilly, A. M. Duffin and C. S. Menoni, Anal. Chem., 2021, 93, 1016 CrossRef CAS PubMed.
- J. Wang, F. Liu, Y. Mo, Z. Wang, S. Zhang and X. Zhang, Rev. Sci. Instrum., 2017, 88, 114102 CrossRef PubMed.
- J. Wang, Z. Wang, F. Liu, Y. Mo, L. Cai, C. Sun, S. Zhang, R. Zhang, Z. Abliz and X. Zhang, Int. J. Mass Spectrom., 2018, 432, 9 CrossRef CAS.
- J. Wang, Z. Wang, F. Liu, L. Cai, J. Pan, Z. Li, S. Zhang, H. Chen, X. Zhang and Y. Mo, Anal. Chem., 2018, 90, 10009 CrossRef CAS PubMed.
- L. Nasdala, W. Hofmeister, N. Norberg, J. M. Martinson, F. Corfu, W. Dörr, S. L. Kamo, A. K. Kennedy, A. Kronz, P. W. Reiners, D. Frei, J. Kosler, Y. Wan, J. Götze, T. Häger, A. Kröner and J. W. Valley, Geostand. Geoanal. Res., 2008, 32, 247 CrossRef CAS.
- W. Yang, Y.-T. Lin, J.-C. Zhang, J.-L. Hao, W.-J. Shen and S. Hu, J. Anal. At. Spectrom., 2012, 27, 479 RSC.
- Y. Liu, Q.-L. Li, G.-Q. Tang and X.-H. Li, Geostand. Geoanal. Res., 2020, 44, 421 CrossRef CAS.
- Q. Li, Y. Liu, G. Tang, K. Wang, X. Ling and J. Li, J. Anal. At. Spectrom., 2018, 33, 1536 RSC.
- J. M. Thompson, L. V. Danyushevsky, O. Borovinskaya and M. Tanner, J. Anal. At. Spectrom., 2020, 35, 2282 RSC.
- T. Long, S. W. J. Clement, H. Xie and D. Liu, Int. J. Mass Spectrom., 2020, 450, 116289 CrossRef CAS.
- R. H. Smithies, Y. Lu, C. L. Kirkland, T. E. Johnson, D. R. Mole, D. C. Champion, L. Martin, H. Jeon, M. T. D. Wingate and S. P. Johnson, Nature, 2021, 592, 70 CrossRef CAS PubMed.
- J.-L. Hao, W. Yang, S. Hu, R.-Y. Li, J.-L. Ji, H. G. Changela and Y.-T. Lin, J. Anal. At. Spectrom., 2021, 36, 1625 RSC.
- A. K. Schmitt and J. A. Vazquez, Rev. Mineral. Geochem., 2017, 83, 199 CrossRef CAS.
- C. H. Muller III, D. D. Lowenthal, M. A. DeFaccio and A. V. Smith, Opt. Lett., 1988, 13, 651 CrossRef CAS PubMed.
- D. R. Albert, D. L. Proctor and H. F. Davis, Rev. Sci. Instrum., 2013, 84, 063104 CrossRef PubMed.
- X. Li, G. Tang, B. Gong, Y. Yang, K. Hou, Z. Hu, Q. Li, Y. Liu and W. Li, Chin. Sci. Bull., 2013, 58, 4647 CrossRef CAS.
- H. Jeon and M. J. Whitehouse, Geostand. Geoanal. Res., 2015, 39, 443 CrossRef CAS.
Footnote |
| † Electronic supplementary information (ESI) available. See DOI: 10.1039/d1ja00191d |
| This journal is © The Royal Society of Chemistry 2022 |

