 Open Access Article
Crystal field-induced lattice expansion upon reversible oxygen uptake/release in YbMnxFe2−xO4†
Tianyu
Li
a,
Rishvi
Jayathilake
a,
Lahari
Balisetty
a,
Yuan
Zhang
a,
Brandon
Wilfong
ab,
Timothy J.
Diethrich
 a and
Efrain E.
Rodriguez
 *ab
*ab
aDepartment of Chemistry and Biochemistry, University of Maryland, College Park, Maryland 20742-2115, USA. E-mail: efrain@umd.edu
bMaryland Quantum Materials Center, University of Maryland, College Park, Maryland 20742, USA
First published on 18th November 2021
Abstract
We successfully form the solid solutions YbMnxFe2−xO4 for x = 0.25, 0.50, 0.75, and 1.0 in order to study the mechanism of oxygen release and uptake as a function of Mn substitution. High-resolution synchrotron X-ray diffraction (SXRD) reveals that YbMnxFe2−xO4 readily take up oxygen and undergo a structural transition from R![[3 with combining macron]](https://www.rsc.org/images/entities/char_0033_0304.gif) m to P
m to P![[3 with combining macron]](https://www.rsc.org/images/entities/char_0033_0304.gif) to become hyper-stoichiometric YbMnxFe2−xO4.5, which demonstrates their potential as oxygen storage materials. X-ray photoelectron spectroscopy (XPS) implies that Mn2+ and Fe2+ oxidize to Mn3+ and Fe3+ after the structural transition. Thermogravimetric analysis (TGA) and in situ SXRD measurements at elevated temperatures show that O2 uptake commences at 200 °C but the structural transition does not until 300 °C. The structural evolution under methane and air, monitored by in situ SXRD, implies promising reversibility and structural stability in this series. By performing structural refinements, we find that Mn substitution causes the lattice parameters, a and c, to evolve in a diametric fashion. Strong anisotropic expansion of the lattice occurs in all the reduced phases YbMnxFe2−xO4 (R
to become hyper-stoichiometric YbMnxFe2−xO4.5, which demonstrates their potential as oxygen storage materials. X-ray photoelectron spectroscopy (XPS) implies that Mn2+ and Fe2+ oxidize to Mn3+ and Fe3+ after the structural transition. Thermogravimetric analysis (TGA) and in situ SXRD measurements at elevated temperatures show that O2 uptake commences at 200 °C but the structural transition does not until 300 °C. The structural evolution under methane and air, monitored by in situ SXRD, implies promising reversibility and structural stability in this series. By performing structural refinements, we find that Mn substitution causes the lattice parameters, a and c, to evolve in a diametric fashion. Strong anisotropic expansion of the lattice occurs in all the reduced phases YbMnxFe2−xO4 (R![[3 with combining macron]](https://www.rsc.org/images/entities/char_0033_0304.gif) m) and oxidized phases YbMnxFe2−xO4.5 (P
m) and oxidized phases YbMnxFe2−xO4.5 (P![[3 with combining macron]](https://www.rsc.org/images/entities/char_0033_0304.gif) ). We propose that this phenomenon can be attributed to d-electron filling and crystal field effects for the Mn and Fe cations.
). We propose that this phenomenon can be attributed to d-electron filling and crystal field effects for the Mn and Fe cations.
1. Introduction
Oxygen storage materials (OSMs) can take up oxygen into their crystal lattices under oxidation conditions (e.g. heating in air) and reversibly release oxygen from their lattices to the environment during reduction (e.g. reduction by H2 or CH4). In addition to their oxygen storage capacity, OSMs draw great interest in the fields of gas separation,1–3 fuel combustion efficiency4–6 and fuel conversion.7–12 Ideal OSMs should possess proper oxygen releasing/uptake temperature (depending on the application), high oxygen storage capacity, fast oxygen releasing/uptake kinetics, good reversibility, and outstanding mechanical strength during the oxygen release/uptake cycles.13,14The initial and most used OSMs are binary metal oxides with variable-valency transition metal elements, such as Fe2O315 and Mn2O3.16 However, under oxygen release and uptake cycles, binary oxides undergo extreme structural changes and sintering, thus leading to poor reversibility and mechanical strength.17 Perovskite oxides with transition metal elements (e.g., LaFeO3) can release/take up oxygen while undergoing minimal crystallographic changes because of their high tolerance of defects.2 This leaves perovskite oxides with improved reversibility and mechanical strength. The wide tunability of perovskite oxides facilitates the optimization of their properties as OSMs,1,3,8,18–20 even imparting new functionalities such as catalysis7via chemical modification.
However, other ternary metal oxides besides perovskites also show promise in the field of OSMs. The hexagonal layered oxide LnFe2O4, where Ln is a lanthanide cation, and related hexagonal AB2O4 materials have recently drawn attention as potential OSMs.21–23 The crystal structure of LnFe2O4, given in Fig. 1a, usually adopts R![[3 with combining macron]](https://www.rsc.org/images/entities/char_0033_0304.gif) m symmetry24 and consists of alternating layers of edge-sharing LnO6 octahedra and edge-sharing FeO5 trigonal bipyramids. The B site in the structure (Fe in this case) is typically a redox-active transition metal with a mixed valence of +2 and +3. The research interest in LnFe2O4 and related phases has long focused on their multiferroic properties.25–30 Both the A and B sites can contain elements with magnetic moments, enabling a magnetic response to an applied external field. The +2 and +3 charges on the B sites undergo charge ordering under certain conditions, leading to the appearance of an electric dipole in the structure (i.e. ferroelectric order). The arrangement of the magnetic A site into a triangular lattice also makes the structure a possible frustrated quantum spin liquid system,31–33 attracting researchers in the field of quantum materials.
m symmetry24 and consists of alternating layers of edge-sharing LnO6 octahedra and edge-sharing FeO5 trigonal bipyramids. The B site in the structure (Fe in this case) is typically a redox-active transition metal with a mixed valence of +2 and +3. The research interest in LnFe2O4 and related phases has long focused on their multiferroic properties.25–30 Both the A and B sites can contain elements with magnetic moments, enabling a magnetic response to an applied external field. The +2 and +3 charges on the B sites undergo charge ordering under certain conditions, leading to the appearance of an electric dipole in the structure (i.e. ferroelectric order). The arrangement of the magnetic A site into a triangular lattice also makes the structure a possible frustrated quantum spin liquid system,31–33 attracting researchers in the field of quantum materials.
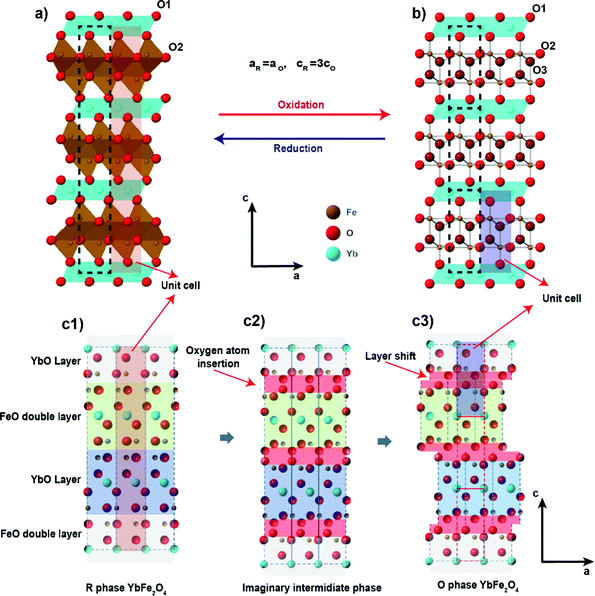 | ||
Fig. 1 The crystal structure of (a) R![[3 with combining macron]](https://www.rsc.org/images/entities/char_0033_0304.gif) m phase YbFe2O4 and (b) its oxidized P m phase YbFe2O4 and (b) its oxidized P![[3 with combining macron]](https://www.rsc.org/images/entities/char_0033_0304.gif) phase YbFe2O4.5 and (c) the structure relationship between YbFe2O4 and YbFe2O4.5. phase YbFe2O4.5 and (c) the structure relationship between YbFe2O4 and YbFe2O4.5. | ||
Although known for decades that oxygen non-stoichiometry in LnFe2O4 can tune its physical properties,34–37 not until recently, was it realized that LnFe2O4 can take up stoichiometric oxygen into its lattice to become LnFe2O4.5. This accommodation of extra lattice oxygen has the potential to be exploited for oxygen storage applications. Hervieu et al. first observed LuFe2O4 to be oxidized into the hyper-stoichiometric compound LuFe2O4.5 at a relatively low temperature (200 °C) in air.21 The oxidized phase exhibits a related crystal structure to the original R![[3 with combining macron]](https://www.rsc.org/images/entities/char_0033_0304.gif) m phase of LuFe2O4. Nicou et al. first determined the crystal structure of the oxidized phase by studying the oxidation of YbFe2O4 into YbFe2O4.5.22 The average crystal structure of the oxidized phase YbFe2O4.5, as solved by Nicoud et al., is presented in Fig. 1b. The new structure adopts trigonal space group P
m phase of LuFe2O4. Nicou et al. first determined the crystal structure of the oxidized phase by studying the oxidation of YbFe2O4 into YbFe2O4.5.22 The average crystal structure of the oxidized phase YbFe2O4.5, as solved by Nicoud et al., is presented in Fig. 1b. The new structure adopts trigonal space group P![[3 with combining macron]](https://www.rsc.org/images/entities/char_0033_0304.gif) while maintaining the layered arrangement of LnFe2O4. Our recent work on this system shows that the oxidized phase LnFe2O4.5 (for Ln = Y, In. Lu, Yb) can be reversibly reduced back to LnFe2O4 by H2 at 600 °C.23
while maintaining the layered arrangement of LnFe2O4. Our recent work on this system shows that the oxidized phase LnFe2O4.5 (for Ln = Y, In. Lu, Yb) can be reversibly reduced back to LnFe2O4 by H2 at 600 °C.23
As illustrated in Fig. 1c, the structural relationship between the reduced and oxidized phases of LnFe2O4 reveals interesting similarities. The slight structural rearrangement between LnFe2O4 and LnFe2O4.5 leads to high structural reversibility and mechanical strength during the oxidation/reduction cycles. The oxygen storage capacity of LnFe2O4 (2–3% mass ratio) is comparable to that of most known OSMs.21–23 More importantly, LnFe2O4 is highly tolerant towards chemical modifications, much like perovskite oxides. Both A site and B sites can be doped and substituted with abundant elements, bringing huge opportunities to improve their performance as OSMs by chemical modification. Our recent study has already shown that a change of A site elements in AFe2O4 can influence the kinetics of the oxidation and reduction during oxygen uptake/releasing cycles.23
Here, we conduct B site substitution on the YbFe2O4. We substitute up to 50% Mn on Fe sites to form a solid solution YbMnxFe2−xO4 (x = 0.25, 0.50, 0.75, and 1.0). We find that YbMnxFe2−xO4 readily oxidizes to hyper-stoichiometric YbMnxFe2−xO4.5. We study the influence of Mn substitution on the crystal structure, oxygen uptake behavior, and transition metal oxidation state. We perform cycling experiments on YbMnxFe2−xO4 in air and a practical fuel, methane. With in situ synchrotron X-ray powder diffraction (SXRD), we characterize the process by which oxygen is incorporated into the crystal lattice. Their structural reversibility reveals their potential as OSMs in applications in fuel combustion and conversion.
We detail the structures of YbMnxFe2−xO4 and YbMnxFe2−xO4.5 for the first time and observe the effects of B site substitution on lattice expansion. Briefly, Mn-substitution causes the a- and c-lattice parameters to converge upon incorporating more oxygen. We link such an interesting phenomenon to the change of the electron configuration of the B site element in the triangular bipyramid crystal field between the reduced and oxidized phases. Such lattice properties enable one to potentially engineer the volumetric change during oxidation/reduction cycling, which has practical value for avoiding mechanical failure of OSMs in a fixed-volume reactor.
2. Experiment
2.1 Materials synthesis
YbMnxFe2−xO4 (x = 1, 0.75, 0.5, and 0.25) series, labeled as the reduced phases or R-phases, were prepared using solid-state reactions. Yb2O3, Fe2O3, MnO, and Fe powder were ground in 1/2![[thin space (1/6-em)]](https://www.rsc.org/images/entities/char_2009.gif) :
:![[thin space (1/6-em)]](https://www.rsc.org/images/entities/char_2009.gif) 5/6
5/6![[thin space (1/6-em)]](https://www.rsc.org/images/entities/char_2009.gif) :
:![[thin space (1/6-em)]](https://www.rsc.org/images/entities/char_2009.gif) (5/3)x
(5/3)x![[thin space (1/6-em)]](https://www.rsc.org/images/entities/char_2009.gif) :
:![[thin space (1/6-em)]](https://www.rsc.org/images/entities/char_2009.gif) 1/3(1−x) ratio (x refers to YbMnxFe2−xO4), respectively, to prepare 0.5 g of the target compound. The powder mixtures were pressed into pellets of 13 mm diameter. The grinding and pelletization were performed in a glove box to prevent the oxidation of Fe powder. The pellets were placed in a 2 mL alumina crucible and sealed inside evacuated 8 mm diameter quartz ampoules. The ampoules were flushed with N2 gas and evacuated several times to obtain the required oxygen partial pressure for successful synthesis. Typical synthesis of LnFe2O4 requires PO2 below 10−7 Torr (∼1.3 × 10⁻¹⁰ atm).38 In our synthesis, the vacuum line we used can reach around 3 × 10⁻³ Torr (∼4 × 10⁻⁶ atm) pressure. In order to achieve PO2 below 10−7 Torr from atmospheric air, N2 flushing was performed 8–10 times. The samples were sintered at 1180 °C (heating rate 10 °C min−1) for 12 hours and then quenched with ice water. The AB2O4 phase is metastable at high temperatures, so we must quench the samples to kinetically trap this phase. Quenching limits the formation of impurities. The elemental ratio of the product was verified with ICP and SEM-EDS. To prepare the oxidized phases, YbMnxFe2−xO4.5, for ex situ studies, the as-synthesized samples were oxidized at 600 °C (heating rate 10 °C min−1) in air for 12 h and cooled to room temperature. These samples were labeled as oxidized phases, or O-phases.
1/3(1−x) ratio (x refers to YbMnxFe2−xO4), respectively, to prepare 0.5 g of the target compound. The powder mixtures were pressed into pellets of 13 mm diameter. The grinding and pelletization were performed in a glove box to prevent the oxidation of Fe powder. The pellets were placed in a 2 mL alumina crucible and sealed inside evacuated 8 mm diameter quartz ampoules. The ampoules were flushed with N2 gas and evacuated several times to obtain the required oxygen partial pressure for successful synthesis. Typical synthesis of LnFe2O4 requires PO2 below 10−7 Torr (∼1.3 × 10⁻¹⁰ atm).38 In our synthesis, the vacuum line we used can reach around 3 × 10⁻³ Torr (∼4 × 10⁻⁶ atm) pressure. In order to achieve PO2 below 10−7 Torr from atmospheric air, N2 flushing was performed 8–10 times. The samples were sintered at 1180 °C (heating rate 10 °C min−1) for 12 hours and then quenched with ice water. The AB2O4 phase is metastable at high temperatures, so we must quench the samples to kinetically trap this phase. Quenching limits the formation of impurities. The elemental ratio of the product was verified with ICP and SEM-EDS. To prepare the oxidized phases, YbMnxFe2−xO4.5, for ex situ studies, the as-synthesized samples were oxidized at 600 °C (heating rate 10 °C min−1) in air for 12 h and cooled to room temperature. These samples were labeled as oxidized phases, or O-phases.
2.2 High resolution synchrotron XRD
YbMnxFe2−xO4 series as well as their oxidized phases YbMnxFe2−xO4.5 were characterized by high-resolution synchrotron X-ray powder diffraction (SXPD). The experiments were performed on the 11-BM beamline at the Advanced Photon Source (APS) at Argonne National Laboratory. X-rays were of wavelength 0.457895 Å. To compare with the SXPD patterns, we also took time-of-flight (TOF) neutron diffraction patterns for the reduced phases YbMnxFe2−xO4. The TOF patterns were collected on the BL-11A POWGEN beam line at the Spallation Neutron Source (Oak Ridge National Laboratory). Powder patterns were collected at ambient temperature and pressure, and Rietveld analysis was carried out using TOPAS 539 and GSASii.402.3 Thermogravimetric analysis (TGA)
TGA was conducted on reduced phase YbMnxFe2-xO4 (x = 1, 0.75, 0.5, 0.25) series using an SDT Q600 equipped with a TA Discovery MKS104-S0212004 Micron Vision 2 Mass Spectrometer. 5–10 mg sample was used for each measurement. The samples were heated to 800 °C (ramping rate 10 °C min−1) in air, holding at every 100 °C for 10 minutes. TGA measurements with isotherm heating were also performed. Around 10 mg samples were heated to 350 °C (ramping rate 10 °C min−1) in air and the temperature was held for 6 hours.2.4 In situ synchrotron X-ray diffraction upon heating and cycling with CH4 and air
We performed in situ SXRD experiments (transmission geometry) on YbMnxFe2−xO4 series (x = 1, 0.75, 0.5, and 0.25) on the 17-BM beamline at the Advanced Photon Source (Argonne National Laboratory). A 2D PerkinElmer a-Si flat panel detector was used with an average wavelength of 0.24108 Å. Two types of experiments were carried out. First, we ramped the temperature of the sample environment up to 700 °C in air, holding at every 100 °C for 10 minutes to determine when YbMnxFe2−xO4 starts to be oxidized. Second, we performed cycling experiments by switching the atmosphere between air and methane (CH4) to mimic a practical chemical combustion looping reactor. The samples were heated to 600 °C in He and held at 600 °C while cycling between the two atmospheres (air and methane). A flow-cell/furnace sample holder was used to control the sample temperature and atmosphere.41 The diffraction patterns were collected every 6s during both processes. Due to the limited beam time, we were not able to collect the cycling data for YbMnxFe2−xO4 (x = 0.5). Automated sequential Rietveld refinements were performed using TOPAS 5.39 In the sequential refinement, the position and occupancy of each atom were fixed for simplicity. We monitored the change of lattice parameters as well as the phase fractions. YbMnFeO4 powder samples were characterized by SEM and EDS before and after cycling.2.5 Valence state determination from X-ray photoelectron spectroscopy (XPS) and X-ray absorption near edge structure (XANES)
Both the reduced YbMnxFe2−xO4 series and oxidized counterparts were examined by XPS. XPS spectra were collected using a Kratos Axis 165 X-ray photoelectron spectrometer operating in hybrid mode using Al Kα monochromatic X-rays at 280 W. O 1s, Fe 2p, Mn 2p and Yb 4d regions were examined. All XPS spectra were calibrated to the C1s peak at 284.80 eV. All spectra fittings were performed using CasaXPS. Shirley background was used for background subtraction. 30% Gaussian + 70% Lorentzian is applied as the fitted peak shape profile. To further determine the oxidation state of Fe, we performed XANES measurements on YbMn0.25Fe1.5O4 and its oxidized phase. Iron K-edge X-ray absorption spectra were collected at beamline 9-BM at the Advanced Photon Source (APS) at Argonne National Laboratory. Measurements were performed in transmission geometry using gas filled ion chambers as detectors on powder samples diluted with boron nitride and pressed into pellets.3. Results and discussion
3.1 Crystal structure and incommensurate modulation
Room temperature SXRD patterns of the R-phase YbMnxFe2−xO4 (for x = 1) as well as the Rietveld fits to the structures are shown in Fig. 2a. The SXRD patterns of other R-phases YbMnxFe2−xO4 (x = 0.75, 0.5, and 0.25) are presented in the ESI† (Fig. S1a–S3a). The refined parameters are shown in Table S1 (ESI†). All the samples are nearly phase pure with minor impurities of Yb2O3(<1%). YbMnO3 (2.3%) and Yb2Fe3O7 (1.9%) are also observed in the YbMn0.75Fe1.25O4 (x = 0.75) sample. All structures for YbMnxFe2−xO4 (x = 1, 0.75, 0.5, and 0.25) are well modeled by the parent structure of YbFe2O4 (R![[3 with combining macron]](https://www.rsc.org/images/entities/char_0033_0304.gif) m symmetry, Fig. 1a). The observation that Mn substitution on the B-site preserves crystal structure YbFe2O4 is consistent with the previous reports.27
m symmetry, Fig. 1a). The observation that Mn substitution on the B-site preserves crystal structure YbFe2O4 is consistent with the previous reports.27
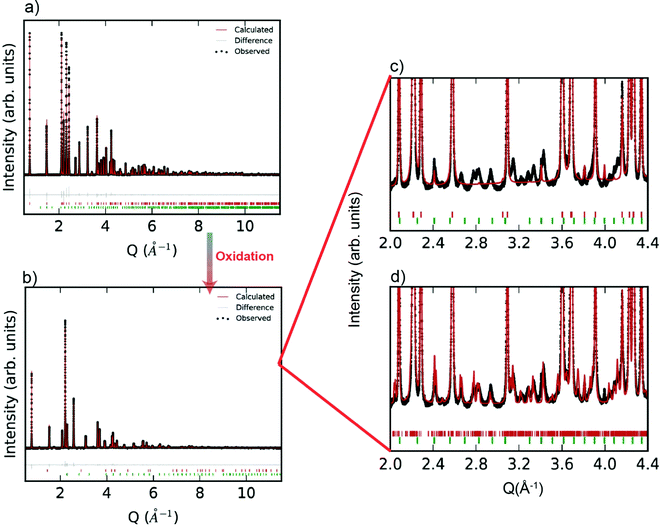
After complete oxidation, the O-phases of YbMnxFe2−xO4.5 can be obtained. The SXRD pattern of YbMnxFe2−xO4.5 (x = 1) is displayed in Fig. 2b, and those of the other YbMnxFe2−xO4.5 (x = 0.75, 0.5, and 0.25) phases are presented in Figure S1b–S3b (ESI†). In all cases, we observed a crystallographic transition upon oxidation for the SXRD patterns of YbMnxFe2−xO4.5 (x = 1, 0.75, 0.5, and 0.25) and we successfully fitted the major Bragg peaks with the P![[3 with combining macron]](https://www.rsc.org/images/entities/char_0033_0304.gif) symmetry model, which is reported to be the average crystal structure of unsubstituted YbFe2O4.522,23 (Fig. 1b). The final refined structural and lattice parameters are shown in Table S2 (ESI†). The oxygen insertion/uptake in the structure occurs in the Mn/FeO layers, where the O2 and O3 sites are located (Fig. 1c). Thus, the O1 occupancy is fixed to unity and only the occupancies of O2 and O3 are refined. The total occupancies of O2 and O3 are constrained to be 1.25 during refinement to satisfy the oxygen stoichiometry in YbMnxFe2−xO4.5, according to Nicoud et al.22 It is worth noting that besides the major Bragg peaks, we also found an abundance of satellite peaks in all SXRD patterns of the oxidized phases. These satellite peaks are broadly similar for the different samples and cannot be refined with the average P
symmetry model, which is reported to be the average crystal structure of unsubstituted YbFe2O4.522,23 (Fig. 1b). The final refined structural and lattice parameters are shown in Table S2 (ESI†). The oxygen insertion/uptake in the structure occurs in the Mn/FeO layers, where the O2 and O3 sites are located (Fig. 1c). Thus, the O1 occupancy is fixed to unity and only the occupancies of O2 and O3 are refined. The total occupancies of O2 and O3 are constrained to be 1.25 during refinement to satisfy the oxygen stoichiometry in YbMnxFe2−xO4.5, according to Nicoud et al.22 It is worth noting that besides the major Bragg peaks, we also found an abundance of satellite peaks in all SXRD patterns of the oxidized phases. These satellite peaks are broadly similar for the different samples and cannot be refined with the average P![[3 with combining macron]](https://www.rsc.org/images/entities/char_0033_0304.gif) model (Fig. 2c).
model (Fig. 2c).
Nicoud et al.22 reported a modulated, incommensurate pattern in YbFe2O4.5, which they were able to index and fit by creating a supercell model. By applying a similar superspace group approach, we were able to fit the satellite peaks of the XRD patterns and observe a decrease of the Rwp (Fig. 2d). The modulation parameters are listed in Table S4 (ESI†). A superspace group of P![[1 with combining macron]](https://www.rsc.org/images/entities/char_0031_0304.gif) (abg)0 and a nearly identical k-vector of (0.141, 0.28, and 0.01) were used for the refinements of all YbMnxFe2−xO4.5 structures. The incommensurate nature of YbMnxFe2−xO4.5 is therefore intrinsic to this system and not a function of the amount of Mn substitution. The incommensurate nature found in YbMnxFe2−xO4.5 may be the result of cation ordering between Fe/Mn. However, Nicoud, S. et al. observed similar satellite peaks on the diffraction patterns of YbFe2O4.5 where only Fe exists on the B sites. We conclude that cation ordering is unlikely. Charge ordering is also reported to lead to incommensurate structures in metal oxides. Indeed, charge ordering was extensively studied in LnFe2O4, but usually appears at a relatively low temperature.25–30 However, charge ordering does not occur at the temperatures of interest in this study, and there is no possibility of charge order in the fully oxidized phases. Nicoud, S. et al. mentioned a possible origin of the incommensurate structure of YbFe2O4.5 deriving from the coexistence of FeO4, FeO5, and FeO6 polyhedra within the (FeO)2 block. Although the average crystal structure shows that Fe atoms are surrounded by 8 closest oxygen atoms, Fe Mössbauer verified the coexistence of FeO4, FeO5, and FeO6 coordination in LnFe2O4.5 systems.22,34 Based on the fact that Mn substituted series YbMnxFe2−xO4.5 show the same crystal symmetry, and that FeO4, FeO5, and FeO6 polyhedra were also identified in the LnMnFeO4.5 (x = 1),42 we believe that the coexistence of (Fe, Mn)O4, (Fe, Mn)O5, and (Fe, Mn)O6 polyhedra also likely occur in the Mn-substituted series.
(abg)0 and a nearly identical k-vector of (0.141, 0.28, and 0.01) were used for the refinements of all YbMnxFe2−xO4.5 structures. The incommensurate nature of YbMnxFe2−xO4.5 is therefore intrinsic to this system and not a function of the amount of Mn substitution. The incommensurate nature found in YbMnxFe2−xO4.5 may be the result of cation ordering between Fe/Mn. However, Nicoud, S. et al. observed similar satellite peaks on the diffraction patterns of YbFe2O4.5 where only Fe exists on the B sites. We conclude that cation ordering is unlikely. Charge ordering is also reported to lead to incommensurate structures in metal oxides. Indeed, charge ordering was extensively studied in LnFe2O4, but usually appears at a relatively low temperature.25–30 However, charge ordering does not occur at the temperatures of interest in this study, and there is no possibility of charge order in the fully oxidized phases. Nicoud, S. et al. mentioned a possible origin of the incommensurate structure of YbFe2O4.5 deriving from the coexistence of FeO4, FeO5, and FeO6 polyhedra within the (FeO)2 block. Although the average crystal structure shows that Fe atoms are surrounded by 8 closest oxygen atoms, Fe Mössbauer verified the coexistence of FeO4, FeO5, and FeO6 coordination in LnFe2O4.5 systems.22,34 Based on the fact that Mn substituted series YbMnxFe2−xO4.5 show the same crystal symmetry, and that FeO4, FeO5, and FeO6 polyhedra were also identified in the LnMnFeO4.5 (x = 1),42 we believe that the coexistence of (Fe, Mn)O4, (Fe, Mn)O5, and (Fe, Mn)O6 polyhedra also likely occur in the Mn-substituted series.
Another possible origin for the incommensurate modulation is oxygen vacancy ordering within the [(Fe, Mn)O]2 layer. As shown in Table S2 (ESI†), the oxygen sites O2 and O3 are partially occupied. As presented within the average crystal structure, the distance between the O2 and O3 positions (Fig. 1b) is 2.06–2.14 Å (listed in Table S3, ESI†), which is far below twice the radius of O2− (2.42–2.56 Å).43,44 Coexistence of O2 and O3 in the same unit cell would imply a highly unstable O–O species in YbMnxFe2−xO4.5, which is unlikely since we observe this phase to be air and water stable at room temperature. Thus, we believe that there is vacancy ordering at the O2 and O3 sites to avoid simultaneous occupation of the O2 and O3 positions. Alternate occupancy of the O2 or O3 positions in one unit cell is consistent with evidence that a Fe/MnO8 polyhedron is highly unlikely in YbMnxFe2−xO4.5.
3.2 Transition metal oxidation states in the R-phases and O-phases
The transition from YbMnxFe2−xO4 to YbMnxFe2−xO4.5 involves oxidation of the transition metals. The reduced parent phase YbFe2O4 is reported to contain 1![[thin space (1/6-em)]](https://www.rsc.org/images/entities/char_2009.gif) :
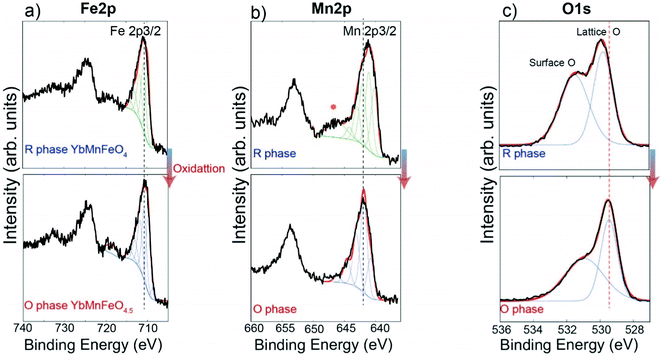
:![[thin space (1/6-em)]](https://www.rsc.org/images/entities/char_2009.gif) 1 ratio of Fe3+ and Fe2+.22,27 The transition from YbFe2O4 to YbFe2O4.5 is accompanied by the full conversion of Fe2+ to Fe3+.22 For the reduced phase, YbMnFeO4 (x = 1) is proved to contain Fe3+ and Mn2+.27,45,46Fig. 3 compares the Fe 2p, Mn 2p, O 1s XPS spectra of YbMnFeO4 (x = 1) to those of the oxidized phase YbMnFeO4.5. The Mn 2p3/2 spectra are strictly fitted following the protocols previously reported,47 as is presented in Fig. 3b (top). For the reduced phase YbMnFeO4, the Mn 2p3/2 spectrum is fit satisfactorily with the Mn2+ profile. A satellite peak around 646 eV is also characteristic of Mn2+. After oxidation to the O-phase of YbMnFeO4.5, we observe a shift of the Mn 2p3/2 to a higher binding energy and the disappearance of the satellite peak (Fig. 3b bottom). The Mn3+ profile can fit the Mn 2p3/2 spectrum well; we thus conclude that the transition of YbMnFeO4 to YbMnFeO4.5 involves the oxidation of Mn2+ to Mn3+. The Mn 2p XPS spectra for the rest of the series (x = 0.75, 0.5, and 0.25) are presented in Fig. S5 (ESI†). The oxidation of Mn2+ to Mn3+ is always observed for the transition from YbMnxFe2−xO4 to YbMnxFe2−xO4.5.
1 ratio of Fe3+ and Fe2+.22,27 The transition from YbFe2O4 to YbFe2O4.5 is accompanied by the full conversion of Fe2+ to Fe3+.22 For the reduced phase, YbMnFeO4 (x = 1) is proved to contain Fe3+ and Mn2+.27,45,46Fig. 3 compares the Fe 2p, Mn 2p, O 1s XPS spectra of YbMnFeO4 (x = 1) to those of the oxidized phase YbMnFeO4.5. The Mn 2p3/2 spectra are strictly fitted following the protocols previously reported,47 as is presented in Fig. 3b (top). For the reduced phase YbMnFeO4, the Mn 2p3/2 spectrum is fit satisfactorily with the Mn2+ profile. A satellite peak around 646 eV is also characteristic of Mn2+. After oxidation to the O-phase of YbMnFeO4.5, we observe a shift of the Mn 2p3/2 to a higher binding energy and the disappearance of the satellite peak (Fig. 3b bottom). The Mn3+ profile can fit the Mn 2p3/2 spectrum well; we thus conclude that the transition of YbMnFeO4 to YbMnFeO4.5 involves the oxidation of Mn2+ to Mn3+. The Mn 2p XPS spectra for the rest of the series (x = 0.75, 0.5, and 0.25) are presented in Fig. S5 (ESI†). The oxidation of Mn2+ to Mn3+ is always observed for the transition from YbMnxFe2−xO4 to YbMnxFe2−xO4.5.
For the Fe 2p3/2 spectra of YbMnFeO4 (x = 1) and YbMnFeO4.5, which is presented in Fig. 3a, nearly identical spectra were observed for both reduced and oxidized phases, which can be fitted with the Fe3+ profile.48 It seems to indicate that Fe adopts +3 valence state in both YbMnFeO4 and its oxidized phase YbMnFeO4.5. It is unsurprising that reduced phase YbMnFeO4 consists of Fe3+ and Mn2+ instead of Fe2+ and Mn3+, given the stable d5 configuration of Fe3+ and Mn2+ cations. A previous magnetic susceptibility study on YFeMnO4 and YbMnFeO4 also indicates the existence of Fe3+ and Mn2+.27,49
The Fe 2p spectra for the rest of the series (x = 0.75, 0.5, and 0.25) are presented in Fig. S4 (ESI†). Theoretically, a mixed Fe3+/Fe2+ should exist in the R-phase for bulk samples as long as the Mn substitution ratio is smaller than 1 (i.e. x < 1) to satisfy charge balancing rules since Mn element exists in the form of Mn2+. However, upon oxidation to form an O-phase, Fe will only exist in the form of Fe3+, similar to what is reported for YbFe2O4/YbFe2O4.5,22 where the valence state of Fe is determined by Mössbauer spectroscopy. Surprisingly, in our XPS measurement, the shape of the Fe spectra remains nearly identical for all the samples before and after oxidation. The determination of the valence state of Fe with XPS still remains challenging as Fe3+ and Fe2+ spectra heavily overlap. Generally, there should be a characteristic peak around 710 eV for Fe2+ 2p spectra,48 which we did not observe in the R-phase and O-phase. The shape of the Fe 2p3/2 spectra for both R-phase and O-phase seems to fit with the Fe3+ profile, same as the case for YbMnFeO4 to YbMnFeO4.5. While we did observe a very slight red shift after oxidation, such a shift does not correspond to the transition from Fe2+ to Fe3+ (blue shift should be expected) and is very likely caused by the charge compensation due to the different conductivities between the R-phase and O phase.50,51 The oxidation of Fe2+ to Fe3+ on the surface in an ambient environment is a common phenomenon for Fe2+ containing materials.48 Since XPS is a surface-sensitive characterization method, we suspect that the Fe2+ on the surface of the R-phase YbMnxFe2−xO4 (x < 1) oxidizes to Fe3+ due to its instability upon exposure to air.
Apparently XPS here is not suitable for the determination of the valence state of Fe. To prove that mixed Fe2+/Fe3+ transforms into Fe3+ upon oxidation of YbMnxFe2−xO4 into YbMnxFe2−xO4.5, we picked YbMn0.25Fe1.75O4 and YbMn0.25Fe1.75O4.5 (x = 0.25) to perform X-ray absorption near edge structure (XANES) measurements. Fig. 4 depicts the XANES spectra of the reduced and oxidized phases (x = 0.25) overlapped with Fe-standards with different oxidation states. As illustrated, the absorption edge of the reduced phase lies in between that of FeO and Fe2O3 while the absorption edge of the fully oxidized phase overlaps with that of Fe2O3. This confirms that the reduced phase has both Fe2+ and Fe3+ while the oxidized phase only has Fe3+ ions.
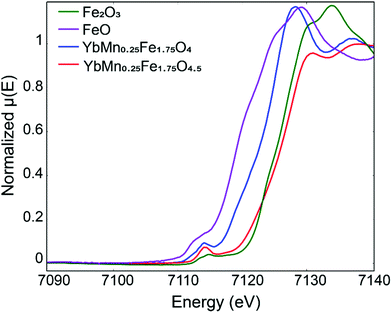 | ||
| Fig. 4 Fe X-ray absorption near edge structure (XANE) of YbMn0.25Fe1.75O4 and YbMn0.25Fe1.75O4.5 in comparison with Fe2O3 and FeO reference. | ||
Interestingly, we also observe that the binding energy of lattice oxygen systematically shifts to a lower energy from the R-phase to O-phase in the O 1s spectra, as shown in Fig. 3c and Fig. S6 (ESI†). Generally, the lower the binding energy of the oxygen atoms, the more ionic and “free” the oxygen will be in the lattice.52 This observation implies that the overall oxygen atoms (or anions) in the O-phase YbMnxFe2−xO4.5 may more easily migrate compared to those in the R-phase due to their more ionic nature. This heightened mobility may be attributed to the partial occupation of O2 and O3 sites in the O phase.53–55 Further studies on ionic conductivity need to be conducted to verify such a hypothesis.
3.3 Oxygen uptake and structure transitions at high temperatures
Characteristic TGA curves in air up to 800 °C, given in Fig. 5, show that the maximum weight gains in YbMnxFe2−xO4 (x = 1, 0.75, 0.5, and 0.25) are within the range of 2–3% (error of 0.5%), which corresponds closely to the theoretical oxygen uptake from YbMnxFe2−xO4 to YbMnxFe2−xO4.5 (around 2.2% gain for all samples). The TGA curves measured with isotherm heating at 350 °C are displayed in Fig. S7 (ESI†). All samples show around 2.5% mass gains. The theoretical and the measured oxygen storage capacity for each composition are listed in Table S5 (ESI†). The mass gain remains stable after the samples are cooled to room temperature. All the samples start to gain mass when the temperature reaches 200 °C with negligible variances (as shown in Fig. 5 and Fig. S7, ESI†), consistent with what is reported for other LnFe2O4 materials.22,23,37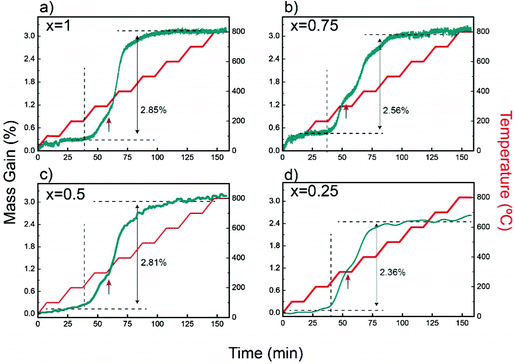 | ||
| Fig. 5 Thermogravimetric analysis (TGA) depicting the weight change as a function of time and temperature for R-phases YbMnxFe2−xO4 in air. | ||
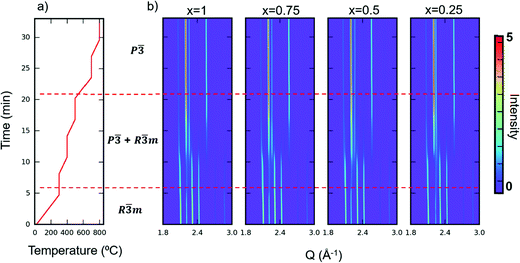
Apart from TGA, we also performed in situ SXRD with the same heating profile as in our TGA measurement in air. We then performed sequential Rietveld refinement on the time-resolved patterns. The in situ patterns are shown in Fig. 6. The refined phase composition and lattice parameters versus time are displayed in Fig. S8–S11 (ESI†). A clear oxidized phase appears at around 300 °C for all the samples. The kinks at 300 °C shown in TGA curves (Fig. 5) also confirm a phase transition at that temperature. The temperature where new phase appears (300 °C) differs from the temperature where the materials start to gain mass (200 °C), indicating that YbMnxFe2−xO4 series can tolerate some oxygen uptake (around 0.9%) while maintaining its R![[3 with combining macron]](https://www.rsc.org/images/entities/char_0033_0304.gif) m structure. The oxygen non-stoichiometry of LnFe2O4+δ as the reduced phase (R
m structure. The oxygen non-stoichiometry of LnFe2O4+δ as the reduced phase (R![[3 with combining macron]](https://www.rsc.org/images/entities/char_0033_0304.gif) m) has been previously reported and studied.21,35 In addition, as the time-resolved XRD patterns and refinements show, the phase fraction changes over time, even when the temperature remains constant. Such behavior indicates: (1) the phase transition from the R-phases to O phases is not merely driven by the temperature, and (2) kinetics limits the extent of the observed structural transition, possibly by oxygen diffusion into the lattice.
m) has been previously reported and studied.21,35 In addition, as the time-resolved XRD patterns and refinements show, the phase fraction changes over time, even when the temperature remains constant. Such behavior indicates: (1) the phase transition from the R-phases to O phases is not merely driven by the temperature, and (2) kinetics limits the extent of the observed structural transition, possibly by oxygen diffusion into the lattice.
The TGA and in situ heating diffraction measurements imply that the Mn substitution does not have a significant influence on the oxygen uptake and phase transition kinetics, as the oxygen uptake temperature and phase transition temperature for the whole series appear at nearly identical temperatures (200 °C). No significant difference of oxygen uptake kinetics is observed among different Mn substitution levels, as the mass gain saturates at roughly similar temperatures in the isotherm heating measurement (Fig. S7, ESI†).
3.4 Reversible structural evolution during oxygen uptake and release
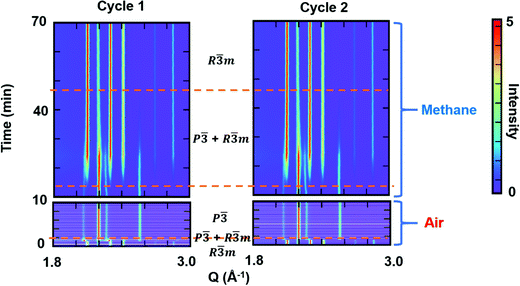
To examine the reversibility of YbMnxFe2−xO4 as an oxygen storage material, we performed cycling experiments under oxidizing (air) and reducing (methane) atmospheres. The R-phase samples YbMnxFe2−xO4 (x = 1,0.75.0.25) were first heated to 600 °C in helium before switching the atmospheres at the same temperature. YbMnxFe2−xO4 retains the R![[3 with combining macron]](https://www.rsc.org/images/entities/char_0033_0304.gif) m structure during the heating in helium, as shown in Fig. S12a (ESI†). For the cycling experiment, the in situ time resolved SXRD contour plot of YbMnFeO4 (x = 1) is presented in Fig. 7. The R-phase (R
m structure during the heating in helium, as shown in Fig. S12a (ESI†). For the cycling experiment, the in situ time resolved SXRD contour plot of YbMnFeO4 (x = 1) is presented in Fig. 7. The R-phase (R![[3 with combining macron]](https://www.rsc.org/images/entities/char_0033_0304.gif) m) quickly transitions to the O-phase (P
m) quickly transitions to the O-phase (P![[3 with combining macron]](https://www.rsc.org/images/entities/char_0033_0304.gif) ) upon exposure to air. The satellite peaks are still visible in this condition (Fig. S12b, ESI†), implying the stability of the modulated structure in the O-phase. The existence of the satellite peaks in the diffraction patterns also supports that it is not caused by charge ordering as this phenomenon generally appears at relatively low temperatures. Under methane, we observe a much slower transition from the O-phase back to the R-phase. A mixture of phases is visible for a long period under methane before the O-phase finally disappears. Two cycles of experiments were performed, and nearly identical structural evolutions are observed. No obvious new phases are detected and the XRD pattern at the end of cycles is nearly unchanged (Fig. S12c, ESI†), indicating good structural stability and cyclability.
) upon exposure to air. The satellite peaks are still visible in this condition (Fig. S12b, ESI†), implying the stability of the modulated structure in the O-phase. The existence of the satellite peaks in the diffraction patterns also supports that it is not caused by charge ordering as this phenomenon generally appears at relatively low temperatures. Under methane, we observe a much slower transition from the O-phase back to the R-phase. A mixture of phases is visible for a long period under methane before the O-phase finally disappears. Two cycles of experiments were performed, and nearly identical structural evolutions are observed. No obvious new phases are detected and the XRD pattern at the end of cycles is nearly unchanged (Fig. S12c, ESI†), indicating good structural stability and cyclability.
We performed sequential refinements on the diffraction patterns throughout two cycles and extracted phase fractions and lattice parameters. The plot of refined phase fractions for the first cycle, given in Fig. 8a, and for two cycles, shown in Fig. S16 (ESI†), clearly show that both transitions (R → O in air and O → R in methane) are gradual processes, though the oxidation displays much faster kinetics. Fig. S13 (ESI†) plots the refined crystal grain size change in the first oxidation–reduction cycle. It is clear that, during both oxidation and reduction, as the phase fraction changes, the crystal grain size also changes according to whether the phase is growing or contracting. As mentioned earlier, the reaction kinetics may be limited by oxygen ion diffusion into the lattice, such that both oxidation and reduction first occur on the surface and then proceeds to the bulk. Such a mechanism leads to cycling between the growth and contraction of the crystalline size. After the reduction/oxidation cycle the refined crystal size remains nearly unchanged, implying the non-sintering nature of the materials during the cycling. SEM images are also taken before and after the cycling, which is presented in Fig. S14 (ESI†), and no obvious particle size or shape change is observed. EDS elemental mapping (Fig. S15, ESI†) shows that Yb, Mn and Fe are homogenously distributed within the particles before and after the cycling, implying no elemental separation during the cycling and good cycle stability.
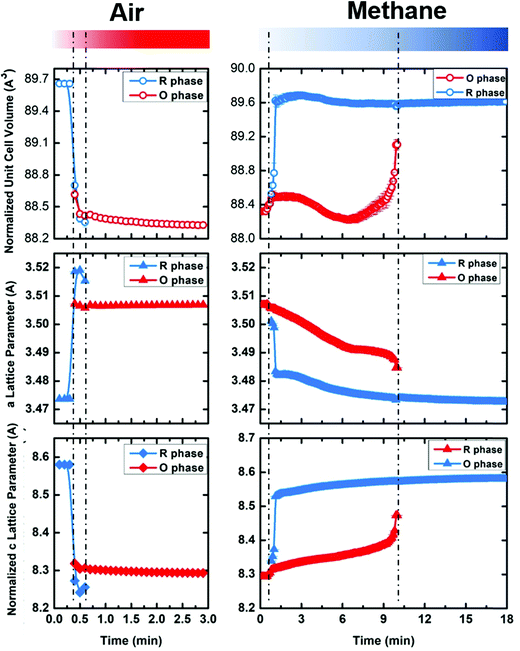 | ||
| Fig. 8 The evolution of crystal cell volume, a lattice parameter and c lattice parameter as a function of time during cycling between oxidizing (air) and reducing (methane) atmospheres at 600 °C for YbMnFeO4 (x = 1). Note that one unit cell of R-phase corresponds to 3 vertical stacked unit cells of O phase (shown in Fig. 1). Thus, the normalized cell volume and c lattice parameter of the R-phase are used for comparison (1/3 of actual number). The data at 600 °C are extracted from the sequential Rietveld refinement of in-situ synchrotron X-ray diffraction patterns (Fig. 7). | ||
Fig. 8b–d present the refined lattice parameters (unit cell volume, a and c). The transition from the R-phase to O-phase is accompanied by the crystal volume contraction, with elongation in the a-direction and contraction in the c-direction. We discuss the lattice parameter differences between the R-phase and O-phase in more detail in the next section. Another interesting phenomenon is that the lattice parameters for both phases gradually change during cycling. During oxidation of the R-phase, the a-lattice parameter grows while the c-lattice parameter contracts. During reduction of the O-phase, the opposite occurs. These trends hold before the phase transitions and afterwards during the mixed phase stage. Such lattice parameter changes cannot be attributed to thermal expansion or contraction since the cycling experiments are held at a constant temperature. Thus, it implies that both the R-phase and O-phase can tolerate oxygen non-stoichiometry before phase transitions occur. The R-phase, as is discussed previously, can tolerate some oxygen uptake (around 0.9%) maintaining its rhombohedral structure. The same appears to be true for the O-phase, which can release oxygen from its lattice while keeping its P![[3 with combining macron]](https://www.rsc.org/images/entities/char_0033_0304.gif) phase. Due to the very fast material evolution in the cycling and the relative insensitivity of X-rays for oxygen (compared to the metal sites), we were not able to obtain the critical oxygen occupancies for either the R-phases (R
phase. Due to the very fast material evolution in the cycling and the relative insensitivity of X-rays for oxygen (compared to the metal sites), we were not able to obtain the critical oxygen occupancies for either the R-phases (R![[3 with combining macron]](https://www.rsc.org/images/entities/char_0033_0304.gif) m) or O-phases (P
m) or O-phases (P![[3 with combining macron]](https://www.rsc.org/images/entities/char_0033_0304.gif) ).
).
Other YbMnxFe2−xO4 samples (x = 0.75 and 0.25) exhibit similar behavior during the cycling experiments, as displayed in Fig. S17 and S18 (ESI†). The R-phases for both samples cannot be totally converted to the O-phase during the given air exposure time, which is possibly due to the powder packing issue in SXRD quartz tube cells. Nevertheless, both samples undergo reversible structural transitions during switching atmospheres, as the XRD patterns remain nearly identical at the beginning and at the end of the cycles. Our in situ cycling experiments show that Mn substitution does not have a significant impact on the oxygen uptake/release reversibility of YbFe2O4.
3.5 Crystal field effects on lattice volume expansion and contraction
As a potential oxygen storage material, the volume change before and after oxygen release/uptake is a key metric. Large volume expansion and contraction of the material during the cycling can lead to severe mechanical failure of the containers or reactors.56 Thus, understanding the crystal lattice changes between the reduced phase and oxidized phase is of practical relevance. The relative values of the lattice parameters of the R-phase and O-phase are shown in Fig. 9 at room temperature (Fig. 9a–c) and 600 °C (Fig. 9d–f). All the values for the same lattice parameters are normalized with the corresponding value of the R-phase YbMnFeO4 (x = 1) at room temperature. Data at room temperature are extracted from the refinement of high-resolution SXRD, while the data at 600 °C are extracted from the refinement of in situ SXRD during the cycling experiment. We also included the lattice parameters for YbFe2O4 and YbFe2O4.5 reported elsewhere22,23 for comparison.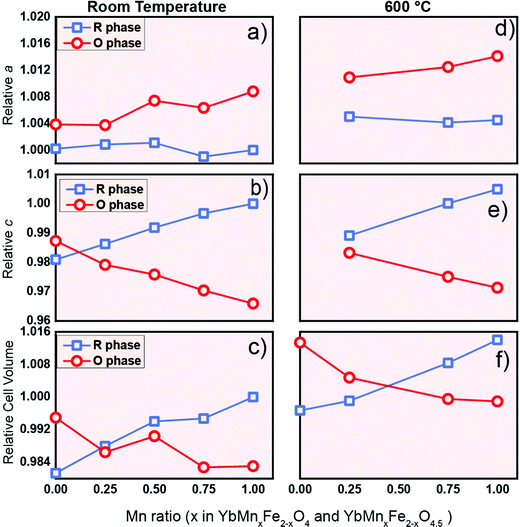 | ||
| Fig. 9 The Influence of Mn substitution on the lattice parameter a, lattice parameter c and cell volume of R-phase YbMnxFe2−xO4 (blue) and the O phase YbMnxFe2-xO4.5 (red) at room temperature (a–c) and 600 °C (d–f). The lattice parameters are normalized. The lattice parameters of R-phase YbMnFeO4 (x = 1) are chosen as references (set as 1). Data for x = 0 (YbFe2O4 and YbFe2O4.5) from the literature are displayed for comparison.22,23a and c lattice parameters at 600 °C are not listed as the author in the previous literature did not indicate what they were. | ||
Two interesting trends are worth noting: (1) anisotropic lattice expansion upon oxygen uptake and (2) crystal field effects upon Mn-substitution. For the first trend, we found that all the R-phases take up oxygen into the lattice, and its effect on the a- and c-lattice parameters occurs in a diametric fashion. Typically, in metal oxides, the attraction between ions is isotropic. For example, the lattice expansion due to the removal of cations from the lattice is commonly reported in the fluorite and perovskite systems.57,58 In the present series, such lattice expansion is strongly anisotropic. Upon oxidation, if only change of the ionic radius (from Fe2+ to Fe3+, and from Mn2+ to Mn3+) is taken into consideration, an isotropic expansion should be observed. From the R-phase to O-phase, the a-lattice parameter undergoes an expansion while the c-lattice parameter significantly contracts. This trend is consistent with the previous study on the LnFe2O422,23 and applies at room temperature as well as at 600 °C. The diametric evolution of the lattice parameters is the result of the crystal structure adjusting to oxygen insertion. As shown in Fig. 1c during the oxidation of the R-phase, oxygen ions insert into the middle of the Fe/MnO double layer; at the same time, the individual Fe/MnO layers shift in opposite directions along the ab-plane due to the Coulombic repulsion between oxygen anions. The crowded oxygen ions in the ab-direction result in an increased repulsion between each oxygen ion, leading to the expansion of the a-parameter.
In the c-direction, we observe a contraction because the radius of the Fe3+/Mn3+ ion in the oxidized phase is smaller than that of the Fe2+/Mn2+ ion in the reduced phase,44,59 and the extra oxygen ions give rise to the extra attractive force between the oxygen anions and the closest Mn/Fe cations. At room temperature, the degree of the contraction of the c-lattice parameter is much larger than the expansion in the a-direction. The normalized crystal cell volume of the R-phase is therefore always larger than that of the O-phase (Fig. 9c), consistent with the c-lattice parameter trend. At a certain point of Mn-substitution, however, we observe that the unit cell volume values intersect at 600 °C (Fig. 9f). This crossover point implies that the amount of Mn-substitution affects the thermal expansion of the lattice.
The second interesting trend is that Mn substitution has an opposite influence on the lattice parameters of the R-phases and O-phases. For the R-phase (blue line) in Fig. 9a and b, we can observe that the increase of the Mn substitution level leads to the contraction in the a-direction but an expansion along the c-direction. Contrastingly, for the O-phase (red line) as shown in Fig. 9a and 9b, an increase of Mn-substitution causes the expansion along the a-direction and contraction along the c-direction. We term this phenomenon a “double distortion” effect of Mn-substitution on the crystal structure. Practically, it leads to an enlarged gap between the lattice parameters of R-phases and O-phases as the Mn-substitution level increases.
The “double distortion” effect cannot be simply explained by the different ionic radii of the cations since the influence of Mn substitution is very anisotropic in this system. Therefore, what is the real driving force for the opposite impact of Mn-substitution? In short, we hypothesize that the distortions result from the crystal field effects. Even though the Fe/MnO5 bipyramidal bilayer in the R-phases becomes more complex after oxidation into the O-phase, the same bipyramidal polyhedra exist in both phases.22 We propose that in the bipyramidal crystal field, different d-electron fillings of Mn2+/Fe2+ in the R-phase and Mn3+/Fe3+ in the O-phase lead to the diametric and strongly anisotropic influence of Mn- substitution on the crystal structure.
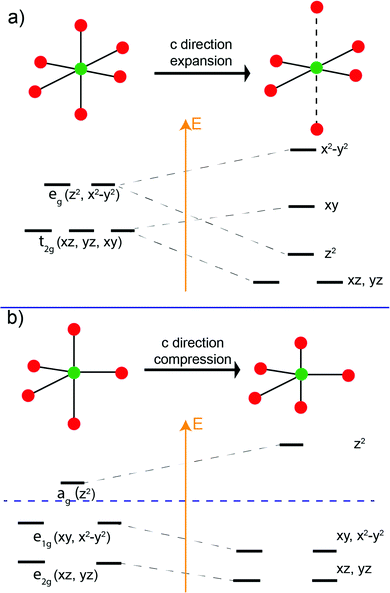
It is well known that for octahedral crystal fields (ideal point group Oh), if the metal center is Jahn–Teller active (e.g. d2, d4), the ML6 octahedron will undergo an anisotropic distortion to lower the Oh symmetry. The distortion lifts the energy-level degeneracy of the d-orbital manifold, and the electron filling occurs so the energy of the system is lowered in the newly modified crystal field60,61 (Fig. 10a). We believe that a similar phenomenon occurs in our Fe/MnO trigonal bipyramidal systems.
In the trigonal bipyramidal crystal field, compression or elongation along the c-direction does not change the site symmetry (e.g. D3h, C3v). Unlike the case for octahedral coordination, such distortions for trigonal bipyramids do not lead to the rearrangement of d-orbital energy levels. However, the relative energy level of the d-orbitals can be significantly modified. As is illustrated in Fig. 10b, in the trigonal bipyramidal field, compression in the c-direction increases the energy level of the ag (dz2) orbital while those of the doubly degenerate e1g (dxy, dx2-y2) and e2g (dxz, dyz) decrease so that the total orbital energy of the system does not the change.
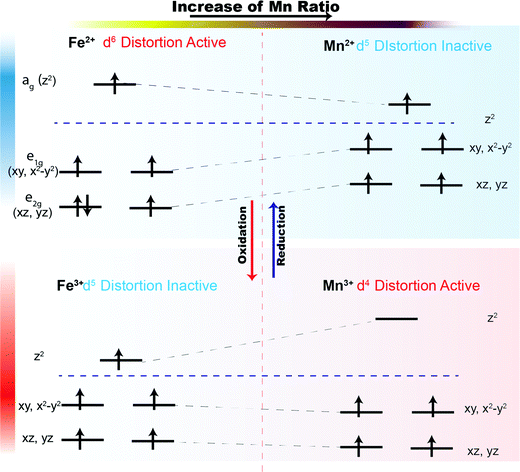
For the trigonal bipyramidal (Mn,Fe)O5 polyhedra in the present series, the electron count will determine whether a compressed crystal field will lower the total energy of the systems. The influence of Mn2+, Fe2+, Mn3+, and Fe3+ in the MO5 trigonal bipyramidal polyhedron crystal field is presented in Fig. 11. We assume that the metal ions in the MO5 trigonal bipyramids always adopt a high spin configuration. In the R-phase, Mn2+ has a d5 electron configuration and all orbitals are singly occupied. Therefore, the compression of the trigonal bipyramids has no effect on the total energy of the system. In the case of Fe2+, the d6 electron configuration leads to an extra electron in the e2g manifold, and the total energy of the system will be lowered if the trigonal bipyramids are compressed. Thus, we term Fe2+ is “distortion-active” while Mn2+ is “distortion-inactive”. As the level of Mn-substitution increases, the MO5 polyhedra will be less compressed, resulting in an expansion along the c-direction and contraction in the ab-plane for the R-phase. Conversely, in the O-phase, Mn3+ has a d4 electron configuration and the ag orbital is therefore empty. Compression of the trigonal bipyramids significantly lowers the energy of the electrons in the e1g (dxy, dx2−y2) and e2g (dxz, dyz) levels. Mn3+ is therefore “distortion-active” whereas Fe3+ with its d5 electron configuration is “distortion-inactive”. Increasing the Mn-substitution in the O-phase favors the compression of MO5 polyhedra, causing the contraction along the c-direction and expansion in the ab-plane. Therefore, we have an explanation for the ‘double distortion’ effect observed in the lattice parameter evolution by considering whether the phase includes distortion-active or distortion-inactive cations.
In addition to lattice parameters, we can also follow the metal–oxygen interatomic distances from diffraction data to understand this crystal field-driven distortion. Fig. 12 shows the influence of Mn substitution on the Mn/Fe–O bond distances in the R-phases and O-phases. As the Mn-substitution level increases in the R-phases, the Mn/Fe–O bond distances along the c-direction expand while the bond distances in the ab-plane contract. The opposite trend occurs in the O-phases. These trends of metal–oxygen bond distances along different directions are consistent with our hypothesis regarding the MO5 trigonal crystal fields. The influence of Mn3+ and Fe3+ on the lattice parameters in the MO5 trigonal bipyramidal polyhedron is also reported in the hexagonal LnMn1−xFexO3 (Ln = Y, Lu, Yb).62–64 Similar to our O-phase, the hexagonal LnMn1−xFexO3 system displays a decrease in the Fe/Mn–O bonds along the c-direction and an increase in the ab-plane as the Mn ratio increases.
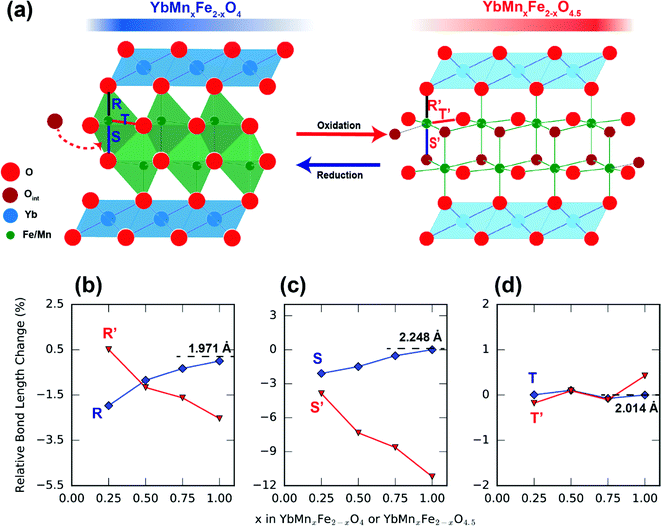 | ||
| Fig. 12 Influence of Mn substitution on different Fe/Mn–O bond lengths of R-phase YbMnxFe2−xO4 (blue) and the O phase YbMnxFe2−xO4.5 (red). The bonds labeled as R/R′ (b), S/S′ (c) and T/T′ (d) are indicated in Fig. 12a. The bond lengths are normalized. The bond lengths of R-phase YbMnxFe2−xO4 (x = 1) are chosen as references (set as 1, change as 0%). | ||
Outside the present system, it is quite rare in metal oxides to observe Mn2+ and Fe2+ in MO5 trigonal bipyramidal coordination. Therefore, it is instructive to examine cases of analogous molecular complexes. Pritchard et al. reported the existence of M2+L5 trigonal bipyramidal polyhedra in [M(II)Cl3(Hdabco)(dabco)]n and [M(II)Cl3(HdabcoH)2] complexes where dabco = 1,4-diazabicyclo[2.2.2]-octane. In these complexes, the M2+ coordinates to three Cl− ions in the equatorial plane and two N atoms of the ligand in the apical position. Upon exchanging Mn2+ by Fe2+, the M—Cl bond elongates while the M—N bond shortens the bond,65 which is consistent with our observation on the influence of Mn on the M–O bonds in R-phases. To our knowledge, we are the first to observe here a reversible valence change of ML5 trigonal bipyramids leading to a diametric effect on the lattice parameters.
The change in the Mn/FeO layer also slightly impacts the presumably rigid YbO layer itself. The expansion of the Mn/FeO layer applies a force on the neighboring YbO layer, driving it to be compressed, even though it remains chemically unchanged by the Mn-substitution. As presented in Fig. S19 (ESI†), the Yb–O bond length grows in the O-phase while it decreases in the R-phases with increasing Mn-substitution. This trend is consistent with that of the a-lattice parameter.
4. Conclusion
In summary, like their parent structure, the Mn-substituted R-phases show promising performance as oxygen storage materials. All YbMnxFe2−xO4 compositions studied here readily take up oxygen at relatively low temperatures and undergo a phase transition to the O-phases; YbMnxFe2−xO4.5, Mn-substitution does not lead to a separate phase transition for either R-phase YbMnxFe2−xO4 or O-phase YbMnxFe2−xO4.5. R-phases adopt R![[3 with combining macron]](https://www.rsc.org/images/entities/char_0033_0304.gif) m symmetry while the average crystal structure phase of the O-phase is P
m symmetry while the average crystal structure phase of the O-phase is P![[3 with combining macron]](https://www.rsc.org/images/entities/char_0033_0304.gif) . All display a complex incommensurate modulation (superspace group P
. All display a complex incommensurate modulation (superspace group P![[1 with combining macron]](https://www.rsc.org/images/entities/char_0031_0304.gif) (abg)0), indicative of ordering of MOn polyhedra for n = 4, 5, and 6. Our in situ diffraction studies indicate that the oxygen uptake temperature and the reaction kinetics are not greatly impacted by the Mn substitution. In addition, all YbMnxFe2−xO4 can reversibly transit between R-phases and O-phases in the alternative air and methane environment, showing their great cycling stability and potential to be applied in fuel combustion and conversion as OSMs.
(abg)0), indicative of ordering of MOn polyhedra for n = 4, 5, and 6. Our in situ diffraction studies indicate that the oxygen uptake temperature and the reaction kinetics are not greatly impacted by the Mn substitution. In addition, all YbMnxFe2−xO4 can reversibly transit between R-phases and O-phases in the alternative air and methane environment, showing their great cycling stability and potential to be applied in fuel combustion and conversion as OSMs.
Interestingly, in this system with reversible phase transitions driven by oxidation, the change in the d-electron configuration dictates the lattice expansion properties. The effect on the diverging a- and c-lattice parameters was termed a “double distortion” effect and we hypothesize that it is derived by crystal field effects in this system. The change from Mn2+/Fe2+ to Mn3+/Fe3+ in the MO5 trigonal bipyramidal causes a switch in which the metal ion is the ‘distortion-active’ ion. Because of the switching of roles upon oxygen release and uptake (e.g. Mn3+ is distortion-active whereas Mn2+ is not), the Mn-substitution leads to opposite influences on the lattice parameters of the R-phases and O-phases. This tuning of the lattice volume changes with Mn-substitution could be exploited to minimize the volume changes upon using this system as an OSM.
Conflicts of interest
There are no conflicts to declare.Acknowledgements
We acknowledge the Department of Commerce/NIST award 70NANB17H301 for support. Use of the Advanced Photon Source at Argonne National Laboratory was supported by the U.S. Department of Energy, Office of Science, Office of Basic Energy Sciences, under Contract No. DE-AC02-06CH11357. We thank W. Xu and A. Yakovenko at 17 BM, ANL, for their help with SXRD data collection. We thank Dr Sterbinsky at the 9-BM for XAS data collection. A portion of this research used resources at the Spallation Neutron Source, a DOE Office of Science User Facility operated by the Oak Ridge National Laboratory. We thank M. Kirkham and C. Li at POWGEN, SNS, ORNL for their help with powder neutron diffraction experiments.References
- A. Klimkowicz, T. Hashizume, K. Cichy, S. Tamura, K. Świerczek, A. Takasaki, T. Motohashi and B. Dabrowski, J. Mater. Sci., 2020, 55, 15653–15666 CrossRef CAS
.
- J. Vieten, B. Bulfin, F. Call, M. Lange, M. Schmücker, A. Francke, M. Roeb and C. Sattler, J. Mater. Chem. A, 2016, 4, 13652–13659 RSC
.
- J. Vieten, B. Bulfin, D. E. Starr, A. Hariki, F. M. F. de Groot, A. Azarpira, C. Zachäus, M. Hävecker, K. Skorupska, N. Knoblauch, M. Schmücker, M. Roeb and C. Sattler, Energy Technol., 2019, 7, 131–139 CrossRef CAS
.
- Q. Imtiaz, A. Kurlov, J. L. M. Rupp and C. R. Müller, ChemSusChem, 2015, 8, 2055–2065 CrossRef CAS PubMed
.
- H. Thunman, F. Lind, C. Breitholtz, N. Berguerand and M. Seemann, Fuel, 2013, 113, 300–309 CrossRef CAS
.
- H. Falcón, J. A. Barbero, J. A. Alonso, M. J. Martínez-Lope and J. L. G. Fierro, Chem. Mater., 2002, 14, 2325–2333 CrossRef
.
- X. Zhu, K. Li, L. Neal and F. Li, ACS Catal., 2018, 8, 8213–8236 CrossRef CAS
.
- L. Zhang, L. Zhang, Y. Hu, Y. Hu, W. Xu, W. Xu, C. Huang, Y. Su, M. Tian, Y. Zhu, H. Gong and X. Wang, Energy Fuels, 2020, 34, 6991–6998 CrossRef CAS
.
- X. P. Dai, R. J. Li, C. C. Yu and Z. P. Hao, J. Phys. Chem. B, 2006, 110, 22525–22531 CrossRef CAS PubMed
.
- I. S. Metcalfe, B. Ray, C. Dejoie, W. Hu, C. de Leeuwe, C. Dueso, F. R. García-García, C. M. Mak, E. I. Papaioannou, C. R. Thompson and J. S. O. Evans, Nat. Chem., 2019, 11, 638–643 CrossRef CAS PubMed
.
- X. Zhu, Q. Imtiaz, F. Donat, C. R. Müller and F. Li, Energy Environ. Sci., 2020, 13, 772–804 RSC
.
- Y. Liu, L. Qin, Z. Cheng, J. W. Goetze, F. Kong, J. A. Fan and L. S. Fan, Nat. Commun., 2019, 10, 1–6 CrossRef PubMed
.
- J. Adánez, L. F. De Diego, F. García-Labiano, P. Gayán, A. Abad and J. M. Palacios, Energy Fuels, 2004, 18, 371–377 CrossRef
.
- J. Adanez, A. Abad, F. Garcia-Labiano, P. Gayan and L. F. De Diego, Prog. Energy Combust. Sci., 2012, 38, 215–282 CrossRef CAS
.
- H. A. Alalwan, S. E. Mason, V. H. Grassian and D. M. Cwiertny, Energy Fuels, 2018, 32, 7959–7970 CrossRef CAS
.
- Q. Zafar, T. Mattisson and B. Gevert, Ind. Eng. Chem. Res., 2005, 44, 3485–3496 CrossRef CAS
.
- J. Zieliński, I. Zglinicka, L. Znak and Z. Kaszkur, Appl. Catal., A, 2010, 381, 191–196 CrossRef
.
- D. D. Taylor, N. J. Schreiber, B. D. Levitas, W. Xu, P. S. Whitfield and E. E. Rodriguez, Chem. Mater., 2016, 28, 3951–3960 CrossRef CAS
.
- T. Li, R. S. Jayathilake, D. D. Taylor and E. E. Rodriguez, Chem. Commun., 2019, 55, 4929–4932 RSC
.
- A. Demizu, K. Beppu, S. Hosokawa, K. Kato, H. Asakura, K. Teramura and T. Tanaka, J. Phys. Chem. C, 2017, 121, 19358–19364 CrossRef CAS
.
- M. Hervieu, A. Guesdon, J. Bourgeois, E. Elkaïm, M. Poienar, F. Damay, J. Rouquette, A. Maignan and C. Martin, Nat. Mater., 2014, 13, 74–80 CrossRef CAS PubMed
.
- S. Nicoud, M. Huvé, O. Hernandez, A. Pautrat, M. Duttine, A. Wattiaux, C. Colin, H. Kabbour and O. Mentré, J. Am. Chem. Soc., 2017, 139, 17031–17043 CrossRef CAS PubMed
.
- R. S. Jayathilake, B. D. Levitas and E. E. Rodriguez, J. Mater. Chem. A, 2018, 6, 4801–4810 RSC
.
- N. Kimizuka, A. Takenaka, Y. Sasada and T. Katsura, Solid State Commun., 1974, 15, 1321–1323 CrossRef CAS
.
- A. Nagano and S. Ishihara, J. Phys.: Condens. Matter, 2007, 19, 5 CrossRef
.
- C. R. Serrao, J. R. Sahu, K. Ramesha and C. N. R. Rao, J. Appl. Phys., 2008, 104, 016102 CrossRef
.
- K. Yoshii, N. Ikeda, T. Michiuchi, Y. Yokota, Y. Okajima, Y. Yoneda, Y. Matsuo, Y. Horibe and S. Mori, J. Solid State Chem., 2009, 182, 1611–1618 CrossRef CAS
.
- Y. Sun, Y. Liu, F. Ye, S. Chi, Y. Ren, T. Zou, F. Wang and L. Yan, J. Appl. Phys., 2012, 111, 07D902 CrossRef
.
- A. D. Christianson, M. D. Lumsden, M. Angst, Z. Yamani, W. Tian, R. Jin, E. A. Payzant, S. E. Nagler, B. C. Sales and D. Mandrus, Phys. Rev. Lett., 2008, 100, 107601 CrossRef CAS PubMed
.
- A. J. Hearmon, D. Prabhakaran, H. Nowell, F. Fabrizi, M. J. Gutmann and P. G. Radaelli, Phys. Rev. B: Condens. Matter Mater. Phys., 2012, 85, 014115 CrossRef
.
- Y. Shen, Y. D. Li, H. C. Walker, P. Steffens, M. Boehm, X. Zhang, S. Shen, H. Wo, G. Chen and J. Zhao, Nat. Commun., 2018, 9, 1–7 CrossRef PubMed
.
- J. A. M. Paddison, M. Daum, Z. Dun, G. Ehlers, Y. Liu, M. B. Stone, H. Zhou and M. Mourigal, Nat. Phys., 2017, 13, 117–122 Search PubMed
.
- Y. Li, Adv. Quantum Technol., 2019, 2, 1900089 Search PubMed
.
- I. Nodari, A. Alebouyeh, J. F. Brice, R. Gérardin and O. Evrard, Mater. Res. Bull., 1988, 23, 1039–1044 CrossRef CAS
.
- S. Cao, J. Lee, Z. Wang, H. Tian, Y. Qin, L. Zeng, C. Ma, H. Yang and J. Li, Sci. Rep., 2012, 2, 1–4 Search PubMed
.
- J. Akimitsu, Y. Inada, K. Siratori, I. Shindo and N. Kimizuka, Solid State Commun., 1979, 32, 1065–1068 CrossRef CAS
.
- F. Wang, J. Kim, G. D. Gu, Y. Lee, S. Bae and Y. J. Kim, J. Appl. Phys., 2013, 113, 063909 CrossRef
.
- C. M. Brooks, R. Misra, J. A. Mundy, L. A. Zhang, B. S. Holinsworth, K. R. O’Neal, T. Heeg, W. Zander, J. Schubert, J. L. Musfeldt, Z. K. Liu, D. A. Muller, P. Schiffer and D. G. Schlom, Appl. Phys. Lett., 2012, 101, 132907 CrossRef
.
- R. W. Cheary and A. Coelho, J. Appl. Crystallogr., 1992, 25, 109–121 CrossRef CAS
.
- B. H. Toby and R. B. Von Dreele, J. Appl. Crystallogr., 2013, 46, 544–549 CrossRef CAS
.
- P. J. Chupas, K. W. Chapman, C. Kurtz, J. C. Hanson, P. L. Lee and C. P. Grey, J. Appl. Crystallogr., 2008, 41, 822–824 CrossRef CAS
.
- O. E. R. Gerardin, H. Aqachmar, I. Nodari and J. FBrich, J. Phys. Chem. Solids, 1989, 50, 43–48 CrossRef
.
- L. Pauling, J. Am. Chem. Soc., 1931, 53, 1367–1400 CrossRef CAS
.
- L. H. Ahrens, Geochim. Cosmochim. Acta, 1952, 2, 155–169 CrossRef CAS
.
- M. Nespolo, M. Isobe, J. Iida and N. Kimizuka, Acta Crystallogr., Sect. B: Struct. Sci., 2000, 56, 805–810 CrossRef PubMed
.
- A. G. Gamzatov, A. M. Aliev, M. N. Markelova, N. A. Burunova, A. R. Kaul’, A. S. Semisalova and N. S. Perov, Phys. Solid State, 2016, 58, 1143–1147 CrossRef CAS
.
- M. C. Biesinger, B. P. Payne, A. P. Grosvenor, L. W. Lau, A. R. Gerson and R. S. C. Smart, Appl. Surf. Sci., 2011, 257, 2717–2730 CrossRef CAS
.
- A. P. Grosvenor, B. A. Kobe, M. C. Biesinger and N. S. McIntyre, Surf. Interface Anal., 2004, 36, 1564–1574 CrossRef CAS
.
- I. Junji, T. Midori and N. Yasuaki, J. Phys. Soc. Jpn., 2013, 59, 4443–4448 Search PubMed
.
- J. B. Metson, Surf. Interface Anal., 1999, 27, 1069–1072 CrossRef CAS
.
- J. Cazaux, J. Electron Spectrosc. Relat. Phenom., 2000, 113, 15–33 CrossRef CAS
.
- L. Q. Wu, Y. C. Li, S. Q. Li, Z. Z. Li, G. D. Tang, W. H. Qi, L. C. Xue, X. S. Ge and L. L. Ding, AIP Adv., 2015, 5, 97210 CrossRef
.
- D. Y. Wang, D. S. Park, J. Griffith and A. S. Nowick, Solid State Ionics, 1981, 2, 95–105 CrossRef CAS
.
- T. L. Nguyen, M. Dokiya, S. Wang, H. Tagawa and T. Hashimoto, Solid State Ionics, 2000, 130, 229–241 CrossRef CAS
.
- R. A. De Souza, A. Ramadan and S. Hörner, Energy Environ. Sci., 2012, 5, 5445–5453 RSC
.
-
S. Jašo, H. Arellano-Garcia and G. Wozny, A Novel Design Concept for the Oxidative Coupling of Methane Using Hybrid Reactors, Elsevier, 2011, vol. 29 Search PubMed
.
- D. Marrocchelli, N. H. Perry and S. R. Bishop, Phys. Chem. Chem. Phys., 2015, 17, 10028–10039 RSC
.
- Y. Wang, K. Duncan, E. D. Wachsman and F. Ebrahimi, Solid State Ionics, 2007, 178, 53–58 CrossRef CAS
.
-
L. Pauling, Nature of the Chemical Bond, 3rd edn, 1960, vol. 17, pp. 505–562 Search PubMed
.
-
H. A. Jahn and E. Teller, Stability of Polyatomic Molecules in Degenerate Electronic States I. Orbital Degeneracy, 1968 Search PubMed
.
- H. A. Jahn and E. Teller, Proc. R. Soc. London, Ser. A, 1937, 161, 220–235 CAS
.
- S. L. Samal, T. Magdaleno, K. V. Ramanujachary, S. E. Lofland and A. K. Ganguli, J. Solid State Chem., 2010, 183, 643–648 CrossRef CAS
.
- S. L. Samal, W. Green, S. E. Lofland, K. V. Ramanujachary, D. Das and A. K. Ganguli, J. Solid State Chem., 2008, 181, 61–66 CrossRef CAS
.
- J. G. Lin, Y. S. Chen and T. C. Han, J. Appl. Phys., 2010, 107, 09D902 CrossRef
.
- R. G. Pritchard, M. Ali, A. Munim and A. Uddin, Acta Crystallogr., Sect. C: Cryst. Struct. Commun., 2006, 62, 507–509 CrossRef PubMed
.
Footnote |
| † Electronic supplementary information (ESI) available. See DOI: 10.1039/d1ma00822f |
| This journal is © The Royal Society of Chemistry 2022 |

