 Open Access Article
Poly(L-lactide): optimization of melting temperature and melting enthalpy and a comparison of linear and cyclic species
Hans R.
Kricheldorf
*a,
Steffen M.
Weidner
 b and
Andreas
Meyer
c
aInstitut für Technische und Makromolekulare Chemie, Universität Hamburg, Bundesstr. 45, D 20146 Hamburg, Germany. E-mail: hrkricheldorf@aol.de
bBAM – Bundesanstalt für Materialforschung und-Prüfung, Richard Willstätter Str. 11, D 12489 Berlin, Germany
cInstitut für Physikalische Chemie, Universität Hamburg, Grindelallee 117, D-20147 Hamburg, Germany
First published on 30th November 2021
Abstract
Twice recrystallized L-lactide was polymerized with a dozen different tin or bismuth catalysts in bulk at 160 °C for 24 h and was annealed at 150 °C afterwards. In two cases Tm values above 197.0 °C were obtained. The parameters causing a scattering of the DSC data were studied and discussed. The samples prepared with SnCl2, 2,2-dibutyl-2-stanna-1,3-ditholane (DSTL) or cyclic tin(II) bisphenyldioxide (SnBiph) were subject to annealing programs with variation of time and temperatures, revealing that the Tms did not increase. Hower, an increase of ΔHm was achieved with maximum values in the range of 93–96 J g−1 corresponding to crystallinities of around 90%. Further studies were performed with once recrystallized L-lactide. Again, those samples directly crystallized from the polymerization process showed the highest Tm values. These data were compared with the equilibrium Tm0 and ΔHm0 data calculated by several research groups for perfect crystallites. A Tm0 of 213 +/−2 °C and a ΔHm0 of 106 J g−1 show the best agreement with the experimental data. The consequences of annealing for the thickness growth of crystalites are discussed on the basis of SAXS measurements. Finally, a comparison of cyclic and linear poly(L-lactide)s is discussed.
Introduction
Since the beginning of the technical production of polylactide in the 70s of the last century research activities concerning chemical and physical properties of polylactides have dramatically increased.1–5 The most fundamental physical properties, glass transition temperature (Tg), melting temperature (Tm) and melting enthalpy (ΔHm), a measure of crystallinity, are the most fundamental physical properties. They are responsible for mechanical properties and are thus, decisive for most potential applications. In contrast to many other polymers Tm and ΔHm of polylactides can vary over a broad range, for example 120–200 °C in the case of Tm and 20–100 J g−1 in the case of ΔHm. They are influenced by three parameters.1. Optical purity – Since lactic acid is chiral compound polylactides may, in principle, contain various ratios of D- and L-units which sequences may vary over a broad range from random to optically pure poly(L-lactide) PLLA, or poly(D-lactide) PDLA. Stereocopolymers containing more the 20% of the enantiomer are amorphous. The influence of D-units on the physical properties of PLLA has been intensively studied by several research groups.6–11
2. Thermal history – It is, in principle trivial, that experimental parameters such as crystallization temperature, heating rate, annealing time and mechanical stress have a significant influence on the physical and mechanical properties of polylactides. A first intensive study in this direction was performed by the group of Pennings12–15 followed by numerous other research groups.16–27 Studies above 120 °C are simplified by the fact that the α-modification is the thermodynamically most stable crystal modification.28
3. Chemical reactions in the solid state – Recently, it was found by the authors that in the presence of a reactive transesterification (polymerization) catalyst several kinds of transesterification reaction may proceed in the solid state, which modify the fraction of the mobile amorphous phase, structure and fraction of the immobile amorphous phase on the surface of the crystallites and the thickness of the crystallites. Hence these transesterification reactions have a strong influence on the morphology and thus, on Tm and ΔHm. In addition of the experimental parameters mentioned above, nature and activity of the catalyst and its concentration play a role for extent and consequences of the transesterification reactions. This aspect was recently discovered by the authors and needs further studies.29–32
In this context it was the purpose of this work to find reaction conditions allowing for an optimization of Tm and ΔHm. Variation of structure and activity of catalysts of primary interest. Eleven tin catalysts and one Bi-based catalysts were tested in this work (Table 1).
| Exp. no. | Catalyst | M n | M w | T m (°C) | ΔHma (J g−1) | T m (°C) | ΔHma (J g−1) | T m (°C) | L (nm) | Crystc (%) | l c (nm) |
|---|---|---|---|---|---|---|---|---|---|---|---|
| a Measured with a Mettler-Toledo DSC 1 on two sites of the same product. b Measured with a Setaram TGA 24. c Highest ΔHm value was used for the calculation. | |||||||||||
| 1 | SnCl2 | 38![[thin space (1/6-em)]](https://www.rsc.org/images/entities/char_2009.gif) 500 500 |
101![[thin space (1/6-em)]](https://www.rsc.org/images/entities/char_2009.gif) 000 000 |
196.3 | 93.3 | 196.7 | 88.7 | 195.5 | 35 | 90 | 30 |
| 2 | SnAc2 | 45![[thin space (1/6-em)]](https://www.rsc.org/images/entities/char_2009.gif) 000 000 |
100![[thin space (1/6-em)]](https://www.rsc.org/images/entities/char_2009.gif) 000 000 |
193.6 | 84.7 | 193.3 | 80.5 | 191.6 | 35 | 80 | 28 |
| 3 | SnOct2 | 41![[thin space (1/6-em)]](https://www.rsc.org/images/entities/char_2009.gif) 000 000 |
109![[thin space (1/6-em)]](https://www.rsc.org/images/entities/char_2009.gif) 000 000 |
189.7 | 85.6 | 191.0 | 77.0 | — | 28 | 80 | 23 |
| 4 | SnCyca | 68![[thin space (1/6-em)]](https://www.rsc.org/images/entities/char_2009.gif) 000 000 |
153![[thin space (1/6-em)]](https://www.rsc.org/images/entities/char_2009.gif) 000 000 |
184.0 | 74.6 | 187.7 | 88.2 | — | 23 | 81 | 19 |
| 5 | SnSal | 24![[thin space (1/6-em)]](https://www.rsc.org/images/entities/char_2009.gif) 000 000 |
61![[thin space (1/6-em)]](https://www.rsc.org/images/entities/char_2009.gif) 000 000 |
186.1 | 82.3 | 185.2 | 75.2 | — | 23 | 83 | 20 |
| 6 | SnBiph | 111![[thin space (1/6-em)]](https://www.rsc.org/images/entities/char_2009.gif) 000 000 |
235![[thin space (1/6-em)]](https://www.rsc.org/images/entities/char_2009.gif) 000 000 |
198.0 | 78.6 | 197.6 | 83.6 | 197.2 | 34 | 79 | 27 |
| 7 | Me2SnCl2 | Slow pol. | — | — | — | — | — | — | — | — | — |
| 8 | Me2SnO | 22![[thin space (1/6-em)]](https://www.rsc.org/images/entities/char_2009.gif) 500 500 |
46![[thin space (1/6-em)]](https://www.rsc.org/images/entities/char_2009.gif) 000 000 |
185.2 | 79.2 | 183.8 | 79.4 | — | 21 | 79 | 17 |
| 9 | Bu2SnO | 31![[thin space (1/6-em)]](https://www.rsc.org/images/entities/char_2009.gif) 000 000 |
81![[thin space (1/6-em)]](https://www.rsc.org/images/entities/char_2009.gif) 000 000 |
190.4 | 87.2 | 189.3 | 76.9 | — | 23 | 82 | 19 |
| 10 | Ph2SnO | 25![[thin space (1/6-em)]](https://www.rsc.org/images/entities/char_2009.gif) 000 000 |
68![[thin space (1/6-em)]](https://www.rsc.org/images/entities/char_2009.gif) 000 000 |
190.7 | 85.4 | 189.2 | 79.2 | 189.0 | 26 | 81 | 21 |
| 11 | DSTL | 68![[thin space (1/6-em)]](https://www.rsc.org/images/entities/char_2009.gif) 000 000 |
167![[thin space (1/6-em)]](https://www.rsc.org/images/entities/char_2009.gif) 000 000 |
197.7 | 93.0 | 197.3 | 87.4 | 196.5 | 32 | 90 | 27 |
| 12 | BiSub | 20![[thin space (1/6-em)]](https://www.rsc.org/images/entities/char_2009.gif) 500 500 |
54![[thin space (1/6-em)]](https://www.rsc.org/images/entities/char_2009.gif) 000 000 |
187.0 | 80.6 | 187.6 | 82.0 | — | 20 | 77 | 16 |
In this connection it should be mentioned that several research groups have attempted to calculate the maximum Tm of perfect PLLA crystals, the s. c. equilibrium melting temperature Tm0 and, the maximum melting enthalpy ΔHm0. ΔHm0 is of particular interest for analytical purposes because its knowledge allows the calculation of crystallinities from DSC measurements. Unfortunately, there is no satisfactory agreement about Tm0 and ΔHm0 in the literature, and the knowledge of the highest experimentally accessible Tm's and ΔHm's allows for sorting out those Tm0 and ΔHm0 values that are too low and thus, allows identification of the most reasonable and trustworthy Tm0 and ΔHm0 values.
Experimental
Materials
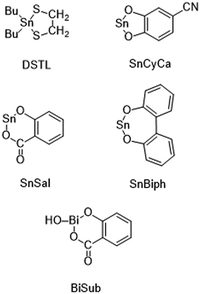
L-Lactide, a product of Corbion Purac, was kindly supplied by Thyssen-Uhde AG (Berlin). It was once or twice recrystallized from toluene (99.89% extra dry, ACROS Organics). Tin(II) 2-ethylhexanotae (SnOct2) with >96% purity was purchased from Alfa Aesar (Kandel, Germany) and used as received. SnCl2, Me2SnCl2 Me2SnO, Bu2SnO, Ph2SnO and Bi(III)subsalicylate (BiSub) were all purchased from Alfa Aesar and used as received, SnAc2 (Alfa Aesar) was dried at 40 °C in vacuo in the presence of solid NaOH for 4 d to remove traces of acetic acid. The following cyclic catalysts prepared in previous studies were used: DSTL,33 SnSal,34 SnCyca35 and SnBiph35 (for acronyms see Scheme 1).Polymerizations
| Catalyst | Site A, 1st meas. | Site A, 2nd meas. | Site B | Site C | Powder | |||||
|---|---|---|---|---|---|---|---|---|---|---|
| T m (°C) | ΔHm (J g−1) | T m (°C) | ΔHm (J g−1) | T m (°C) | ΔHm (J g−1) | T m (°C | ΔHm (J g−1) | T m (°C) | ΔHm (J g−1) | |
| SnOct2 | 187.4 | 80.1 | 187.8 | 86.4 | 190.4 | 86.0 | 189.2 | 81.7 | 189.4 | 79.0 |
| Ph2SnO | 188.6 | 90.0 | 189.9 | 88.2 | 190.2 | 85.6 | 187.1 | 84.4 | 187.9 | 81.6 |
| Exp. no. | Temp. (°C) | Time (h) | M n | M w | T m (°C) | ΔHm (J g−1) | Cryst. (%) |
|---|---|---|---|---|---|---|---|
| a Starting material no. 1 Table 1. | |||||||
| 1 | —a | — | 38![[thin space (1/6-em)]](https://www.rsc.org/images/entities/char_2009.gif) 500 500 |
101![[thin space (1/6-em)]](https://www.rsc.org/images/entities/char_2009.gif) 000 000 |
196.7 | 96.0 | 91 |
| 2 | 170 | 10 | 24![[thin space (1/6-em)]](https://www.rsc.org/images/entities/char_2009.gif) 000 000 |
62![[thin space (1/6-em)]](https://www.rsc.org/images/entities/char_2009.gif) 000 000 |
195.6 | 92.7 | 87 |
| 3 | 180 | 2 | 27![[thin space (1/6-em)]](https://www.rsc.org/images/entities/char_2009.gif) 000 000 |
66![[thin space (1/6-em)]](https://www.rsc.org/images/entities/char_2009.gif) 000 000 |
196.4 | 93.8 | 88 |
| 4 | 180 | 4 | 19![[thin space (1/6-em)]](https://www.rsc.org/images/entities/char_2009.gif) 000 000 |
52![[thin space (1/6-em)]](https://www.rsc.org/images/entities/char_2009.gif) 000 000 |
195.6 | 84.9 | 80 |
| 5 | 180 | 10 | 33![[thin space (1/6-em)]](https://www.rsc.org/images/entities/char_2009.gif) 000 000 |
85![[thin space (1/6-em)]](https://www.rsc.org/images/entities/char_2009.gif) 000 000 |
196.5 | 91.1 | 86 |
| 6 | 170 + 187 | 10 + 1.5 | 26![[thin space (1/6-em)]](https://www.rsc.org/images/entities/char_2009.gif) 000 000 |
72![[thin space (1/6-em)]](https://www.rsc.org/images/entities/char_2009.gif) 000 000 |
196.0 | 88.0 | 83 |
| 7 | 170 + 187 | 10 + 3.0 | 20![[thin space (1/6-em)]](https://www.rsc.org/images/entities/char_2009.gif) 000 000 |
51![[thin space (1/6-em)]](https://www.rsc.org/images/entities/char_2009.gif) 000 000 |
195.7 | 88.5 | 84 |
| Exp. no. | Temp. (°C) | Time (h) | M n | M w | T m (°C) | ΔHm (J g−1) | Cryst. (%) |
|---|---|---|---|---|---|---|---|
| a Starting material no. 11 Table 1. | |||||||
| 1 | —a | — | 60![[thin space (1/6-em)]](https://www.rsc.org/images/entities/char_2009.gif) 000 000 |
167![[thin space (1/6-em)]](https://www.rsc.org/images/entities/char_2009.gif) 000 000 |
197.7 | 93.0 | 88 |
| 2 | 170 | 10 | 45![[thin space (1/6-em)]](https://www.rsc.org/images/entities/char_2009.gif) 000 000 |
101![[thin space (1/6-em)]](https://www.rsc.org/images/entities/char_2009.gif) 000 000 |
197.6 | 92.0 | 87 |
| 3 | 180 | 2 | 36![[thin space (1/6-em)]](https://www.rsc.org/images/entities/char_2009.gif) 000 000 |
75![[thin space (1/6-em)]](https://www.rsc.org/images/entities/char_2009.gif) 000 000 |
194.2 | 83.8 | 79 |
| 4 | 180 | 4 | 22![[thin space (1/6-em)]](https://www.rsc.org/images/entities/char_2009.gif) 000 000 |
69![[thin space (1/6-em)]](https://www.rsc.org/images/entities/char_2009.gif) 000 000 |
192.8 | 83.5 | 79 |
| 5 | 180 | 10 | 30![[thin space (1/6-em)]](https://www.rsc.org/images/entities/char_2009.gif) 000 000 |
85![[thin space (1/6-em)]](https://www.rsc.org/images/entities/char_2009.gif) 000 000 |
196.5 | 85.4 | 80 |
| 6 | 170 + 187 | 10 + 1.5 | 41![[thin space (1/6-em)]](https://www.rsc.org/images/entities/char_2009.gif) 000 000 |
113![[thin space (1/6-em)]](https://www.rsc.org/images/entities/char_2009.gif) 000 000 |
197.6 | 81.8 | 77 |
| 7 | 170 + 187 | 10 + 3.0 | 23![[thin space (1/6-em)]](https://www.rsc.org/images/entities/char_2009.gif) 000 000 |
80![[thin space (1/6-em)]](https://www.rsc.org/images/entities/char_2009.gif) 000 000 |
195.0 | 74.0 | 70 |
| Exp. no. | Temp. (°C) | Time (h) | M n | M w | T m (°C) | ΔHm (J g−1) | Cryst. (%) |
|---|---|---|---|---|---|---|---|
| a Starting material no. 6 Table 1. | |||||||
| 1 | —a | — | 111![[thin space (1/6-em)]](https://www.rsc.org/images/entities/char_2009.gif) 000 000 |
235![[thin space (1/6-em)]](https://www.rsc.org/images/entities/char_2009.gif) 000 000 |
198.0 | 78.6 | 74 |
| 2 | 170 | 10 | 45![[thin space (1/6-em)]](https://www.rsc.org/images/entities/char_2009.gif) 000 000 |
112![[thin space (1/6-em)]](https://www.rsc.org/images/entities/char_2009.gif) 000 000 |
196.2 | 95.7 | 90 |
| 3 | 180 | 2 | 67![[thin space (1/6-em)]](https://www.rsc.org/images/entities/char_2009.gif) 000 000 |
173![[thin space (1/6-em)]](https://www.rsc.org/images/entities/char_2009.gif) 000 000 |
195.3 | 94.4 | 89 |
| 4 | 180 | 4 | 52![[thin space (1/6-em)]](https://www.rsc.org/images/entities/char_2009.gif) 000 000 |
136![[thin space (1/6-em)]](https://www.rsc.org/images/entities/char_2009.gif) 000 000 |
198.0 | 90.1 | 85 |
| 5 | 180 | 10 | 47![[thin space (1/6-em)]](https://www.rsc.org/images/entities/char_2009.gif) 000 000 |
132![[thin space (1/6-em)]](https://www.rsc.org/images/entities/char_2009.gif) 000 000 |
196.6 | 87.0 | 83 |
| 6 | 170 + 187 | 10 + 1.5 | 36![[thin space (1/6-em)]](https://www.rsc.org/images/entities/char_2009.gif) 000 000 |
104![[thin space (1/6-em)]](https://www.rsc.org/images/entities/char_2009.gif) 000 000 |
195.4 | 87.5 | 84 |
| 7 | 170 + 187 | 10 + 3.0 | 34![[thin space (1/6-em)]](https://www.rsc.org/images/entities/char_2009.gif) 000 000 |
77![[thin space (1/6-em)]](https://www.rsc.org/images/entities/char_2009.gif) 000 000 |
195.5 | 96.2 | 91 |
Measurements
The MALDI TOF mass spectra were measured with an AutoflexMax mass spectrometer Bruker Daltonik, Bremen, Germany) in the positive ion linear mode. For sample spot preparation chloroform solutions of poly(L-lactide) (3–5 mg mL−1) doped with potassium trifluoroacetate (2 mg mL−1) were premixed in an Eppendorf vial with a solution of trans-2-[3-(4-tert-butylphenyl)-2-methyl-2-propenylidene] malononitrile (DCTB, 20 mg mL−1, CHCl3) in a ratio of 20/2/50 (sample/salt/matrix). 1 μL of this solution was deposited on the MALDI stainless steel target. Spectra were recorded from at least 4 different positions of the spot and accumulated.The GPC measurements were performed in a modular system kept at 40 °C consisting of an isocratic pump, 1 mL min−1 and a refractive index detector (Optilab rex, Wyatt). Samples were manually injected (100 μL, 2–4 mg mL−1). For instrument control and data calculation Astra software (Wyatt) was used. The calibration was performed using polystyrene standard sets (Polymer Standards Service – PSS, Mainz). The number average (Mn) and weight average (Mw) molecular weights reported in the Tables below are uncorrected for convenient comparison with the uncorrected GPC data of other research groups. For a correlation of intrinsic viscosities with molecular weights, Mark–Houwink–Sakurada (MHS) measurements were performed (Astra, Wyatt).
The DSC heating traces were recorded on a freshly (with indium and zinc) calibrated Mettler–Toledo DSC-1 equipped with Stare Software-11. Quantities of 8–10 mg were used for these measurements. Only the first heating traces were considered. A heating rate of 10 K min−1 described by almost all other research groups was also used in this work. The influence of the heating rate on Tm was studied by Kishore et al.13 The crystallinities listed in the Tables were calculated with a ΔHm![[thin space (1/6-em)]](https://www.rsc.org/images/entities/char_2009.gif) max of 106 J g−1.
max of 106 J g−1.
The SAXS measurements were performed using our in-house SAXS/WAXS apparatus equipped with an Incoatec™ X-ray source IμS and Quazar Montel optics. The wavelength of the X ray beam was 0.154 nm and the focal spot size at the sample position was 0.6 mm2. The samples were measured in transmission geometry and were recorded with a Rayonix™ SX165 CCD-Detector. For the WAXS measurements the sample-detector distance was 0.1 m, allowing to detect an angular range of 2Θ = 5–33°. The recording time for each WAXS pattern was 300 s. The SAXS measurements were performed at sample-detector distance of 1.6 m and the accumulation was 20 minutes. DPDAK, a customizable software for reduction and analysis of X-ray scattering data sets was used for gathering 1D scattering curves.36 For the evaluation of the crystallinity of the samples the data were imported in Origin™ and analysed with the curve fitting module. After subtracting of the instrumental background, the integral intensity of the crystalline reflections was divided by the overall integral intensity to determine the crystallinity Xc. The SAXS curves were converted into Kratky plots. The long periods of the lamellar domains were determined by the q values of the reflection maxima.
Results and discussion
Evaluation of catalysts
Eleven tin catalysts were selected for this study considering the following aspects. A high efficiency as polymerization catalyst was desirable, because high rates of polymerization may also indicate high rates of transesterification. From this point of view SnAc2, SnOct2, SnSal and above all SnBiph were included as the most promising candidates. However, a small size of the catalyst might also be beneficial for efficient transesterification in the immobile amorphous fraction (IMF), because of a higher mobility in this extremely viscous phase. Under this aspect SnAc2 and SnCl2 should be most favourable for efficient transesterification among the tin(II) catalysts and Me2SnCl2 and Me2SnO among the tin(IV) catalysts. Considering previous experiments with cyclic tin catalysts, polymerizations conducted at 160 °C/24 h with a LA/Cat ratio of 1000/1 seemed to be favourable for the spontaneous crystallization of PLLA from the melt. However, Me2SnCl2 failed to give a high conversion under these conditions and in the cases of Me2SnO and BiSub crystallization was still far from complete. Therefore, the temperature was lowered to 150 °C for 22 h, whereupon complete crystallization was achieved for all PLLAs with exception of the Me2SnCl2-catalyzed oligomers.The results summarized in Table 1 show a broad variation of Tm (between 184 and 198 °C) and also a broad variation of ΔHm (between 74 and 93 J g−1). A straightforward correlation of Tm's with the afore-mentioned properties of the catalyst was not detectable. Whereas the success of SnCl2 and SnBiph in terms of high Tm's was understandable based on the above arguments, the failure of MeSnCl2 and the sluggishness of Me2SnO were not. The extraordinarily high Tm obtained with DSTL was not unexpected considering previous results,33 but it does not correlate with the observation that the activity of DSTL as polymerization catalyst is rather low. The three samples with the highest Tm's were then subject to several annealing experiments which were discussed in the next section. Yet, prior to this discussion accuracy and reproducibility of the DSC measurements deserve a comment.
DSC data are usually presented without margin of error and without information on a scattering of the measurements. However, such a presentation of Tm and ΔHm data is only justified for measurements of a single crystal, but not for measurements of larger specimens of crystalline PLLA as they were prepared in this work. A scattering of thermal data has mainly two sources. First, the inhomogeneity of the sample and second, different DSC apparatus. The samples listed in Table 1 were prepared in quantities of 8.5 g in Erlenmeyer flasks and thus formed disks with a diameter of c. 5 cm and a thickness of ca. 4 mm. It was observed that in several cases the nuclei of the crystallization process were not homogeneously distributed but began to form in the neighbourhood of the stirring bar, because its motion immediately before it was stopped by the increasing melt viscosity caused weak mechanical stress in its direct neighbourhood, and the parallel alignment of chain segments induced nucleation.
The disks were cut into eight pieces for annealing experiments and when a piece from the interior of the disk was compared with a piece from the outer sphere, the scattering of the DSC data listed in two columns of Table 1 was found. Whereas this scattering was weak for Tm considerable differences were found for ΔHm. A more detailed examination of the inhomogeneity was conducted with PLLAs prepared with SnOct2 and Ph2SnO. At first two probes were taken from the same site of the same piece, but nonetheless a slight scattering of the results was found as demonstrated by the columns “Site A, 1. and 2. measurement” in Table 2. Furthermore, probes were taken from two other pieces (sites B and C) and a somewhat broader scattering of Tm and ΔHm was found. Finally, a piece of each sample was pulverized in a mortar after cooling with liquid air (last column). The powder data were somewhere in between the extremes of the individual sites. Pulverization has, of course, the advantage of homogenization of larger samples, but also has two disadvantages. First, the large surface attracts moisture and thus, powders of PLLA are unfavourable for storage and later measurements. Second, the chance to find spherulites with a higher perfection than the average of the sample does not exist anymore.
When five samples were subject to DSC measurements with SEATRAM apparatus (BAM, Berlin), the Tm, data were about 1 °C lower than those recorded with the Mettler Toledo apparatus (TMC, Hamburg) (last column Table 1). Furthermore, it should be mentioned that quite recently the authors compared numerous PLLA samples prepared (and annealed) with SnOct2 with DSC data of the Pennings group12–14 crystallized and annealed under comparable conditions. A good agreement of all data was found, for example, the maximum Tm observed by both groups (194.5 °C) was identical.37 For these reasons the authors consider the DSC data reported in this work to be reliable and representative for PLLA in its optimum morphology. This conclusion means that Tm's in the range of 197–198 °C as they were observed in 7 experiments (incl. Tables 3–5) are the highest experimental Tm's reported so far.
The highest ΔHm values fall into the range of 90–96 J g−1, identical with or slightly higher than the maximum values reported by other research groups13,19 (90–92 J g−1). The consequence of this results for the calculation of crystallinities is discussed below.
Annealing experiments
The PLLA samples prepared with SnCl2, DSTL and SnBiph were subject to an annealing program with variation of temperature and time as indicated by the 2 and 3 columns in Tables 3–5. Due to the high Tm's of the starting materials annealing was feasible at 180 and even at 187 °C. However, no increase of Tm was found regardless of the catalyst and the annealing conditions Here and in previous experiments with SnBiph at lower temperatures (130 or 140 °C) and in annealing experiments with SnOct2, the PLLA obtained by direct crystallization from the polymerization process had the highest Tm values. An overriding trend across all three series of annealing experiments is the considerable degradation of the molecular weights. It is in general accepted that the Tm of PLLA slightly increases with the molecular weight, because a lower concentration of end groups results in a lower number of defects in the crystal lattices. Hence, the slightly lower Tm's observed in this work after annealing may to be ascribed to the lower molecular weights, and this interpretation is certainly reasonable as an overriding trend but does not suffice for a satisfactory explanation of all results. For example, in the case of the SnCl2-catalyzed PLLAs, the Tm values obtained after annealing at 180 or 187 °C (no. 1, 3, 6, Table 3) are as high as those of the starting material, despite lower Mw's. The same is true for the DSTL-catalyzed samples annealed at 170 or 187 °C (no. 2, 6, Table 4) Since the Tm also depends on the thickness of the lamellar crystal (lc) and on the surface free energy (σe) according to the Gibbs–Thomson equation (eqn (1)), nature and extent of transesterification catalyst across the surface of the crystallites play an important role for the morphology and thus, for the Tm. Evidence for such transesterification reactions in solid PLLA has been presented and discussed in several previous publications29–32 and thus, should not be repeated here again.| Tm = T0m [1 − (2σe/ρΔH0mlc)] | (1) |
Four more series of annealing experiments were performed with PLLA samples prepared with DSTL and SnBiph (Tables 6 and 7). The starting materials were prepared at 160 °C/24 h from once or twice recrystallized L-lactide for the following reasons. Firstly, the effect of repeated recrystallization should be elucidated. Secondly, the total polymerization time should be shortened relative to the experiments of Table 1 to obtain higher molecular weights. This second goal was in fact not realized as demonstrated by the Mw's of 153![[thin space (1/6-em)]](https://www.rsc.org/images/entities/char_2009.gif) 000 and 141
000 and 141![[thin space (1/6-em)]](https://www.rsc.org/images/entities/char_2009.gif) 000 for the DSDTL-catalyzed PLLAs (no. 1 and 5, Table 6) and 248
000 for the DSDTL-catalyzed PLLAs (no. 1 and 5, Table 6) and 248![[thin space (1/6-em)]](https://www.rsc.org/images/entities/char_2009.gif) 000 plus 239
000 plus 239![[thin space (1/6-em)]](https://www.rsc.org/images/entities/char_2009.gif) 000 for the SnBiph-catalyzed starting material (no. 1 and 5, Table 7). Unexpectedly, the Mw's obtained from the PLLAs derived from once recrystallized lactide were slightly higher than those of PLLAs derived from twice recrystallized lactide. A similar result was found by the authors in a previous study based on L-lactide of the same origin.35 Concerning the Tm's and ΔHm's, a systematic difference between PLLAs derived from once or twice recrystallized lactide was not detected considering the scattering of the measurements taken from different pieces of the same sample. In fact, the cautiousness to recrystallize L-lactide twice for the screening of the catalysts (Table 1) was not necessary.
000 for the SnBiph-catalyzed starting material (no. 1 and 5, Table 7). Unexpectedly, the Mw's obtained from the PLLAs derived from once recrystallized lactide were slightly higher than those of PLLAs derived from twice recrystallized lactide. A similar result was found by the authors in a previous study based on L-lactide of the same origin.35 Concerning the Tm's and ΔHm's, a systematic difference between PLLAs derived from once or twice recrystallized lactide was not detected considering the scattering of the measurements taken from different pieces of the same sample. In fact, the cautiousness to recrystallize L-lactide twice for the screening of the catalysts (Table 1) was not necessary.
| Exp. no. | Temp. (°C) | Time (h) | M n | M w | T m (°C) | ΔHm (J g−1) | Cryst. (%) | L (nm) | l c (nm) |
|---|---|---|---|---|---|---|---|---|---|
| 1 | 160 | 24 | 71![[thin space (1/6-em)]](https://www.rsc.org/images/entities/char_2009.gif) 000 000 |
153![[thin space (1/6-em)]](https://www.rsc.org/images/entities/char_2009.gif) 000 000 |
191.6 | 57.0 | 55 | 36.0 | 20 |
| 2 | +170 | 4 | 26![[thin space (1/6-em)]](https://www.rsc.org/images/entities/char_2009.gif) 500 500 |
64![[thin space (1/6-em)]](https://www.rsc.org/images/entities/char_2009.gif) 500 500 |
188.6 | 73.5 | 69 | 33.5 | 23 |
| 3 | +170 | 22 | 35![[thin space (1/6-em)]](https://www.rsc.org/images/entities/char_2009.gif) 500 500 |
76![[thin space (1/6-em)]](https://www.rsc.org/images/entities/char_2009.gif) 000 000 |
192.4 | 82.5 | 78 | 33 | 26 |
| 4 | +180 | 4 | 21![[thin space (1/6-em)]](https://www.rsc.org/images/entities/char_2009.gif) 000 000 |
59![[thin space (1/6-em)]](https://www.rsc.org/images/entities/char_2009.gif) 500 500 |
186.7 | 72.0 | 68 | 32 | 22 |
| 5 | 160 | 24 | 63![[thin space (1/6-em)]](https://www.rsc.org/images/entities/char_2009.gif) 000 000 |
141![[thin space (1/6-em)]](https://www.rsc.org/images/entities/char_2009.gif) 000 000 |
194.0 | 79.3 | 75 | 29 | 22 |
| 6 | +170 | 4 | 27![[thin space (1/6-em)]](https://www.rsc.org/images/entities/char_2009.gif) 000 000 |
61![[thin space (1/6-em)]](https://www.rsc.org/images/entities/char_2009.gif) 000 000 |
189.5 | 78.8 | 74 | 30 | 22 |
| 7 | +170 | 22 | 29![[thin space (1/6-em)]](https://www.rsc.org/images/entities/char_2009.gif) 000 000 |
68![[thin space (1/6-em)]](https://www.rsc.org/images/entities/char_2009.gif) 000 000 |
193.3 | 91.0 | 86 | 29.5 | 25 |
| 8 | +180 | 4 | 23![[thin space (1/6-em)]](https://www.rsc.org/images/entities/char_2009.gif) 000 000 |
56![[thin space (1/6-em)]](https://www.rsc.org/images/entities/char_2009.gif) 000 000 |
187.5 | 73.0 | 69 | 31 | 22 |
| Exp. no. | Temp. (°C) | Time (h) | M n | M w | T m (°C) | ΔHm (J g−1) | Cryst. (%) | L (nm) | l c (nm) |
|---|---|---|---|---|---|---|---|---|---|
| 1 | 160 | 24 | 98![[thin space (1/6-em)]](https://www.rsc.org/images/entities/char_2009.gif) 000 000 |
248![[thin space (1/6-em)]](https://www.rsc.org/images/entities/char_2009.gif) 000 000 |
197.7 | 73.3 | 69 | 40.0 | 28 |
| 2 | +170 | 4 | 46![[thin space (1/6-em)]](https://www.rsc.org/images/entities/char_2009.gif) 500 500 |
154![[thin space (1/6-em)]](https://www.rsc.org/images/entities/char_2009.gif) 000 000 |
194.5 | 79.3 | 75 | 36.5 | 27/28 |
| 3 | +170 | 22 | 40![[thin space (1/6-em)]](https://www.rsc.org/images/entities/char_2009.gif) 500 500 |
131![[thin space (1/6-em)]](https://www.rsc.org/images/entities/char_2009.gif) 000 000 |
194.0 | 84.7 | 80 | 35.0 | 28 |
| 4 | +180 | 4 | 45![[thin space (1/6-em)]](https://www.rsc.org/images/entities/char_2009.gif) 000 000 |
127![[thin space (1/6-em)]](https://www.rsc.org/images/entities/char_2009.gif) 000 000 |
194.2 | 82.4 | 78 | 38.0 | 29/30 |
| 5 | 160 | 24 | 93![[thin space (1/6-em)]](https://www.rsc.org/images/entities/char_2009.gif) 000 000 |
231![[thin space (1/6-em)]](https://www.rsc.org/images/entities/char_2009.gif) 000 000 |
196.2 | 82.3 | 78 | 36.0 | 28 |
| 6 | +170 | 4 | 55![[thin space (1/6-em)]](https://www.rsc.org/images/entities/char_2009.gif) 000 000 |
138![[thin space (1/6-em)]](https://www.rsc.org/images/entities/char_2009.gif) 000 000 |
193.6 | 81.0 | 77 | 33.0 | 26/27 |
| 7 | +170 | 22 | 35![[thin space (1/6-em)]](https://www.rsc.org/images/entities/char_2009.gif) 500 500 |
96![[thin space (1/6-em)]](https://www.rsc.org/images/entities/char_2009.gif) 000 000 |
193.7 | 89.0 | 84 | 31.5 | 27 |
| 8 | +180 | 4 | 45![[thin space (1/6-em)]](https://www.rsc.org/images/entities/char_2009.gif) 000 000 |
117![[thin space (1/6-em)]](https://www.rsc.org/images/entities/char_2009.gif) 000 000 |
193.8 | 82.0 | 78 | 33.0 | 26/27 |
Nonetheless, the experiments compiled in Tables 6 and 7 confirmed two trends already revealed by the data of Tables 4 and 5. Firstly, the highest Tms were obtained from the starting materials directly crystallized from the polymerization. Secondly, annealing at temperatures >160 °C causes degradation of the molecular weights. This degradation has certainly two sources, namely formation of a larger fraction of low molar mass cycles, and second, cleavage of σ-bonds in the PLLA backbone. The cleavage of one single σ-bond suffices to transform a cycle into a linear chain.
In this connection the MALDI TOF mass spectra were of interest. Characterization by this method was focused on the PLLAs prepared by SnCl2, DSTL and SnBiph which were preferentially studied in this work. As illustrated by Fig. 1, the mass spectra of SnCl2-catalyzed PLLAs displayed cycles only in the low molar mass range (<m/z 4000) and seral peaks of linear species at higher masses indicating side reactions in agreement with the relatively low molecular weights. In contrast the mass spectra of the PLLAs prepared with DSTL or SnBiph under relatively moderate annealing conditions (no. 1, Tables 5–7) exclusively display peaks of cycles (Fig. 2A, B and 3A). The MHS measurements confirmed that the high molar mass fraction was also cyclic (see (C), Fig. 4). The formation of cyclic PLLA by cyclic tin catalysts via ring-expansion polymerization (see (a) + (b) in Fig. 2) has been published previously.33–35,37 In contrast to these previous measurements, where the samples were isolated after 1–3 h in this study a more extensive annealing of 22 h was performed. The mass spectra displayed in Fig. 3B and C demonstrate that annealing at 170 or 180 °C entails appearance of a linear species in the low molar mass range, but the intrinsic viscosity measurements prove that the cyclic topology was not seriously damaged (curve (D), Fig. 4). However, with DSTL as catalyst partial degradation of the cycles was more pronounced.
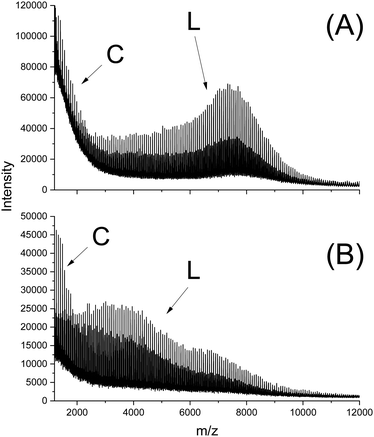 | ||
| Fig. 1 MALDI TOF mass spectra of PLLA prepared with SnCl2: (A) after annealing at 180 °C/4 h (no. 4, Table 3), (B) after annealing at 187 °C/1.5 h (no. 6, Table 3). | ||
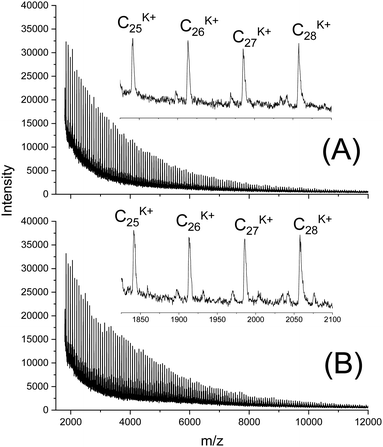 | ||
| Fig. 2 MALDI TOF mass spectra of PLLAs prepared with DSTL at 160 °C/22 h: (A) LLA 1× recrystallized (no. 1, Table 6), (B) LLA 2× recrystallized (no. 5, Table 6). | ||
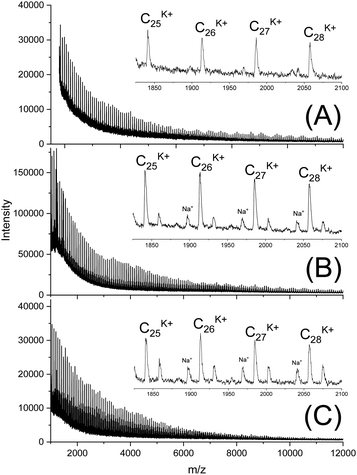 | ||
| Fig. 3 MALDI TOF mass spectra of PLLAs prepared with SnBiph at 160 °C/22 h (A) LLA 2× recrystallized (no. 1, Table 7), (B) after annealing at 170 °C/22 h (no. 7, Table 7), (C) after annealing at 180 °C/4 h (no. 8, Table 8). | ||
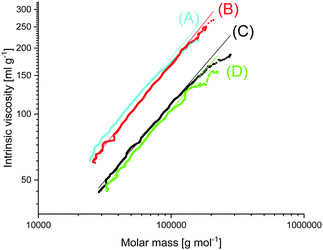 | ||
| Fig. 4 MHS plots of (A) Purapol L 105, (B) PLLA initiated with ethyl L-lactate (no. 4, Table 10), (C) PLLA catalyzed with SnBiph (no. 5, Table 7), (D) after annealing at 170 °C/22 h (no. 7, Table 7). | ||
Evaluation of SAXS measurements
It has recently been demonstrated by the authors30 that cyclic PLLAs prepared at 160 or 170 °C with short times (1–3 h) quenched to ca. 50 °C and annealed at 120 °C crystallize in the low melting morphology (LTm) with Tm's below 176 °C. For this kinetically controlled standard morphology crystal thicknesses (lc) in the range of 8–12 nm are characteristic. For the high melting (HTm) morphology (Tm's >190 °C) lc values in the range of 20–34 nm were found.29–31 Samples having intermediate Tm's show intermediate lc values. The SAXS measurements of the 11 PLLAs listed in Table 1 fit well into this picture. Samples having Tm's in the range of 184–189 °C gave lc values in the range of 16–20 nm, whereas samples with Tm's >190 °C showed lc values above 20 nm.Furthermore, the PLLAs listed in Tables 6 and 7 were characterized by SAXS measurements. Interestingly, the data recorded from DSTL catalyzed PLLAs displayed a systematic difference. On the average, the DSTL samples had lower lc values in combination with lower Tm's and lower molecular weights. The samples having the highest Tm's (no. 1 and 5, Table 7) also gave the highest lc values. A correlation between higher Mw's and higher Tm's has already been tentatively assumed for the results of Tables 4 and 5. The data summarized in Tales 6 and 7 support this assumption and extend it to lc values. An exemplary illustration of the SAXS curves recorded in this work is given in Fig. 5 and 6. The existence of a second order reflex in most SAXS curves indicates a high degree of 3-dimensional order inside the spherulites.
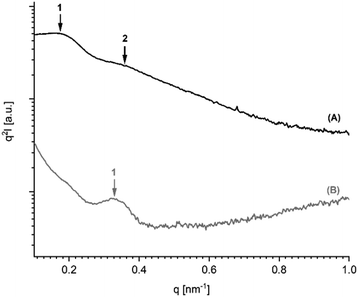 | ||
| Fig. 5 SAXS curves (Kratky plots) of PLLAs polymerized with DSTL: (A) polymerized at 160 °C/22 h (no. 1, Table 6), (B) annealed at 187 °C/1.5 h (no. 6, Table 4). | ||
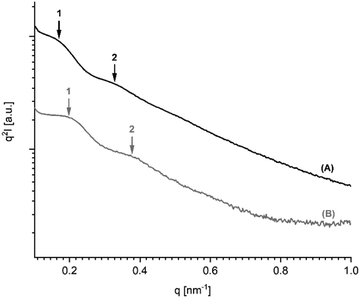 | ||
| Fig. 6 SAXS curves (Kratky plots) of PLLAS prepared with SnBiph: (A) from 1× recrystallized LA (no. 1, Table 7), (B) from 2× recrystallized LA (no. 5, Table 7). | ||
About the equilibrium melting temperature (Tm0) and melting enthalpy, ΔHm0
Beginning with Penning and coworkers12,13 several research groups have extrapolated the equilibrium melting temperature (Tm0) of ideal PLLA crystals from the Tm's of their real samples (Hoffmann–Weeks method). Table 8 summarizes the published data. The DSC measurements of this work yield Tm's up to 198 °C defined as maximum of the endotherm at a heating rate of 10 K min−1 (as usual). The high temperature end of the endotherm hits the base line around 204–205 °C suggesting that a small fraction (∼1%) of crystallites is present melting in the range of 200–203 °C from these results it may be concluded that all Tm0 values below 210 °C are too low, whereas Tm0's in the range of 211–215 °C (calculated by four groups) seem to be realistic.| Authors | Ref. | Species | M w or Mv | T m0 |
|---|---|---|---|---|
| a M w. b M v. c Two different methods were used. | ||||
| Kalb, Penning | 12 | L-PLLA | 350![[thin space (1/6-em)]](https://www.rsc.org/images/entities/char_2009.gif) 000b 000b |
215 |
| Vasanthakumari | 14 | L-PLLA | 350![[thin space (1/6-em)]](https://www.rsc.org/images/entities/char_2009.gif) 000b 000b |
207 |
| Tsuji, Ikada | 18 | L-PLLA | 1![[thin space (1/6-em)]](https://www.rsc.org/images/entities/char_2009.gif) 330 330![[thin space (1/6-em)]](https://www.rsc.org/images/entities/char_2009.gif) 000a 000a |
211 |
| Tsuji, Ikada | 42 | L-PLLA | 1![[thin space (1/6-em)]](https://www.rsc.org/images/entities/char_2009.gif) 330 330![[thin space (1/6-em)]](https://www.rsc.org/images/entities/char_2009.gif) 000a 000a |
205 |
| Tsuji, Ikada | 11 | L-PLLA | 50![[thin space (1/6-em)]](https://www.rsc.org/images/entities/char_2009.gif) 000–60 000–60![[thin space (1/6-em)]](https://www.rsc.org/images/entities/char_2009.gif) 000a 000a |
200 |
| Tsuji, Ikada | 43 | L-PLLA | 400![[thin space (1/6-em)]](https://www.rsc.org/images/entities/char_2009.gif) 000–500 000–500![[thin space (1/6-em)]](https://www.rsc.org/images/entities/char_2009.gif) 000a 000a |
215 |
| Huang et al. | 44 | L-PLLA | 127![[thin space (1/6-em)]](https://www.rsc.org/images/entities/char_2009.gif) 000a 000a |
214/215 |
| Iannace, Nicolas | 45 | L-PLLA | No inform. | 206 |
| Abe et al. | 46 | L-PLLA | 152![[thin space (1/6-em)]](https://www.rsc.org/images/entities/char_2009.gif) 000a 000a |
199/227c |
| Abe et al. | 47 | L-PLLA | 152![[thin space (1/6-em)]](https://www.rsc.org/images/entities/char_2009.gif) 000a 000a |
215 |
| Zaldua et al. | 38 | L-PLLA | 18![[thin space (1/6-em)]](https://www.rsc.org/images/entities/char_2009.gif) 300a 300a |
159 |
| Zaldua et al. | 38 | L-PDLA | 18![[thin space (1/6-em)]](https://www.rsc.org/images/entities/char_2009.gif) 000a 000a |
159 |
| Zaldua et al. | 38 | c-PLLA | 16![[thin space (1/6-em)]](https://www.rsc.org/images/entities/char_2009.gif) 800a 800a |
164 |
| Zaldua et al. | 38 | c-PDLA | 16![[thin space (1/6-em)]](https://www.rsc.org/images/entities/char_2009.gif) 900a 900a |
164 |
Particularly low are the Tm0 data of Zaldua et al.38 Those authors studied rather low molar mass PLLAs having end groups that don’t fit into the crystal lattice (designed for “Click cyclization”), and obviously these end groups disturb the crystal lattices to such an extent that experimental Tm's below were recorded.
Several research groups also calculated the ΔHm0 value of ideal crystals (Table 9). The experimental data of this work and a couple of previous publications demonstrate that all ΔHm0 values below 100 J g−1 cannot be correct. The 93 J g−1 value published by Fischer et al.6 nearly 50 years ago was widely used by numerous research groups to determine crystallinities via DSC. The results of this work suggest that a ΔHm0 of 106 J g−1 first used by Sarasua22 and Tsuji23 is reasonable, although its origin is not clear, because the reference cited by those authors (ref. 39 in this work) does not mention the origin of this ΔHm0 value. Taking the 106 J g−1 value serious means, in turn, that the crystallinities calculated via the “Fischer value” overestimate the true crystallinities by 10–15%.
| Authors | Ref. | Species | M w or Mv | ΔHm0 (J g−1) |
|---|---|---|---|---|
| a M w. b M v. | ||||
| Fischer et al. | 6 | L-PLLA | ∼100![[thin space (1/6-em)]](https://www.rsc.org/images/entities/char_2009.gif) 000b 000b |
93 |
| Miyake, Masuko | 48 | L-PLLA | 50![[thin space (1/6-em)]](https://www.rsc.org/images/entities/char_2009.gif) 000–200 000–200![[thin space (1/6-em)]](https://www.rsc.org/images/entities/char_2009.gif) 000a 000a |
135 |
| Pyda et al. | 21 | L-PLLA | — | 91 |
| Sarasua et al. | 22 | L-PLLA | ∼30![[thin space (1/6-em)]](https://www.rsc.org/images/entities/char_2009.gif) 000a 000a |
106 |
| Sugai et al. | 40 | L-PLLA | <4000a | 60 |
| Sugai et al. | 40 | L-PDLA | <4000a | 68 |
| Sugai et al. | 40 | c-PLLA | <4000a | 44 |
| Sugai et al. | 40 | c-PDLA | <4000a | 44 |
Comparison of cyclic and linear polylactides
Finally, a comparison of cyclic and linear polylactides with regard to Tm, Tm0, ΔHm and ΔHm0 should be discussed. Sugai et al.40 also determined ΔHm0 values for cyclic PPLLAs and PDLLAs and compared them with the ΔHm0 values of linear chains having identical molecular weights and dispersities, because the cycles were prepared by photochemical end-to-end cyclization of the linear precursors. Due to this synthetic strategy the molecular weights were extremely low (M's ∼ 4000) Hence, the functional end groups of the linear chains and the guest units in the cycles had a strong influence on the physical properties, so that extremely low Tm and ΔHm values were found (Table 9). A similar strategy was used by Zaldua et al.38 using a “Click Reaction” for cyclization of a linear precursor. The molecular weights were higher (Table 8) but still much lower than those of the polylactides studied in this work. Therefore, end groups and guest units still depressed Tm and ΔHm values far below the values listed in this work. Whereas Sugai found higher Tm's and ΔHm's for the linear species, Zaldua reported the opposite trend. In other words, these so-called. Model compounds are in fact not suited as models of high molar mass homo-PLLAs. A comparison of cyclic and linear PLLAs was also reported by Louisy et al.41 with higher Tm and ΔHm values for the linear chains. However, those authors did prove that their cyclic PLLA mainly consists of cycles because a MALDI TOF mass spectrum up to a mass of m/z 2500 was presented as the only evidence for a cyclic topology. However, such a characterization does not suffice as demonstrated by Fig. 4 (curves A and B) and Fig. 7 of this work. Furthermore, no information about the optical purity of their polylactides was provided, although a slightly basic catalyst was used, which might have partially racemized the monomer.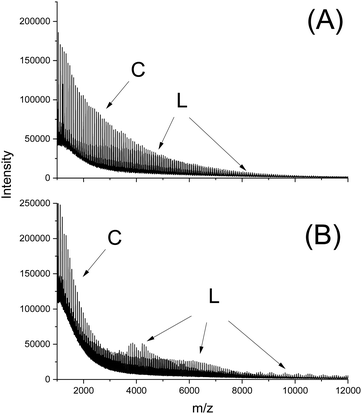 | ||
| Fig. 7 MALDI TOF mass spectra of alcohol-initiated PLLAs: (A) purapol L105 initiated with propanol, (B) PLLA initiated with ELA and catalyzed with SnBiph (no. 4, Table 10). | ||
In this work, the highest Tm and ΔHm values were obtained for cyclic PLLAs resulting from REP catalyzed by DSTL and SnBiPh (Tables 1, 4, 5 and 6), In order to obtain a reasonable basis for a comparison of cyclic and linear chains having at least Mw's around 100![[thin space (1/6-em)]](https://www.rsc.org/images/entities/char_2009.gif) 000, two series of ROPs initiated with ethyl L-lactate and catalyzed by SnBiph were performed (Scheme 2(c) and Table 10). These conditions were used, because the ethyl end group does not cause a significant defect inside the crystal lattice of PLLA and because SnBiph proved to be the optimum catalyst for the preparation of alcohol-initiated PLLAs that crystallize spontaneously from the reaction mixture at 160 °C, a goal which cannot be achieved with SnOct2.31 In the first series of ROPs (no. 1–4, Table 10) the catalyst concentration was kept constant, and the LA/In ratio was varied. It was found that Tm increases substantially with higher molecular weights, i.e., values up to 196.5 °C were recorded for the PLLA with the highest Mw (no. 4, Table 10).
000, two series of ROPs initiated with ethyl L-lactate and catalyzed by SnBiph were performed (Scheme 2(c) and Table 10). These conditions were used, because the ethyl end group does not cause a significant defect inside the crystal lattice of PLLA and because SnBiph proved to be the optimum catalyst for the preparation of alcohol-initiated PLLAs that crystallize spontaneously from the reaction mixture at 160 °C, a goal which cannot be achieved with SnOct2.31 In the first series of ROPs (no. 1–4, Table 10) the catalyst concentration was kept constant, and the LA/In ratio was varied. It was found that Tm increases substantially with higher molecular weights, i.e., values up to 196.5 °C were recorded for the PLLA with the highest Mw (no. 4, Table 10).
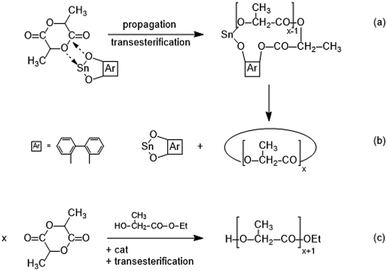 | ||
| Scheme 2 Simplified illustration of a SnBiph-catalyzed REP ((a) + (b)) and an alcohol-initiated ROP ((c)). | ||
| Exp. no. | LA/Cat | LA/In | Temp. (°C) | Time (h) | M n | M w | T m (°C) | ΔHm (J g−1) | Crystallinity (%) |
|---|---|---|---|---|---|---|---|---|---|
| a For the DSC measurements three pieces from different places of the same sample (disk) were taken. | |||||||||
| 1 | 1000/1 | 100/1 | 160 | 22 | 20![[thin space (1/6-em)]](https://www.rsc.org/images/entities/char_2009.gif) 500 500 |
33![[thin space (1/6-em)]](https://www.rsc.org/images/entities/char_2009.gif) 500 500 |
183.2 | 81.8 | 78 |
| 2 | 1000/1 | 200/1 | 160 | 22 | 33![[thin space (1/6-em)]](https://www.rsc.org/images/entities/char_2009.gif) 000 000 |
62![[thin space (1/6-em)]](https://www.rsc.org/images/entities/char_2009.gif) 500 500 |
190.4 | 89.0 | 84 |
| 3a | 1000/1 | 300/1 | 160 | 22 | 41![[thin space (1/6-em)]](https://www.rsc.org/images/entities/char_2009.gif) 500 500 |
91![[thin space (1/6-em)]](https://www.rsc.org/images/entities/char_2009.gif) 000 000 |
192.6 | 91.0 | 86 |
| 193.0 | 91.7 | 87 | |||||||
| 193.8 | 91.1 | 86 | |||||||
| 4a | 1000/1 | 400/1 | 160 | 22 | 67![[thin space (1/6-em)]](https://www.rsc.org/images/entities/char_2009.gif) 000 000 |
136![[thin space (1/6-em)]](https://www.rsc.org/images/entities/char_2009.gif) 000 000 |
195.0 | 84.6 | 80 |
| 195.3 | 87.1 | 83 | |||||||
| 196.5 | 92.2 | 87 | |||||||
| 5A | 2000/1 | 300/1 | 160 | 22 | 40![[thin space (1/6-em)]](https://www.rsc.org/images/entities/char_2009.gif) 000 000 |
99![[thin space (1/6-em)]](https://www.rsc.org/images/entities/char_2009.gif) 500 500 |
192.8 | 84.7 | 80 |
| 5B | 2000/1 | 300/1 | +160 | 22 | — | — | 194.0 | 95.0 | 90 |
| 5C | 2000/1 | 300/1 | +170 | 4 | — | — | 190.4 | 92.3 | 87 |
| 5C | 2000/1 | 300/1 | +170 | 22 | — | — | 191.2 | 84.7 | 80 |
| 5D | 2000/1 | 300/1 | +180 | +4 | — | — | 193.3 | 82.0 | 78 |
The MALDI TOF mass spectra revealed formation of cycles (Fig. 7B), the fraction of which increased with decreasing initiator concentration (higher LA/In ratios). Nonetheless, measurements of the intrinsic viscosity proved the predominance of linear chains in all samples (curve B in Fig. 4). The existence of a considerable molar (but low weight) fraction of cycles in the low molar mass range of alcohol-initiated high molar mass PLLAs is quite normal as demonstrated for the commercial sample PURAPOL L105 (curve A, Fig. 4). Similar results were obtained from other commercial PLLAs such as NW 3251 D or NW 3001 D.
The second series illustrates the influence of annealing at higher temperatures in analogy to the experiments listed in Tables 3–7. In analogy to the results found for cyclic PLLAs annealing did not enhance the Tm values. Once again, the highest Tm's were obtained by direct crystallization from the polymerization. The ΔHm values of the ethyl lactate-initiated ROPS were comparable with those found for the cyclic PLLAs. One may interpret these results, so that the Tm's of the cyclic PLLAs are 1.0–2.0 °C higher than those of their linear counterparts with similar molecular weights (Mw's 100![[thin space (1/6-em)]](https://www.rsc.org/images/entities/char_2009.gif) 000–170
000–170![[thin space (1/6-em)]](https://www.rsc.org/images/entities/char_2009.gif) 000), but even when this interpretation is correct, one has to consider that this small difference will vanish at higher molecular weights (Mw > 500
000), but even when this interpretation is correct, one has to consider that this small difference will vanish at higher molecular weights (Mw > 500![[thin space (1/6-em)]](https://www.rsc.org/images/entities/char_2009.gif) 000). The crystallites formed by extremely high molar mass cyclic and linear PLLAs will become identical, because the long linear chains have to fold many times, so that the surface of the crystallites will be covered by loops quite analogous to crystallites based on cyclic PLLAs, and the number of defects inside the crystallites will tend towards zero.
000). The crystallites formed by extremely high molar mass cyclic and linear PLLAs will become identical, because the long linear chains have to fold many times, so that the surface of the crystallites will be covered by loops quite analogous to crystallites based on cyclic PLLAs, and the number of defects inside the crystallites will tend towards zero.
Conclusions
The results of this work allow for the following conclusions. First, variation of the catalyst revealed that SnCl2, DSTL and SnBiph are best suited to yield high Tm PLLA. Second, direct crystallization from the polymerization process is particularly favourable to achieve high Tms, and in this way Tms around 197–198 °C were obtained Third, high ΔHm values are best obtained by annealing at 170 or 180 °C, whereupon ΔHms in the range of 92–97 J g−1 were achieved corresponding to crystallinities of around 90%. Fourth, decisive for optimum results is the presence of a reactive polymerization/transesterification catalyst which enhances crystal thickness, reduces the surface free energy by smoothing of the crystal surface and improves the 3d-order of crystallites in the spherulites. Fifth comparison with equilibrium melting temperatures of ideal crystals (Tm0) reported in the literature indicates that Tm0 values below 210 °C are too low and a value of 213+/−2 °C shows the best agreement with the experimental Tms. Sixth, comparison of the experimental melting enthalpies with ΔHm0 values calculated by several research groups indicates that all ΔHm0s below 100 J g−1 are too low, whereas 106 J g−1 advocated by two research groups gives a reasonable fit. Seventh, cyclic and linear poly(L-lactide)s possess nearly identical Tm and ΔHm values for Mw's > 100![[thin space (1/6-em)]](https://www.rsc.org/images/entities/char_2009.gif) 000.
000.
Author contributions
HRK – conceptualization, project administration, investigation, writing original draft, SMW – investigation, data curation, resources, visualization, writing – review & editing, AM – investigation, data curation, resources, visualization.Conflicts of interest
There are no conflicts to declare.Acknowledgements
We thank A. Myxa (BAM, Berlin) for the GPC measurements and S. Bleck (TMC, Hamburg) for the DSC measurements. We also thank Prof. G. Luinstra (TMC, Hamburg) for financial and the BAM for technical support.Notes and references
- G. Kharas, F. Sanchez-Riera and D. Severson, Polymers of Lactic Acid in Plastics from Microbes, ed. D. P. Mobley, Hanser Gardner Publications, Inc., 1994 Search PubMed.
- K. Masutani and Y. Kimura, Synthesis, 2017, 1–25 Search PubMed.
- J. Tan, M. A. Abdel-Rahman and K. Sonomoto, Synthesis, 2017, 27–66 Search PubMed.
- R. A. Auras, L.-T. Lim, S. E. Selke and H. Tsuji, Poly (lactic acid): synthesis, structures, properties, processing, and applications, John Wiley & Sons, 2011 Search PubMed.
- M. L. Di Lorenzo and R. Androsch, Synthesis, Structure and Properties of Poly (lactic acid), Springer International Publishing, Cham, 2018 Search PubMed.
- E. Fischer, H. J. Sterzel and G. Wegner, Kolloid Z. Z. Polym., 1973, 251, 980–990 CrossRef CAS.
- D. M. Bigg, Presented in part at the Annual Technical Conference of the Society of Plastic Engineers, 1996.
- J. J. Kolstad, J. Appl. Polym. Sci., 1996, 62, 1079–1091 CrossRef CAS.
- L.-I. Palade, H. J. Lehermeier and J. R. Dorgan, Macromolecules, 2001, 34, 1384–1390 CrossRef CAS.
- J. R. Dorgan, J. Janzen, M. P. Clayton, S. B. Hait and D. M. Knauss, J. Rheol., 2005, 49, 607–619 CrossRef CAS.
- H. Tsuji and Y. Ikada, Macromol. Chem. Phys., 1996, 197, 3483–3499 CrossRef CAS.
- B. Kalb and A. J. Pennings, Polymer, 1980, 21, 607–612 CrossRef CAS.
- K. Kishore, R. Vasanthakumari and A. J. Pennings, J. Polym. Sci., Polym. Phys. Ed., 1984, 22, 537–542 CrossRef CAS.
- R. Vasanthakumari and A. Pennings, Polymer, 1983, 24, 175–178 CrossRef CAS.
- W. Hoogsteen, A. Postema, A. Pennings, G. Ten Brinke and P. Zugenmaier, Macromolecules, 1990, 23, 634–642 CrossRef CAS.
- K. Jamshidi, S. H. Hyon and Y. Ikada, Polymer, 1988, 29, 2229–2234 CrossRef CAS.
- H. Tsuji, F. Horii, M. Nakagawa, Y. Ikada, H. Odani and R. Kitamaru, Macromolecules, 1992, 25, 4114–4118 CrossRef CAS.
- H. Tsuji and Y. Ikada, Polymer, 1995, 36, 2709–2716 CrossRef CAS.
- H. Tsuji, K. Ikarashi and N. Fukuda, Polym. Degrad. Stab., 2004, 84, 515–523 CrossRef CAS.
- Y. Ohtani, K. Okumura and A. Kawaguchi, J. Macromol. Sci., Part B: Phys., 2003, 42, 875–888 CrossRef.
- M. Pyda, R. Bopp and B. Wunderlich, J. Chem. Thermodyn., 2004, 36, 731–742 CrossRef CAS.
- J. R. Sarasua, N. L. Rodriguez, A. L. Arraiza and E. Meaurio, Macromolecules, 2005, 38, 8362–8371 CrossRef CAS.
- H. Tsuji, Macromol. Biosci., 2005, 5, 569–597 CrossRef CAS PubMed.
- M. L. Di Lorenzo, J. Appl. Polym. Sci., 2006, 100, 3145–3151 CrossRef CAS.
- M. Pyda and A. Czerniecka-Kubicka, Synthesis, 2017, 153–193 Search PubMed.
- B. Lotz, Adv. Polym. Sci., 2018, 279, 273–302 CrossRef.
- S. Xu, J.-F. Tahon, I. De-Waele, G. Stoclet and V. Gaucher, eXPRESS Polym. Lett., 2020, 14 Search PubMed.
- P. DeSantis and A. J. Kovacs, Biopolymers, 1968, 6, 299–306 CrossRef CAS PubMed.
- H. R. Kricheldorf, S. M. Weidner and A. Meyer, Polym. Chem., 2020, 11, 2182–2193 RSC.
- S. M. Weidner, A. Meyer, S. Chatti and H. R. Kricheldorf, RSC Adv., 2021, 11, 2872–2883 RSC.
- H. R. Kricheldorf, S. M. Weidner and A. Meyer, RSC Adv., 2021, 11, 14093–14102 RSC.
- S. M. Weidner, A. Meyer, J. Falkenhagen and H. R. Kricheldorf, Eur. Polym. J., 2021, 153, 110508 CrossRef CAS.
- H. R. Kricheldorf, S. M. Weidner and F. Scheliga, Polym. Chem., 2017, 8, 1589–1596 RSC.
- H. R. Kricheldorf and S. M. Weidner, Eur. Polym. J., 2019, 119, 37–44 CrossRef CAS.
- H. Kricheldorf, S. M. Weidner and F. Scheliga, Eur. Polym. J., 2019, 116, 256–264 CrossRef CAS.
- G. Benecke, W. Wagermaier, C. Li, M. Schwartzkopf, G. Flucke, R. Hoerth, I. Zizak, M. Burghammer, E. Metwalli and P. Müller-Buschbaum, J. Appl. Crystallogr., 2014, 47, 1797–1803 CrossRef CAS PubMed.
- A. Meyer, S. M. Weidner and H. R. Kricheldorf, Polymer, 2021, 231, 124122 CrossRef CAS.
- N. Zaldua, R. Liénard, T. Josse, M. Zubitur, A. Mugica, A. Iturrospe, A. Arbe, J. De Winter, O. Coulembier and A. J. Müller, Macromolecules, 2018, 51, 1718–1732 CrossRef CAS.
- G. Loomis, Polym. Prepr., 1990, 31, 55 Search PubMed.
- N. Sugai, S. Asai, Y. Tezuka and T. Yamamoto, Polym. Chem., 2015, 6, 3591–3600 RSC.
- E. Louisy, G. Fontaine, V. Gaucher, F. Bonnet and G. Stoclet, Polym. Bull., 2020, 1–21 Search PubMed.
- H. Tsuji and Y. Ikada, J. Appl. Polym. Sci., 1995, 58, 1793–1802 CrossRef CAS.
- H. Tsuji and Y. Ikada, Macromolecules, 1993, 26, 6918–6926 CrossRef CAS.
- J. Huang, M. S. Lisowski, J. Runt, E. S. Hall, R. T. Kean, N. Buehler and J. Lin, Macromolecules, 1998, 31, 2593–2599 CrossRef CAS.
- S. Iannace and L. Nicolais, J. Appl. Polym. Sci., 1997, 64, 911–919 CrossRef CAS.
- H. Abe, Y. Kikkawa, Y. Inoue and Y. Doi, Biomacromolecules, 2001, 2, 1007–1014 CrossRef CAS PubMed.
- H. Abe, M. Harigaya, Y. Kikkawa, T. Tsuge and Y. Doi, Biomacromolecules, 2005, 6, 457–467 CrossRef CAS PubMed.
- T. Miyata and T. Masuko, Polymer, 1997, 38, 4003–4009 CrossRef CAS.
| This journal is © The Royal Society of Chemistry 2022 |

