 Open Access Article
Self-assembly of Boc-p-nitro-L-phenylalanyl-p-nitro-L-phenylalanine and Boc-L-phenylalanyl-L-tyrosine in solution and into piezoelectric electrospun fibers†
Rosa M. F.
Baptista
 *a,
Paulo E.
Lopes
 b,
Ana Rita O.
Rodrigues
 a,
Nuno
Cerca
 c,
Michael S.
Belsley
 a and
Etelvina
de Matos Gomes
 *a
*a
aCentre of Physics, University of Minho, Campus Gualtar, 4710-057 Braga, Portugal. E-mail: rosa_batista@fisica.uminho.pt; emg@fisica.uminho.pt
bInstitute of Polymers & Composites IPC, University of Minho, Campus Azurém, 4804-533 Guimarães, Portugal
cLaboratory of Research in Biofilms Rosário Oliveira (LIBRO), Centre of Biological Engineering (CEB), Campus de Gualtar, University of Minho, Braga, Portugal
First published on 7th February 2022
Abstract
Self-assembly of two N-tert-butoxycarbonyl (Boc) protected analogues of diphenylalanine dipeptide, Boc-p-nitro-L-phenylalanyl-p-nitro-L-phenylalanine and Boc-L-phenylalanyl-L-tyrosine, respectively, Boc-pNPhepNPhe and Boc-PheTyr, in 1,1,1,3,3,3-hexafluoro-2-propanol/ethanol(water) solvents and into electrospun fibers is studied. Uncommon dual self-assembly is found for Boc-pNPhepNPhe, with the formation of nanotubes which in turn self-assemble themselves into microtapes. Boc-PheTyr self-assembles into microspheres or microtapes depending on the solvent. Optical absorption and photoluminescence exhibit step-like peaks in the spectral region of 240–290 nm indicating quantum confinement due to nanostructure formation. The dipeptides were further embedded into electrospun fibers, generating high output voltages through the piezoelectric effect. For Boc-pNPhepNPhe a maximum output voltage of 58 V, a power density of 9 μW cm−2 and effective piezoelectric voltage coefficients geff ≅ 0.6 Vm N−1 were measured under a 1.5 N applied periodical force. Its estimated effective piezoelectric coefficient is twice that of diphenylalanine dipeptide.
Introduction
Novel organic materials obtained by molecular self-assembly through low energy interactions, such as van der Waals bonds, electrostatic interactions, hydrogen bonds and stacking interactions, possess well-ordered supramolecular structures. A versatile method for creating architectures of nanostructured materials, by using amino acids as natural building blocks, is offered by self-assembled peptide-based systems, which are attracting increasing attention due to their biocompatibility and diverse structural and functional properties for applications in a variety of fields from regenerative medicine to fluorescent probes, light energy harvesting and optical waveguiding.1Aromatic and aliphatic dipeptide nanotubes (NTs) are a unique class of bio-inspired nanostructures forming simple and modifiable organic materials, which crystallize into tubular structures with length of hundreds of nanometers and internal diameters of tens of angstroms. These structures result from stacking of molecules through the formation of intermolecular hydrogen bonds between functional groups in the peptide backbone.2
The most studied self-assembled system is L-phenylalanyl-L-phenylalanine or diphenylalanine (hereafter PhePhe)3 which is formed by the self-assembly of the aromatic dipeptide into NTs and other nanostructures,4 such as nanowires5 and nanorods,6 depending on the experimental conditions such as pH and temperature. PhePhe NTs have been integrated in devices for electronic and biosensing applications.7 These nanostructures display unique and extraordinary mechanical properties: they are very stiff with a high averaged point stiffness and Young's modulus of 160 N m−1 and 19–27 GPa respectively, placing them among the stiffest biological materials known.8
A member of the PhePhe dipeptide structural family is Boc-L-phenylalanyl-L-phenylalanine (Boc-PhePhe; where Boc = tert-butoxycarbonyl) that forms various nanoscale structures such as nanospheres (NSs)9 and NTs.10 The remarkable rigidity of both PhePhe and Boc-PhePhe results from “zipper-like” aromatic interlocks interpenetrated inside the NT backbones.11 Calculations performed using density functional theory demonstrated that high Young's modulus in dipeptides is also strongly correlated with the strength and orientation of the hydrogen bond network.12
Moreover, the directional intermolecular π–π interactions and hydrogen-bonding network allow the formation of quantum confined (QC) structures within PhePhe self-assemblies with pronounced exciton effects: quantum dots (QD) appear due to the formation of nanocrystalline regions possessing strong QC properties, leading to a pronounced blue luminescence. These self-assembled QC dipeptides are remarkable and unique, not observed in other aggregation processes of aromatic organic molecules. Photoluminescence (PL) in the UV and blue ranges allows these nanostructures to be promising optical materials for photonic short wavelength devices such as biolasers and light-emitting diodes.13 Apart from glycine, all the amino acids occur naturally as chiral molecular identities and crystallize with acentric symmetry. The lack of a center of symmetry has the implication that the corresponding crystals display properties such as piezoelectricity and optical second harmonic generation. Therefore, dipeptides formed from chiral amino acids are attractive bio-systems for exploring those properties.
PhePhe NTs were reported to display strong anisotropic piezoelectric coefficients due to their anisotropic crystal structure with aligned permanent dipole moments associated with phenyl rings. Having high piezoelectric coefficients (d15 = 60 pC N−1 and d33 = 17.9 pC N−1) makes them attractive candidates for biomedical applications.14,15 Boc-PhePhe when incorporated into electrospun fibers exhibited strong piezoelectric properties.16 The Boc-pNPhepNPhe peptide was reported to self-assemble into nanofibrils and nanospheres.17
In this work we report the self-assembly of two Boc protected analogues of the PhePhe dipeptide: Boc-p-nitro-L-phenylalanyl-p-nitro-L-phenylalanine (Boc-pNPhepNPhe) and Boc-L-phenylalanyl-L-tyrosine (Boc-PheTyr) in solutions of 1,1,1,3,3,3-hexafluoro-2-propanol (HFP) with water or ethanol (0.2/9.8 v/v). Furthermore, through the electrospinning technique18 they were incorporated into polymer micro and nanostructured fibers. We studied their self-assembly inside the polymer matrix and demonstrate the generation of high piezoelectric voltages through the piezoelectric effect.
Results and discussion
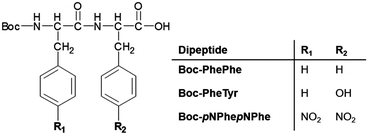
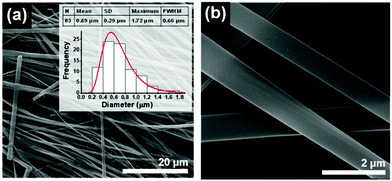
Self-assembly of Boc-PhePhe, Boc-pNPhepNPhe and Boc-PheTyr, Scheme 1, was studied in both aqueous and ethanol solutions (or a mixture of both solvents) after previous dilution in a highly concentrated solution of HFP (100 mg mL−1). Boc-PhePhe forms NTs of 690 nm average thickness and tens of microns length, as shown in Fig. 1(a and b), according to previously reported formation of highly ordered tubular structures.16,19 However, this dipeptide also self-assembles into spheres with diameters ranging from nm to μm, when dissolved in highly concentrated solutions of HFP with subsequent dilution in ethanol.These micrometer size spheres were reported to exhibit a metallic-like point stiffness of 885 N m−1 and a Young's modulus of 275 GPa.10
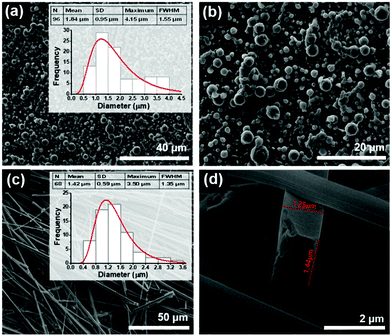
We observed that Boc-PheTyr self-assembles with two different morphologies: as spheres with diameters ranging from nanometers (NS) to micrometers (average diameter 1.68 μm) formed from ethanol/water (2![[thin space (1/6-em)]](https://www.rsc.org/images/entities/char_2009.gif) :
:![[thin space (1/6-em)]](https://www.rsc.org/images/entities/char_2009.gif) 1 v/v) solutions, Fig. 2(a and b) and as long microtapes (MTps) with hundreds of micrometers length and 1.42 μm average thickness from HFP/water (0.2/9.8 v/v) solutions, Fig. 2(c and d).
1 v/v) solutions, Fig. 2(a and b) and as long microtapes (MTps) with hundreds of micrometers length and 1.42 μm average thickness from HFP/water (0.2/9.8 v/v) solutions, Fig. 2(c and d).
Self-assembly into microspheres (MS) obtained from methanol/water (2![[thin space (1/6-em)]](https://www.rsc.org/images/entities/char_2009.gif) :
:![[thin space (1/6-em)]](https://www.rsc.org/images/entities/char_2009.gif) 1) solutions,20 was reported for Boc-PheTyr-OMe which is a Boc-PheTyr analogue with the C-terminus protected by a methyl ester.
1) solutions,20 was reported for Boc-PheTyr-OMe which is a Boc-PheTyr analogue with the C-terminus protected by a methyl ester.
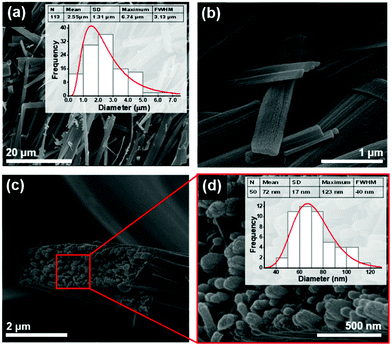
Quite differently, Boc-pNPhepNPhe self-assembles from HFP/water solutions into MTps, but remarkably, each MTp (average thickness 2.55 μm) is in turn formed from self-assembly of NTs with an average diameter of 72 nm, as shown in Fig. 3(a–d). Self-assembled structures with such morphology were, to our knowledge, not reported before for any dipeptide. This is the first dipeptide whose morphology results from a dual self-assembly process, involving first the formation of NTs and afterwards their further self-assembly into larger structures.
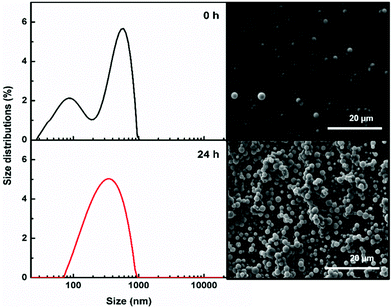
For a better understanding of the dipeptide self-assembly process, the average size distribution of the dipeptide nanostructures was measured by dynamic light scattering (DLS). This technique permits the overall size of particles dispersed in a liquid to be obtained. The dipeptides were dissolved in HFP at room temperature followed by the addition of water to obtain a concentration of 2 mg mL−1, HFP/water (0.2/9.8 v/v). From this solution, 5 μL was immediately removed and deposited on a silicon sheet for subsequent SEM analysis. Another 50 μL was diluted to a concentration of 0.05 mg mL−1 in water and immediately analysed by DLS. This procedure was repeated after 24 h. The results demonstrate that both samples of Boc-PheTyr self-assembled into larger supramolecular structures, several hundred nanometers in size. In the first moments, small amounts of nanospheres were observed with a great dispersion of sizes. After 24 h, there was a significant increase in the number of nanostructures with more uniform sizes (see Fig. 4). The hydrodynamic sizes and zeta potential measured are displayed in Table 1. The intensity weighted particle size distribution and corresponding SEM images of Boc-PheTyr are displayed in Fig. 4 at two different times.
| Dipeptide | Time (h) | Hydrodynamic diameter (nm) | Area intensity (%) | ζ (mV) |
|---|---|---|---|---|
| Boc-PheTyr | 0 | 92.69 ± 28.99 | 31.90 | — |
| 523.30 ± 197.47 | 68.10 | |||
| 24 | 278.62 ± 122.07 | 100.00 | −19.6 ± 1.3 | |
| Boc-pNPhepNPhe | 0 | 78.08 ± 14.08 | 49.51 | — |
| 1098.97 ± 187.42 | 50.49 | |||
| 24 | 241.47 ± 154.80 | 79.88 | −30.10 ± 1.10 | |
| 11502.38 ± 1766.85 | 20.12 |
The self-assembly process for Boc-pNPhepNPhe was faster, and it was possible to see the dynamic formation of nanostructures and microstructures in the first minutes. Comparing the first (0 h) and second (24 h) measurements for Boc-pNPhepNPhe (Fig. S1, ESI†), the supramolecular structures, MTps, were surrounded by other small nanostructures, with sizes of around 32–80 nm, as seen in the SEM image in Fig. S1 (ESI†). After 24 h, the population with average size of around 1 μm increases in size and a new population appears with sizes of around 11 μm corresponding to the formation of bigger structures resulting from the self-assembly of NTs into MTps as discussed before.
The surface charge of a nanostructure is an important parameter as it strongly influences the stability of the dipeptide dispersion. The obtained values of the zeta potential of the dipeptide nanostructures are also presented in Table 1. The dipeptide nanostructures revealed a negative zeta potential, within the same order of magnitude, indicating good stability.
Raman scattering data indicate that the main characteristic bands observed for Boc-PhePhe are also present in Boc-pNPhepNPhe and Boc-PheTyr spectra (Fig. S2–S4, ESI†).21 However, for the Boc-pNPhepNPhe dipeptide some differences are found in the 800–1700 cm−1 region. The ring breathing band at 1003 cm−1 is not present and instead a very intense band at 1345 cm−1 corresponding to the vibrations of the NO2 group, which is covalently bonded to the phenyl benzene ring, is now the most intense band. The presence of the two NO2 groups may hinder the 1003 cm−1 band and deviate it to a new band appearing at 1104 cm−1. For the precursor amino acid Boc-pNPhe the most intense Raman band also appears at 1345 cm−1 (Fig. S4, ESI†). For both Boc-pNPhepNPhe and Boc-PheTyr, the crystalline lattice vibration bands are similar to that of the Boc-PhePhe dipeptide as well as the bands corresponding to the aromatic C–H stretches.
XRD spectra of Boc-PhePhe, Boc-PheTyr and Boc-pNPhepNPhe nanostructures present several Bragg peaks indicating that they are crystalline (Fig. S5, ESI†). Similar to the Boc-PhePhe X-ray pattern, intense Bragg peaks at diffraction angles inferior to 10° are present which are assigned to nanostructure formation.
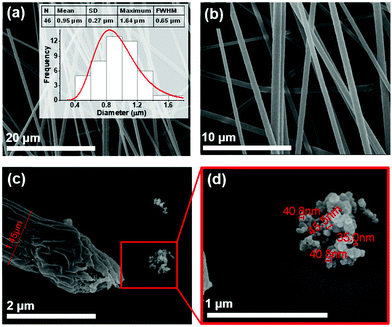
In this work, we also studied the dipeptide self-assembly obtained from rapid crystallization inside fibers fabricated from dipeptide/polymer solutions, using the electrospinning technique under a poling static electric field of order 106 V m−1. It is known that Boc-PhePhe self-assembles into NTs (diameters 25–30 nm) when embedded into PLLA polymer fibers.16 Within the same polymer, Boc-PheTyr self-assembles into NSs with less than 50 nm diameter, as shown in Fig. 5(a–d). The electrospun fibers have an average diameter of 950 nm. Therefore, for this dipeptide, the electrospinning processing conditions determine its self-assembly into NSs which are piezoelectric, meaning that their crystal structure lacks a centre of symmetry as will be discussed later. PLLA fibers with embedded Boc-pNPhepNPhe were fabricated from two precursor solutions with different dipeptide concentrations (see the Experimental section).
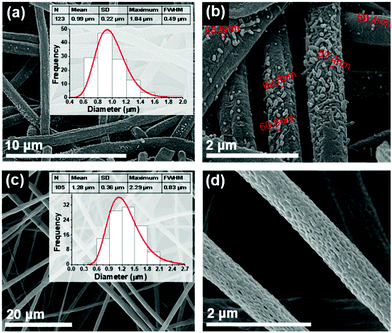
From a highly concentrated solution, fibers with an average diameter of 990 nm revealed the self-assembly into NTs (diameter in the range from 50 to 70 nm as shown in Fig. 6(a and b) occurring both in the interior as well on the fiber surface. Fibers free of surface dipeptide crystallization, with higher porosity and larger diameters (1.28 μm) were fabricated from the lower concentration precursor solutions, Fig. 6(c and d), with all the dipeptide crystallized in the fiber interior.
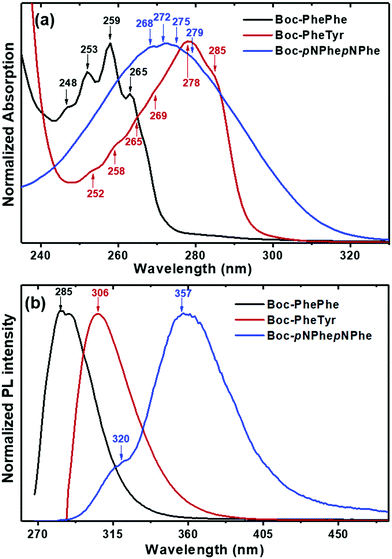
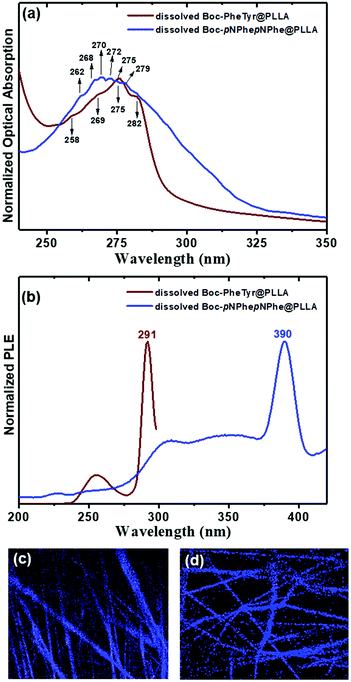
Combined optical absorption (OA), photoluminescence (PL) and photoluminescence excitation (PLE) studies in HFP/water, HFP/ethanol and water/ethanol solutions were carried out at 298 K, aiming at studying the photophysical characteristics of the three dipeptides on evidencing nanostructure quantum confinement (QC) due to self-assembly with the formation of nanocrystalline regions.22 The OA bands for the three dipeptides are centred between 240 and 320 nm, Fig. 7(a). The spectrum of Boc-PhePhe shows the reported characteristic four spike-like peaks located at 248 nm (5.0 eV), 253 nm (4.90 eV), 259 nm (4.79 eV) and 265 nm (4.68 eV) with wavelength differences of 5–7 nm (energy difference of 0.10–0.11 eV) between adjacent peaks, which are evidence of strong QC during the self-assembly process in ethanol16 and HFP/ethanol solutions.23 These features of absorption spectra are determined by electron–hole formation with strong Coulomb binding energy, and the presence of spike-like peaks indicates the formation of quantum dots (QDs) in the self-assembled dipeptide structures.16,24 The spectrum of Boc-PheTyr shows instead six step-like peaks located at 252 nm (4.92 eV), 258 nm (4.81 eV), 265 nm (4.68 eV), 269 nm (4.61 eV), 278 nm (4.46 eV) and 285 nm (4.35 eV) with energy difference in the range of 4–9 nm (energy difference of 0.15 to 0.09 eV). For Boc-pNPhepNPhe, four much less pronounced step-like peaks appear at 268 nm (4.63 eV), 272 nm (4.56 eV), 275 nm (4.51 eV) and 279 nm (4.44 eV) with wavelength differences of 3–5 nm (energy difference of 0.08–0.05 eV). These step-like features indicate the formation of two-dimensional quantum wells (2D QWs) inside Boc-PheTyr and Boc-pNPhepNPhe MTps. The size and morphology of the self-assembled structures shown in Fig. 1–4 are consistent with the spike-like and step-like features found in OA spectra where a broadening of the OA band is observed to increase from Boc-PhePhe to Boc-pNPhepNPhe and may be associated with the formation of micrometer size structures. These exhibit the characteristics of QC structures inside the self-assembled nano and microstructured dipeptide materials.24 The energy of an electron/hole pair defines the optical absorption properties of crystalline materials. In QC structures, either the density of electronic states as a function of energy is described by separated spikes (case of QDs) or step-like (case of QWs) features in the OA spectrum, as reported for N-(9-fluorenylmethyloxycabonyl)-PhePhe hydrogels.25
PL spectra were recorded under excitation at the maximum absorption wavelength, Fig. 7(b). As reported before for PhePhe self-assembled nanostructures,6 a deep ultra-violet (UV) peak is observed for Boc-PhePhe and Boc-PheTyr. For Boc-pNPhepNPhe the peak is in the UV region. The Boc-PhePhe spectrum, under excitation at 259 nm, exhibits a peak located at 285 nm which is red-shifted by 26 nm. A similar peak shift (28 nm) occurs for Boc-PheTyr. However, the Boc-pNPhepNPhe PL spectrum shows two emission bands, one less intense at 320 nm and an intense peak at 357 nm, corresponding to red shifts respectively of 48 nm and 85 nm. Table 2 summarizes the OA and PL spectral features for the dipeptides under study.
| Dipeptide | λ abs [nm] | λ exc [nm] | λ emi [nm] | Red shift [nm] |
|---|---|---|---|---|
| Boc-PhePhe | 248, 253, 259, 265 | 259 | 285 | 26 |
| Boc-PheTyr | 252, 258, 265, 269, 278, 285 | 278 | 306 | 28 |
| Boc-pNPhepNPhe | 268, 272, 275, 279 | 272 | 320, 357 | 48, 85 |
For molecules with aromatic rings, red shifts in PL spectra are associated with the aggregation process.26 They may also be related to an increase in charge transfer between the fundamental and excited states promoted by the nitro acceptor group attached to the para position in the phenyl ring.27
The presence of electron-withdrawing groups and/or electron-donating groups, such as NO2 and OH on a phenyl ring, decreases the energy difference between ground and excited states accompanied by a red-shift of the emission wavelengths.28 Additionally, the nitro group attached to the para position on the phenyl ring exhibits high electronegativity, which results in strong inductive electron-accepting properties and consequently strong intramolecular charge-transfer.29
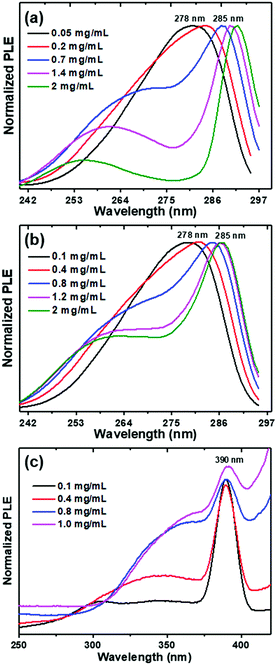
A study of QC due to exciton formation was carried out for Boc-PheTyr and Boc-pNPhepNPhe through their PLE spectra as a function of dipeptide concentration. Fig. 8(a and b) show exciton formation at room temperature and for Boc-PheTyr, from HFP/ethanol and HFP/water solutions, at an emission wavelength of 306 nm. At concentrations above 0.7 mg mL−1 one observes the formation of the 258 nm step-like peak and a narrow band with high intensity starts to form at 278 nm. This band, originating from the exciton, becomes narrower as the concentration increases (FWHM equal to 9.6 nm and maximum at 285 nm, for the 2 mg mL−1 ethanol solution), which is evidence of a crystalline structure existing inside the MTp. Similar to that reported for PhePhe, at low dipeptide concentrations there is no formation of ordered crystalline structures and the spectra are wide.13b,23,25 For Boc-pNPhepNPhe in HFP/water solution the emission wavelength used was 450 nm, Fig. 8(c). This shows the exciton formation in QC self-assembled Boc-pNPhepNPhe; here, at 0.4 mg mL−1, there is a broad band at 350 nm and an intense narrow peak at 390 nm, FWHM of 22 nm, the exciton peak that resulted from QDs is associated with the NT formation. As the concentration increases, the position of the broader band moves towards higher wavelengths while the exciton peak remains at the same position but widens due to self-assembly of the NTs into MTps. Because of an increase in exciton binding energy in these self-assembled structures, it is possible to observe luminescence even at room temperature.
From OA spectral measurements we can follow the formation of the step-like peaks as a function of increasing dipeptide concentrations for solutions in HFP/ethanol and HFP/water, as shown for Boc-PheTyr in Fig. 9(a and c), respectively.
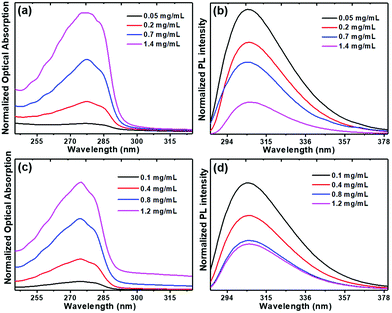 | ||
| Fig. 9 Boc-PheTyr MTps in HPF/ethanol and HPF/water solutions at several concentrations: optical absorption (a) and (c) and photoluminescence spectra (b) and (d). The excitation wavelength is 278 nm. | ||
At concentrations above 0.7 mg mL−1 the step-like peaks are clearly visible for both solutions. PL spectra excited at 278 nm and measured at different concentrations are also shown in Fig. 9(b and d) for the same solutions. While the position of the maximum intensity remains at the same wavelength, its intensity decreases with an increase of dipeptide concentration because of the narrow exciton peak as discussed before (Fig. 8). Solutions with lower concentrations do not have ordered building blocks and therefore have a higher PL intensity than concentrated ones formed by ordered nanostructures.23 The PL spectra of Boc-PheTyr MTp at several concentrations in HFP/water, at excitation wavelengths of 260 nm and 286 nm (Fig. S6(a and b), ESI†), show an increase in emission intensity for excitation at 285 nm, the exciton wavelength maximum.
Interestingly, we observed for Boc-pNPhepNPhe self-assembled in HFP/water solutions, the phenomenon known as aggregation-induced emission (AIE) where molecules display low emission when dissolved in good solvents but show high luminescence when aggregated.30 This phenomenon is currently understood as resulting from restrictions of intramolecular motions which exist in aggregated states31 such as those resulting from molecular self-assembly. Starting at low concentration, the PL spectrum (Fig. 10(b)) shows the formation of a broad band at 400 nm and a new blue luminescent narrower band at 470 nm, which increases in intensity with increasing dipeptide concentration like in the OA spectrum, Fig. 10(a). The four step-like absorption peaks as mentioned before start to form at concentrations above 0.8 mg mL−1 and are clearly visible at 1.2 mg mL−1.
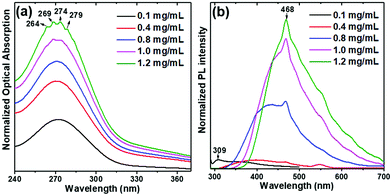 | ||
| Fig. 10 Optical absorption (OA) (a), and photoluminescence (PL) (b) spectra of Boc-pNPhepNPhe at several concentrations in HFP/water solutions. The excitation wavelength is 275 nm. | ||
Following our previous work on Boc-PhePhe NTs self-assembling into electrospun nanofibers16 we have also studied the QC of self-assembled Boc-PheTyr and Boc-pNPhepNPhe dipeptides into electrospun PLLA polymer microfibers, after previous dissolution in dichloromethane/dimethylformamide (DCM/DMF 4![[thin space (1/6-em)]](https://www.rsc.org/images/entities/char_2009.gif) :
:![[thin space (1/6-em)]](https://www.rsc.org/images/entities/char_2009.gif) 1 v/v), the solvents used for preparing precursor electrospinning solutions. The OA spectra of Boc-PheTyr and Boc-pNPhepNPhe, fibers, Fig. 11(a), exhibit the step-like features described before for the corresponding dipeptide solutions. This confirms their self-assembly as nanostructures inside the fibers. The PLE spectra also show exciton formation at 291 nm and 390 nm, respectively for Boc-PheTyr and Boc-pNPhepNPhe, Fig. 11(b). Confocal laser fluorescence microscopy revealed that Boc-PheTyr@PLLA and Boc-pNPhepNPhe@PLLA fiber mats display blue luminescence in the wavelength range of 430–470 nm following excitation at λexc = 405 nm, Fig. 11(c and d) respectively. Although the excitation was not at the maximum of OA, when using an intense laser beam as an excitation light source it was possible to detect fluorescence, meaning that very high fluorescence would be observed if a laser source at the maximum OA could be used.
1 v/v), the solvents used for preparing precursor electrospinning solutions. The OA spectra of Boc-PheTyr and Boc-pNPhepNPhe, fibers, Fig. 11(a), exhibit the step-like features described before for the corresponding dipeptide solutions. This confirms their self-assembly as nanostructures inside the fibers. The PLE spectra also show exciton formation at 291 nm and 390 nm, respectively for Boc-PheTyr and Boc-pNPhepNPhe, Fig. 11(b). Confocal laser fluorescence microscopy revealed that Boc-PheTyr@PLLA and Boc-pNPhepNPhe@PLLA fiber mats display blue luminescence in the wavelength range of 430–470 nm following excitation at λexc = 405 nm, Fig. 11(c and d) respectively. Although the excitation was not at the maximum of OA, when using an intense laser beam as an excitation light source it was possible to detect fluorescence, meaning that very high fluorescence would be observed if a laser source at the maximum OA could be used.
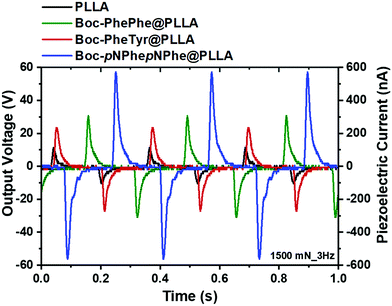
A demonstration of the piezoelectric behaviour of these dipeptide electrospun fibers as potential mechanical–electric energy convertors is reported in this work. Piezoelectricity is a property of acentric crystalline materials resulting from inter-conversion between mechanical and electrical stimuli inducing a charge redistribution and separation when a force is applied to the material.32 The experimental conditions used to measure the output voltage of Boc-PhePhe electrospun fibers upon application of a periodical stress perpendicular to the fiber array, were reported before.16 The piezoelectric response measured is an effective or overall response as the dipeptides are embedded into the fibers and the response is measured on an electrospun mat which contains a large number of fibers. A scheme has been added in the ESI,† Fig. S7. Under similar experimental conditions we measured the response of Boc-PheTyr@PLLA and Boc-pNPhepNPhe@PLLA microfiber mats as well as PLLA and Boc-PhePhe@PLLA fibers for comparison.
The maximum piezoelectric output voltage and current measured through an external 100 MΩ load resistance were 11 V and 110 nA for PLLA, 30 V and 300 nA for Boc-PhePhe@PLLA, 24 V and 240 nA for Boc-PheTyr_PLLA and extraordinarily 58 V and 580 nA for Boc-pNPhepNPhe@PLLA under an applied force of 1.5 N.
The results presented in Fig. 12 indicate that the performance of Boc-pNPhepNPhe microfibers is superior to that of Boc-PhePhe ones, as for the same applied force per unit area, the output voltage is doubled. This behaviour is certainly due to the strong dipoles which will develop inside Boc-pNPhepNPhe crystalline NTs under applied forces, enhanced by the strong electron-accepting character of the nitro group attached to the phenyl ring. Instantaneous powers of 9.0 μW cm−2 and 1.0 μW cm−2 were generated by a 4.0 cm2 fiber mat, respectively from Boc-pNPhepNPhe@PLLA and Boc-PheTyr@PLLA fibers. From our measurements we conclude that relative to Boc-PhePhe the effective piezoelectric coefficients of Boc-PheTyr have similar magnitude while they are twice as large for Boc-pNPhepNPhe embedded into polymer electrospun fibers. The reported effective d33 piezoelectric coefficient for BocPhePhe is 8.4 pC N−1.33 We may therefore estimate that the effective piezoelectric coefficients for Boc-PheTyr and Boc-pNPhepNPhe dipeptides are around 7 pC N−1 and 16 pC N−1, respectively. Another relevant quantity is the piezoelectric voltage coefficient given by geff = deff/ε′ε0 Vm N−1, which is a figure of merit indicating the performance of a material as a piezoelectric generator. Crystals with high piezoelectric coefficients and low dielectric permittivity will result in high values of this quantity. For the current dipeptide fiber mats at room temperature ε′ ≅ 3.0, effective piezoelectric voltage coefficients as high as geff ≅ 0.3 Vm N−1 are observed for Boc-PhePhe and Boc-PheTyr and geff ≅ 0.6 Vm N−1 for Boc-pNPhepNPhe. These values are ten and five times smaller than that reported for Boc-Dip-Dip (β,β-diphenyl-Ala-OH (Dip)), which has geff ≅ 2.8 Vm N−1. Boc-Dip-Dip is a highly aromatic dipeptide organic crystal with an extremely high effective piezoelectric coefficient of 73 pC N−1, which is higher than those reported for silk (50 pC N−1) and poled polyvinylidene-fluoride (PVDF) polymer (30 pC N−1), as a result of its large supramolecular crystal dipole of 1.8 Debye and low crystalline symmetry (point group 2).33 In Table 3 we compare some relevant piezoelectric response parameters for the dipeptide fiber mats under study in this work with those reported for a crystalline Boc-Dip-Dip powder sample. For the dipeptides reported in this work, in particular for the Boc-pNPhepNPhe fiber mat nanogenerator, compared with the Boc-Dip-Dip nanogenerator, using an applied force one order of magnitude smaller, it is possible to generate output voltages more than one order of magnitude higher accompanied by a voltage coefficient five times smaller. Therefore, embedding dipeptides into electrospun fibers is a practical way of easily handling nanostructured dipeptides able to perform as piezoelectric energy nanogenerators.
| Nanogenerator | Force/area (N m−2) | V out (V) | d eff (pC N−1) | g eff (Vm N−1) | Ref. |
|---|---|---|---|---|---|
| Boc-PhePhe (fiber mat) | 4 × 10³ | 30 | 8.4 | 0.3 | This work |
| Boc-PheTyr (fiber mat) | 4 × 10³ | 24 | 7 | 0.3 | This work |
| Boc-pNPhepNPhe (fiber mat) | 4 × 10³ | 58 | 16 | 0.6 | This work |
| Boc-DipDip (crystal powder) | 4 × 10⁴ | 1 | 73 | 2.8 | 33 |
Conclusions
In summary, two N-tert-butoxycarbonyl (Boc) protected analogues of the diphenylalanine dipeptide, Boc-p-nitro-L-phenylalanyl-p-nitro-L-phenylalanine and Boc-L-phenylalanyl-L-tyrosine, were self-assembled in solution and into electrospun fibers. Self-assembly into nanotubes which in turn further self-assembled into microtapes was identified for the first dipeptide. Aggregation induced emission as a result of self-assembly was also observed in Boc-p-nitro-L-phenylalanyl-p-nitro-L-phenylalanine in a HFP/water solution. Boc-L-phenylalanyl-L-tyrosine was found to self-assemble either into microspheres or microtapes when the solvents were respectively ethanol/water or HFP/water. Dynamic light scattering confirmed the formation of the self-assembled structure.Optical absorption and photoluminescence spectra of the dipeptides in solution and electrospun polymer fibers revealed step-like peaks in the spectral region of 240–290 nm as a result of quantum confinement due to nanostructure formation.
It was further demonstrated that embedding hybrid Boc-p-nitro-L-phenylalanyl-p-nitro-L-phenylalanine into poly-L-lactic acid polymer electrospun fibers produced a piezoelectric output voltage twice as big as that of Boc-L-phenylalanyl-L-phenylalanine fibers when embedded into the same polymer, indicating that its effective piezoelectric coefficient is twice as high. The performance of Boc-pNPhepNPhe@PLLA fibers as a piezoelectric generator, when compared with state-of-the-art dipeptide Boc-Dip-Dip nanogenerator, is only five times smaller while the applied force per unit area is one order of magnitude smaller. In the present work we show that for practical applications as piezoelectric nanogenerators, electrospun dipeptide fiber mats are easier to handle, and more flexible and versatile to work with than nanogenerators directly using powder crystalline dipeptides. They are therefore promising hybrid functional materials for integration into environmentally friendly nano energy harvesting devices. Finally, the studied dipeptide nanofiber mats displayed blue luminescence.
Experimental
Synthesis and materials
L-Phenylalanine (Phe), L-tyrosine (Tyr), p-nitro-L-phenylalanine (pNPhe), 1-hydroxybenzotriazole (HOBt), N,N-dicyclohexylcarbodiimide (DCC), thionyl chloride and di-tert-butylpyrocarbonate (Boc2O) were purchased from Sigma-Aldrich or Alfa Aesar and used as received. Poly(L-lactic acid) (PLLA, Mw 217–225![[thin space (1/6-em)]](https://www.rsc.org/images/entities/char_2009.gif) 000, was purchased from Polysciences. All solvents were purchased from Sigma-Aldrich and used as received.
000, was purchased from Polysciences. All solvents were purchased from Sigma-Aldrich and used as received.
Starting from commercially available L-amino acids, reaction with thionyl chloride in methanol yielded the corresponding amino acid methyl ester. In parallel, the reaction with di-tert-butylpyrocarbonate resulted in N–Boc protected amino acids. Dipeptide derivatives were synthesized through solution-phase synthesis, via coupling of the NBoc protected amino acid with the amino acid methyl ester, mediated by DCC/HOBt. Deprotection of the methyl ester group was performed using NaOH and the saponification progress was monitored by thin layer chromatography.
All the intermediates were characterized by NMR spectroscopy on a Bruker Avance III 400 at an operating frequency of 400 MHz for 1H.
Raman spectroscopy
Raman spectroscopy was carried out on a LabRAM HR Evolution Raman spectrometer (Horiba Scientific, France) coupled with a Horiba Scientific Labspec 6 spectroscopy set which provides not only complete instrument control but also data processing. The Raman spectra were acquired with a 532 nm laser excitation wavelength (0.1% laser intensity), with an acquisition time and accumulation of 30 s in the range between 40 and 3500 cm−1.X-ray diffraction and Raman spectroscopy
The crystallinity and crystallographic orientation of N-Boc protected diphenylalanine dipeptide nanostructures was studied by X-ray diffraction. The diffraction pattern using θ–2θ scans was recorded between 5° and 40° on a Philips PW-1710 X-ray diffractometer with Cu-Kα radiation at a wavelength of 1.5406 Å. The lattice planes parallel to the substrate surface were determined from the reciprocal lattice vector of modulus (2/λ)sin![[thin space (1/6-em)]](https://www.rsc.org/images/entities/char_2009.gif) θ, with λ the radiation wavelength and θ the Bragg angle. Raman spectroscopy was carried out on a LabRAM HR Evolution Raman spectrometer (Horiba Scientific, France) coupled with a Horiba Scientific Labspec 6 spectroscopy set which provides not only complete instrument control but also data processing. The Raman spectra were acquired with a 532 nm laser excitation wavelength (0.1% laser intensity), with an acquisition time and accumulation of 30 s in the range between 40–3500 cm−1.
θ, with λ the radiation wavelength and θ the Bragg angle. Raman spectroscopy was carried out on a LabRAM HR Evolution Raman spectrometer (Horiba Scientific, France) coupled with a Horiba Scientific Labspec 6 spectroscopy set which provides not only complete instrument control but also data processing. The Raman spectra were acquired with a 532 nm laser excitation wavelength (0.1% laser intensity), with an acquisition time and accumulation of 30 s in the range between 40–3500 cm−1.
Self-assembly of dipeptide micro and nanostructures
Fresh solutions of N-Boc protected diphenylalanine dipeptide analogues were prepared by dissolving the dipeptides in 1,1,1,3,3,3-hexafluoro-2-propanol (HFP, Sigma-Aldrich) to a concentration of 100 mg mL−1. These solutions were afterwards diluted in ultrapure water or in ethanol to the desired final concentrations according to the studies to be undertaken. After the dilution in ultrapure water or absolute ethanol, the solutions were left at room temperature for 24 h for self-assembly to take place.Electrospinning of nanofibers
Two precursor electrospinning solutions were prepared by dissolving 0.5 g of PLLA in 4 mL of dichloromethane (DCM) with vigorous stirring (700 rpm) at 40 °C for 1 h. After complete dissolution, 0.5 g of Boc-PheTyr or Boc-pNPhepNPhe previously dissolved in 1 mL of dimethylformamide (DMF) was added. The resulting clear and homogenous solutions were stirred for several hours under ambient conditions prior to the electrospinning process. Boc-PhePhe nanofibers were electrospun by a conventional electrospinning technique described before.18 The obtained solutions were loaded into a syringe with its needle (0.5 mm diameter) connected to the anode of a high voltage power supply (Spellmann CZE2000). Electrospinning was performed at room temperature and various parameters were changed to obtain bead free fibers and stable spinning conditions, namely, the solution feeding flow rate, the electric potential difference and the needle–collector distance. An electric potential difference between 17 and 20 kV, depending on the polymer and solvent ratio, was used. The needle–collector distance was 12 cm and the flow rate was 0.15–0.30 mL h−1. The fibers were collected as a random mesh on high purity aluminium foil which served as electrodes.Scanning electron microscopy (SEM)
Morphology, distribution of diameters and thickness of dipeptide structures were assessed using a Nova NanoSEM scanning electron microscope operated at an accelerating voltage of 10 kV. Dipeptide single crystals were deposited on a silica surface and previously covered with a thin film (10 nm thickness) of Au–Pd (80–20 weight %) using a high-resolution sputter cover, 208HR Cressington Company, coupled to a MTM-20 Cressigton high resolution thickness controller.The diameter range of the produced nanofibers was measured using SEM images using ImageJ 1.51n image processing software (NIH, https://imagej.nih.gov/ij/). Average diameter and diameter distribution were determined by measuring a certain number of random nanofibers from the SEM images. Statistical analysis was performed using OriginPro 2017 SR2 software (OriginLab Corporation, USA), and the fiber diameter distributions were fit to a log-normal function.
UV-Visible spectrophotometry and PL spectrofluorimetry
The optical absorption (OA) spectra were measured on a Shimadzu UV/2501PC spectrophotometer (Duisburg, Germany) in the wavelength range of 230–450 nm. The photoluminescence (PL) and photoluminescence excitation (PLE) spectra were collected using a FluoroMax-4 spectrofluorometer (Horiba Jovin Yvon, Madrid, Spain) in the wavelength range of 270–500 nm at room temperature. For these measurements diluted 1.0 mM ethanol solutions of dipeptide were prepared and put in quartz cuvettes with 1 cm path length. PL spectra were measured using the maximum absorption wavelength as the excitation wavelength, while photoluminescence excitation (PLE) spectra were measured at the maximum emission wavelength. Input and output slits were fixed at 5 nm and 10 nm for Boc-PheTyr and Boc-pNPhepNPhe, respectively.Confocal laser scanning microscopy
The autofluorescence of the fibers was observed with an Olympus™ FluoView FV1000 (Olympus, Tokyo, Japan) confocal scanning laser microscope, using a 40× objective, with emission/detection settings: (i) excitation wavelength 405 nm, detection filters BA 430–470. Images were acquired with 800 × 800 pixel resolution. A 1 cm2 fiber mat with 600 μm thickness was observed on a glass slide. A scan over the sample was performed at room temperature.Dynamic light scattering (DLS) measurements
The size, polydispersity and zeta potential of the 0.05 mg mL−1 water solutions of the dipeptides (50 μL of a previously prepared solution of the dipeptides at a concentration of 2 mg mL−1, HFP/water (0.2/9.8 v/v) were diluted in water to prepare the DLS samples) were measured on a Litesizer 500, a DLS instrument with three detection angles (15°, 90°, 175°) from Anton Paar, using a semiconductor laser diode of λ = 658 nm and 40 mW. Each sample was measured three times, at room temperature, and experimental data were processed using Kalliope software.Piezoelectric current
The piezoelectric output voltage was measured across a 100 MΩ load resistance connected to a low pass filter followed by a low noise pre-amplifier (Research systems SR560) before being registered using a digital storage oscilloscope (Agilent Technologies DS0-X-3012A). The nanofiber mat was subjected to periodic mechanical forces imposed by a vibration generator (Frederiksen SF2185) with a frequency of 3 Hz imposed by a signal generator (Hewlett Packard 33120A). The forces applied were measured by a calibrated force sensing resistor (FSR402, Interlink Electronics Sensor Technology). The electrospun fibers were directly deposited on high purity aluminium foil, which served as electrodes. Mats with 4 cm2 area and 600 μm thickness were used. A Faraday cage contained all the items connected to the generator and used for the output voltage and current measurements.Author contributions
Rosa M. F. Baptista and Etelvina de Matos Gomes conceived and coordinated all the work, analysed the results, and wrote and edited the manuscript. Paulo E. Lopes conducted RAMAN characterization; Ana Rita O. Rodrigues conducted the dynamic light scattering experiments; Nuno Cerca conducted the confocal laser scanning microscopy experiments. Michael S. Belsley with Rosa M. F. Baptista and Etelvina de Matos Gomes conducted the piezoelectric measurements. All authors discussed and commented on the manuscript.Conflicts of interest
The authors declare no conflicts of interest.Acknowledgements
We acknowledge FEDER (European Fund for Regional Development)-COMPETE-QREN-EU for financial support through the Physics Centers of the Universities of Minho and Porto (Ref. UID/FIS/04650/2013 and UID/FIS/04650/2019). We also acknowledge funding from the project PTDC/NAN-OPT/29265/2017. Part of this work was funded by national funds (OE), through FCT – Fundação para a Ciência e a Tecnologia, I. P., in the scope of the framework contract foreseen in the numbers 4, 5, and 6 of the article 23, of the Decree-Law 57/2016, of August 29, changed by Law 57/2017, of July 19.References
- (a) H. Liu, J. Xu, Y. Li and Y. Li, Acc. Chem. Res., 2010, 43, 1496–1508 CrossRef CAS PubMed; (b) O. Berger, L. Adler-Abramovich, M. Levy-Sakin, A. Grunwald, Y. Liebes-Peer, M. Bachar, L. Buzhansky, E. Mossou, V. T. Forsyth, T. Schwartz, Y. Ebenstein, F. Frolow, L. J. W. Shimon, F. Patolsky and E. Gazit, Nat. Nanotechnol., 2015, 10, 353–360 CrossRef CAS PubMed; (c) B. Apter, N. Lapshina, A. Handelman, B. D. Fainberg and G. Rosenman, Small, 2018, 14, 1801147 CrossRef PubMed; (d) K. Ariga, M. Nishikawa, T. Mori, J. Takeya, L. K. Shrestha and J. P. Hill, Sci. Technol. Adv. Mater., 2019, 20, 51–95 CrossRef CAS PubMed.
- (a) M. R. Ghadiri, Adv. Mater., 1995, 7, 675–677 CrossRef; (b) S. Gilead and E. Gazit, Supramol. Chem., 2005, 17, 87–92 CrossRef CAS.
- C. Gorbitz, Acta Crystallogr., Sect. B: Struct. Sci., Cryst. Eng. Mater., 2018, 74, 311–318 CrossRef CAS PubMed.
- C. H. Gorbitz, Chem. – Eur. J., 2001, 7, 5153–5159 CrossRef CAS.
- J. Kim, T. H. Han, Y. I. Kim, J. S. Park, J. Choi, D. C. Churchill, S. O. Kim and H. Ihee, Adv. Mater., 2010, 22, 583–587 CrossRef CAS PubMed.
- Q. Li, Y. Jia, L. Dai, Y. Yang and J. Li, ACS Nano, 2015, 9, 2689–2695 CrossRef CAS PubMed.
- (a) L. Adler-Abramovich and E. Gazit, Chem. Soc. Rev., 2014, 43, 6881–6893 RSC; (b) A. R. Allafchian, E. Moini and S. Z. Mirahmadi-Zare, IEEE Sens. J., 2018, 18, 8979–8985 CAS; (c) T. Cipriano, G. Knotts, A. Laudari, R. C. Bianchi, W. A. Alves and S. Guha, Acs Appl. Mater. Interfaces, 2014, 6, 21408–21415 CrossRef CAS PubMed.
- N. Kol, L. Adler-Abramovich, D. Barlam, R. Z. Shneck, E. Gazit and I. Rousso, Nano Lett., 2005, 5, 1343–1346 CrossRef CAS PubMed.
- L. Adler-Abramovich and E. Gazit, J. Pept. Sci., 2008, 14, 217–223 CrossRef CAS PubMed.
- L. Adler-Abramovich, N. Kol, I. Yanai, D. Barlam, R. Z. Shneck, E. Gazit and I. Rousso, Angew. Chem., Int. Ed., 2010, 49, 9939–9942 CrossRef CAS PubMed.
- L. Adler-Abramovich, Z. A. Arnon, X. Sui, I. Azuri, H. Cohen, O. Hod, L. Kronik, L. J. W. Shimon, H. D. Wagner and E. Gazit, Adv. Mater., 2018, 30, 1704551 CrossRef PubMed.
- J. M. del Campo and J. Ireta, Phys. Chem. Chem. Phys., 2021, 23, 11931–11936 RSC.
- (a) K. Tao, Z. Fan, L. Sun, P. Makam, Z. Tian, M. Ruegsegger, S. Shaham-Niv, D. Hansford, R. Aizen, Z. Pan, S. Galster, J. Ma, F. Yuan, M. Si, S. Qu, M. Zhang, E. Gazit and J. Li, Nat. Commun., 2018, 9, 3217 CrossRef PubMed; (b) N. Amdursky, M. Molotskii, D. Aronov, L. Adler-Abramovich, E. Gazit and G. Rosenman, Nano Lett., 2009, 9, 3111–3115 CrossRef CAS PubMed.
- A. Kholkin, N. Amdursky, I. Bdikin, E. Gazit and G. Rosenman, ACS Nano, 2010, 4, 610–614 CrossRef CAS PubMed.
- (a) S. Vasilev, P. Zelenovskiy, D. Vasileva, A. Nuraeva, V. Y. Shur and A. L. Kholkin, J. Phys. Chem. Solids, 2016, 93, 68–72 CrossRef CAS; (b) A. Heredia, I. Bdikin, S. Kopyl, E. Mishina, S. Semin, A. Sigov, K. German, V. Bystrov, J. Gracio and A. L. Kholkin, J. Phys. D: Appl. Phys., 2010, 43, 462001 CrossRef; (c) J.-H. Lee, K. Heo, K. Schulz-Schönhagen, J. H. Lee, M. S. Desai, H.-E. Jin and S.-W. Lee, ACS Nano, 2018, 12, 8138–8144 CrossRef CAS PubMed.
- R. M. F. Baptista, E. de Matos Gomes, M. M. M. Raposo, S. P. G. Costa, P. E. Lopes, B. Almeida and M. S. Belsley, Nanoscale Adv., 2019, 1, 4339–4346 RSC.
- M. Reches and E. Gazit, Phys. Biol., 2006, 3, S10–S19 CrossRef CAS PubMed.
- D. V. Isakov, E. de Matos Gomes, L. G. Vieira, T. Dekola, M. S. Belsley and B. G. Almeida, ACS Nano, 2011, 5, 73–78 CrossRef CAS PubMed.
- M. Reches and E. Gazit, Isr. J. Chem., 2005, 45, 363–371 CrossRef CAS.
- S. Bera, P. Jana, S. K. Maity and D. Haldar, Cryst. Growth Des., 2014, 14, 1032–1038 CrossRef CAS.
- (a) L. J. Bellamy, The Infra-red Spectra of Complex Molecules, Springer, Netherlands, 1975 CrossRef; (b) R. Huang, R. Su, W. Qi, J. Zhao and Z. He, Nanotechnology, 2011, 22, 245609 CrossRef PubMed.
- S. M. Reimann and M. Manninen, Rev. Mod. Phys., 2002, 74, 1283–1342 CrossRef CAS.
- N. Amdursky, M. Molotskii, E. Gazit and G. Rosenman, Appl. Phys. Lett., 2009, 94, 261907 CrossRef.
- G. Rosenman, P. Beker, I. Koren, M. Yevnin, B. Bank-Srour, E. Mishina and S. Semin, J. Pept. Sci., 2011, 17, 75–87 CrossRef CAS PubMed.
- N. Amdursky, E. Gazit and G. Rosenman, Adv. Mater., 2010, 22, 2311–2315 CrossRef CAS PubMed.
- B. Gilboa, C. Lafargue, A. Handelman, L. J. W. Shimon, G. Rosenman, J. Zyss and T. Ellenbogen, Adv. Sci., 2017, 4, 1700052 CrossRef PubMed.
- F. Bureš, RSC Adv., 2014, 4, 58826–58851 RSC.
- F.-H. Luo, Russ. J. Phys. Chem. A, 2020, 94, 352–359 CrossRef CAS.
- A. Jezuita, K. Ejsmont and H. Szatylowicz, Struct. Chem., 2021, 32, 179–203 CrossRef CAS.
- (a) J. Mei, Y. Hong, J. W. Y. Lam, A. Qin, Y. Tang and B. Z. Tang, Adv. Mater., 2014, 26, 5429–5479 CrossRef CAS PubMed; (b) N. L. C. Leung, N. Xie, W. Yuan, Y. Liu, Q. Wu, Q. Peng, Q. Miao, J. W. Y. Lam and B. Z. Tang, Chem. – Eur. J., 2014, 20, 15349–15353 CrossRef CAS PubMed.
- (a) Y. Hong, J. W. Y. Lam and B. Z. Tang, Chem. Soc. Rev., 2011, 40, 5361–5388 RSC; (b) Z. Zhao, H. Zhang, J. W. Y. Lam and B. Z. Tang, Angew. Chem., Int. Ed., 2020, 59, 9888–9907 CrossRef CAS PubMed.
- (a) J. F. Nye, Physical Properties of Crystals: Their Representation by Tensors and Matrices, Clarendon Press, Oxford, Repr. paperback edn, 2004 Search PubMed; (b) W. G. Cady,Piezoelectricity: an introduction to the theory and applications of electromechanical phenomena in crystals, McGraw-Hill, New York (N.Y.), 1st edn, 1946 Search PubMed.
- V. Basavalingappa, S. Bera, B. Xue, J. O’Donnell, S. Guerin, P.-A. Cazade, H. Yuan, E. U. Haq, C. Silien, K. Tao, L. J. W. Shimon, S. A. M. Tofail, D. Thompson, S. Kolusheva, R. Yang, Y. Cao and E. Gazit, ACS Nano, 2020, 14, 7025–7037 Search PubMed.
Footnote |
| † Electronic supplementary information (ESI) available. See DOI: 10.1039/d1ma01022k |
| This journal is © The Royal Society of Chemistry 2022 |

