 Open Access Article
Creative Commons Attribution 3.0 Unported Licence
Electrostatic self-assembly of 2D Janus PS@Au nanoraspberry photonic-crystal array with enhanced near-infrared SERS activity†
An
Cao
ab,
Tao
Zhang
a,
Dilong
Liu
*a,
Changchang
Xing
a,
Shichuan
Zhong
 ab,
Xuejiao
Li
ab,
Pan
Zeng
ab and
Yue
Li
ab,
Xuejiao
Li
ab,
Pan
Zeng
ab and
Yue
Li
 *a
*a
aKey Lab of Materials Physics, Anhui Key Lab of Nanomaterials and Nanotechnology, Institute of Solid State Physics, HFIPS, Chinese Academy of Sciences, Hefei 230031, P. R. China
bUniversity of Science and Technology of China, Hefei 230026, P. R. China
First published on 17th December 2021
Abstract
We developed a simple electrostatic self-assembly strategy to fabricate a kind of 2D Janus PS@Au nanoraspberry photonic-crystal array with a compelling near-infrared (NIR) SERS performance. Due to the opposite charges, the small positively-charged Au nanoparticles could effectively self-assemble on the 2D larger negatively-charged polystyrene (PS) latex photonic crystal. The number of Au nanoparticles deposited on the PS latex was highly controllable after tuning the ionic strength of the Au nanoparticle solution. These Janus PS@Au nanoraspberry arrays demonstrate a strong NIR-SERS activity with the enhanced factor up to 1.44 × 10⁹ and an ultra-low molecular detection limit of 10−11 M. The strongly-enhanced NIR-SERS performance is ascribed to the high density of hotspots formed in the unique Janus nanoraspberry structure and the photonic-crystal structure. With the simplicity of the electrostatic self-assembly strategy, the uniformity and tunability of the NIR-SERS activity, we envision that this work not only provides a new way for the fabrication of NIR-SERS substrates but also paves the way for bridging the light coupling with the matter, particularly in the NIR wavelength region.
Introduction
Surface-enhanced Raman scattering (SERS) is a powerful non-destructive analysis technique based on its unique molecular fingerprint recognition,1,2 which has been broadly applied in biosensing,3–5 environmental monitoring,6 medical diagnoses,7,8 chemical reaction monitoring,9,10 and so on.11,12 In decades, achieving a superior SERS activity has been dominantly relied on the plasmonic nanostructures (i.e., Au and Ag particles) by taking advantage of the localized surface plasmon resonance (LSPR) property.13,14 Moreover, it preferentially requires the matching of the LSPR extinction position with the incident laser wavelength to excite the strongest electromagnetic field (known as the ‘hotspot’).15–23 As the LSPR extinction position of noble-metal nanoparticles (i.e., Au nanoparticles) is essentially located in the visible wavelength region, visible-wavelength lasers are thus considered and widely used as the excitation light source. While the use of visible-wavelength lasers has some limitations, such as a short penetration depth in tissues and the signal overwhelmed by the fluorescent background.24 To compensate these shortcomings, increasing attention has been focused on tuning the LSPR position of noble-metal nanostructures into the near-infrared (NIR) region that can realize a NIR-SERS activity, such as tuning the nanostructures into anisotropic nanorods,25 nanostars,26,27 nanoshells, or porosity.28–30 Although these nanostructures demonstrate a well-performed NIR-SERS property, their SERS enhancement factors (EF) still need to be improved due to the low density of ‘hotspots’ generated in these discrete nanostructures.Assembling the plasmonic nanoparticles into two-dimensional (2D) periodic arrays is a simple and efficient way to boost the ‘hotspot’ density because numerous uniform interparticle gaps are formed in the array, which trigger a highly collective-enhanced electromagnetic field through the near-field plasmonic coupling effect.31–33 However, the controllable self-assembly of the well-ordered array is always challenging due to massive defects, dislocations and crystal domains emerged during the assembly, particularly when assembling anisotropic nanostructures. These severe spatial defects then result in an unpredictable redshift evolution and broadening of the LSPR extinction position in the assembled arrays, which make it extremely difficult in matching with the NIR-laser wavelength to achieve an excellent NIR-SERS activity. Therefore, it is urgent to develop an alternative way that can bridge the coupling between the NIR-laser light and the optical properties of the assembled arrays.
Photonic crystals with photonic bandgaps for enhancing the SERS performance have been flourished in recent years34–37 as the bandgaps can guide, localize and manipulate the incident light.31,35,38,39 For example, Qi et al. reported that the TiO2 inverse opal photonic crystal structure was directly used as a SERS substrate.40 Chen et al. achieved an outstanding SERS enhancement by simply sputtered silver islands on silica photonic crystals.41 All proved that photonic crystals provide an alternative platform for improving the SERS performance based on the enhanced light absorption around the edge of the photonic bandgap. However, current studies are still focused on visible-wavelength laser excitation. Implementing photonic crystals into 2D-assembled plasmonic arrays might fill the coupling blank in the NIR region, but remains elusive so far due to lack of a controllable self-assembly strategy.
Herein, we design a kind of 2D Janus PS@Au nanoraspberry photonic-crystal array that can demonstrate a compelling NIR-SERS performance with highly tunable and reproducible scattering. This kind of Janus PS@Au nanoraspberry array is achieved by simply engineering the electrostatic self-assembly of small positively-charged Au nanoparticles on a 2D larger negatively-charged polystyrene (PS) latex photonic crystal. Further tailoring the ionic strength of the Au nanoparticle solution could realize the controlling of the number of Au nanoparticles adsorbed on the PS latex in the array. When each PS latex was fully covered with a close-packed monolayer of Au nanoparticles, the PS@Au nanoraspberry array demonstrated the strongest NIR-SERS activity with an enhanced factor up to 1.44 × 10⁹ and an ultra-low molecular detection limit of 10−13 M. The reason for the highly-enhanced NIR-SERS performance is ascribed to the high-density hotspots of the 2D photonic crystal. This work can not only provide a simple strategy to fabricate NIR-SERS substrates but can also pave a way for enhancing the coupling interaction between light and matter, particularly in the NIR wavelength region.
Results and discussion
2D Janus PS@Au nanoraspberry photonic-crystal array
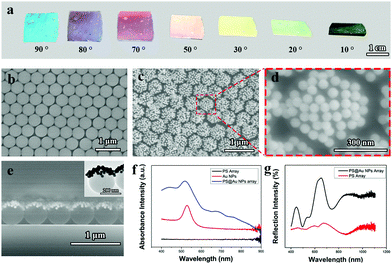
Fig. 1a shows the digital photographs of the assembled PS@Au nanoraspberry photonic-crystal array observed from different angles. The color displayed from the PS@Au nanoraspberry array is angle-dependent, indicating that the PS@Au array retains the photonic crystal arrangement after the self-assembly.42Fig. 1b presents the typical SEM image of the 2D PS photonic crystal array with a diameter of 500 nm in a hexagonally close-packed (HCP) arrangement used for the electrostatic self-assembly, which was fabricated through the air/water interfacial self-assembly.6,12,29,43–45Fig. 1c and d show the SEM images of the PS@Au nanoraspberry photonic-crystal array, where the small Au nanoparticles (55 ± 5 nm, as confirmed from the TEM image in the Fig. S1, ESI†) are adsorbed on each PS latexes through the electrostatic attraction force, forming a monolayer of Au nanoparticles densely covered the upper hemisphere of the PS latexes. This PS@Au nanoraspberry photonic-crystal array still maintained the hexagonal close-packed arrangement after the self-assembly (the low-magnification SEM images of the PS array before and after loading Au nanoparticles, as shown in Fig. S2, ESI†), which was well consistent with the photonic crystal color in Fig. 1a. The interparticle gaps formed between the adjacent Au nanoparticles can induce a strong near-field plasmonic coupling, which then will provide a greatly-enhanced electromagnetic field for the SERS activity.1,2 Further cross-sectioned SEM image (Fig. 1e) and TEM image (inset in Fig. 1e) confirm that the Au nanoparticles are densely deposited on the upper hemisphere of the PS latexes, forming a Janus-like nanoraspberry structure.Fig. 1f compares the absorption spectrum of the PS@Au nanoraspberry array with the pure PS array and the colloidal Au nanoparticle solution. It can be found that the pure PS arrays did not have any absorption peak, and the colloidal Au nanoparticles possessed one sharp LSRP extinction peak centered at 520 nm. While for the assembled PS@Au nanoraspberry array, besides the slightly-shifted LSPR extinction peak of Au nanoparticles, it exhibited a wide and broad extinction peak ranging from 650 nm to 900 nm. The slight shifting of the LSPR peak is attributed to the dielectric constant change around the Au nanoparticles, and the emergence of a broad extinction can be ascribed to the interparticle plasmonic coupling among the adjacent Au nanoparticles absorbed on the PS latexes. Fig. 1g presents the reflectance spectrum of the PS@Au nanoraspberry array before and after the electrostatic self-assembly. Evidently, with the Au nanoparticles absorbed on the PS latexes, the scattering of the PS photonic crystal array was strongly enhanced due to the strong cross-sectional coefficient of Au metal.44 Moreover, for these Au nanoparticles deposited on the photonic crystal array, the photonic bandgaps of the array will enhance the multiple scattering of the light among the Au nanoparticles, which will further improve the SERS activity.40,46 Therefore, 2D Janus PS@Au nanoraspberry photonic-crystal arrays have been fabricated through an electrostatic self-assembly process, which demonstrated a strong near-field plasmonic coupling and enhanced reflective scattering.
The electrostatic self-assembly mechanism
Since the surfactant ligands for the PS latexes and the Au nanoparticles were the sulfonate group and the PDDA with the amino group, respectively, they demonstrated the opposite surface charges in an aqueous solution. The zeta potentials of the PS latexes and Au nanoparticles were −27 mV and 20 mV, respectively, as confirmed in Fig. S3 in ESI.† By design of the PS latexes and the Au nanoparticles with opposite charges, the self-assembly of the 2D Janus PS@Au nanoraspberry photonic-crystal array can be achieved through an electrostatic interaction, where their possible electrostatic self-assembly mechanism is illustrated in Fig. 3. Initially, when the PS photonic-crystal arrays were immersed in the aqueous Au nanoparticle solution, the Au nanoparticles will be spontaneously adsorbed to the PS latexes through an electrostatic attraction (Fig. 2a). While on the other hand, with the Au nanoparticles gradually absorbed on the PS latexes, they will neutralize the surface charges of the PS latex array, turning the electric double layer around the PS latexes from negative to positive charge. This positive double-layer then builds an electrostatic-repulsion potential barrier, which prevents further absorption of the Au nanoparticles. In that case, only a few Au nanoparticles can be sparsely absorbed on each PS latex in the array (Fig. 2b). According to the DLVO (Derjaguin, Landau, Verwey and Overbeek) theory, the electrostatic potential barrier is correlated with the ionic strength of the aqueous solution (see ESI† for more details). A simple and well-known method to tailor the ionic strength is to add extra salt into the aqueous solution. Therefore, additional NaCl salt was then used to decrease the electrostatic potential barrier of the system, allowing more Au nanoparticles to absorb onto the PS latex array (Fig. 2c). Finally, under an optimal amount of the NaCl salt addition, we can achieve a densely-packed monolayer of Au nanoparticles absorbed on each PS latex, forming the 2D Janus PS@Au nanoraspberry photonic-crystal array with a huge number of hotspots.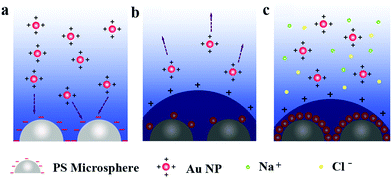 | ||
| Fig. 2 Schematic of the electrostatic self-assembly process of the 2D Janus PS@Au nanoraspberry photonic-crystal array triggered by NaCl addition. | ||
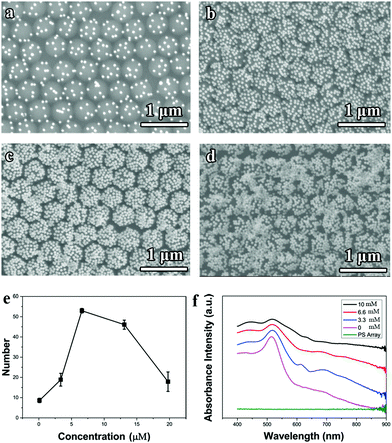
The electrostatic self-assembly mechanism can be further verified from the tuning of the NaCl concentration in the aqueous Au nanoparticle solution, as shown in Fig. 3a–e. Without adding the NaCl salt, only several Au nanoparticles were sparsely deposited on each PS latex (Fig. 3a). As the concentration of NaCl increased from 0 to 6.6 mM, the number of Au nanoparticles attracted to the PS latexes climbed (Fig. 3b and c), and reached a maximum value at the concentration of 6.6 mM. However, further increasing the NaCl concentration (e.g., 13.2 mM) causes severe Au nanoparticle aggregations both in the solution and on the PS latex-array substrate. The relation between the number of Au nanoparticles absorbed on each PS latex and the NaCl concentration is summarized in Fig. 3e, which indicates that the NaCl salt can efficiently lower the electrostatic potential barrier for the electrostatic self-assembly. Moreover, as the number of Au nanoparticles deposited on the PS latexes increases, the corresponding absorption spectrum of the Janus PS@Au nanoraspberry photonic-crystal array also varied, as shown in Fig. 3f. The LSPR peak of Au nanoparticles gradually broadened, and a new wide extinction peak emerged in the near-infrared region. This phenomenon was simply attributed to the surging of the interparticle gaps among the adjacent Au nanoparticles, which then induced a strong plasmonic coupling effect. Furthermore, the severe Au nanoparticle aggregation caused a dramatically weakened and broadened extinction peak in the whole range (Fig. 3d). All the above-mentioned results indicated that the electrostatic self-assembly of PS@Au nanoraspberry photonic-crystal array was highly controllable based on the tuning of the ionic strength of the aqueous Au nanoparticle solution.
The NIR-SERS activity of the 2D Janus PS@Au nanoraspberry array
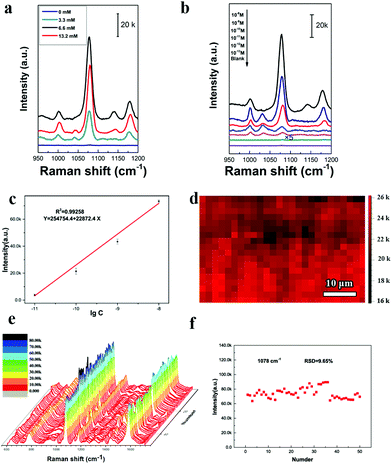
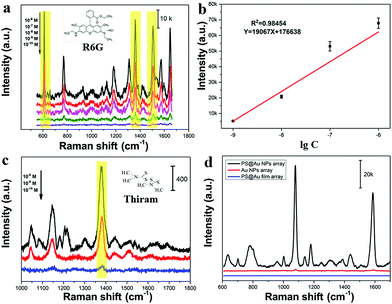
Fig. 4 studies the NIR-SERS performance of these 2D Janus PS@Au nanoraspberry photonic-crystal arrays. 4-ATP molecules were selected as the typical detecting molecules, and a NIR-wavelength laser of 785 nm was used as the incident excitation light source.29 Since the number of Au nanoparticles absorbed on the PS latexes was tuned by the NaCl concentration, Fig. 4a compares the SERS activity of PS@Au nanoraspberry photonic-crystal arrays fabricated under different concentrations of the NaCl-induced self-assembly. With the increase in the NaCl concentration, the NIR-SERS activity of the substrate dramatically enhanced and demonstrated the strongest SERS performance at a concentration of 6.6 mM. The EF of this NIR-SERS substrate was about 1.44 × 10⁹ (the calculation details are shown in ESI†). These results are well consistent with the increasing number of Au nanoparticles absorbed on the PS latexes that dramatically soared up the hotspots in the substrate. However, the NIR-SERS performance got worse when a high concentration of NaCl (13.2 mM) caused severe Au nanoparticle aggregation on the substrate. We further investigated the detection limit of the 2D Janus PS@Au nanoraspberry photonic-crystal arrays fabricated under the NaCl concentration of 6.6 mM, as shown in Fig. 4b and c. Distinct fingerprint peaks of 4-ATP at 1007 cm−1 (C–C bending vibrations), 1078 cm−1 (C(benzene ring)–S stretching vibrations) and 1590 cm−1 (C–C stretching vibrations) are clearly observed.47 Moreover, the SERS performance of the PS@Au nanoraspberry array had a linear relationship with the logarithm of the concentrations of the 4-ATP molecules (Fig. 4c) and demonstrated a detection limit as low as 10−13 M. Moreover, by taking advantage of the HCP arrangement of the photonic-crystal array, the SERS performance of this NIR-SERS substrate exhibited high uniformity and reproducibility, as embodied from the SERS signal mapping of the characteristic peak of 1078 cm−1 of the 4-ATP molecule in Fig. 4d. The uniform and stable NIR-SERS performance can be further confirmed by detecting 50 random points from five different substrates, which demonstrated a low relative standard deviation (RSD) of 9.65% (Fig. 4e and f).Moreover, another kind of molecule (Rhodamine-6G, R6G) was also used to test the SERS enhancement effect without a sulfhydryl group that can facilitate the molecules absorbing on the Au nanoparticle surface. The fingerprint signals of the R6G molecules were around 613 cm−1 (in-plane C–C–C bending), 1361 cm−1 (xanthene ring stretching) and 1508 cm−1 (C–C stretching).48,49 Moreover, there was a good linear relationship between the peak intensity at 613 cm−1 and the logarithm of the R6G concentrations, as shown in Fig. 5b. The LOD was estimated to be as 2.83 × 10⁻¹¹ M (signal-to-noise ratio of S/N = 3). This substrate can be used to detect the pesticide molecules; for example, the fingerprint peak of thiram at 1380 cm−1 (C–H wagging) is also clearly detected, as shown in Fig. 5c. Therefore, this kind of 2D Janus PS@Au nanoraspberry photonic-crystal array displays a compelling NIR-SERS activity.
The enhanced NIR-SERS mechanism of the 2D Janus PS@Au nanoraspberry photonic-crystal arrays
The compelling NIR-SERS activity of the 2D Janus PS@Au nanoraspberry photonic-crystal arrays can be ascribed to the following two aspects: a high hotspot density in the Janus nanoraspberry structure and the enhanced light absorption around the photonic bandgaps. Since the PS latex photonic-crystal array serves as the assembling template, the Au nanoparticles assembled on each PS latex can be equivalent to a three-dimensional (3D) hemispherical cluster shell, which can produce a large number of denser hotspots. In contrast, PS photonic crystal arrays sputtered with a thin layer of gold film with a period of 500 nm (Fig. S5, ESI†) and the flat monolayer of Au nanoparticles assembled on silicon wafers (Fig. S6, ESI†) had a relatively-weak SERS performance, as presented in Fig. 5d. In addition, the excellent NIR-SERS performance of the PS@Au nanoraspberry photonic-crystal arrays under 785 nm excitation light source can be attributed to the matching of the LSPR excitation position of the substrate and the excitation light source wavelength, which can produce a strong electromagnetic field enhancement and lead to an excellent NIR-SERS performance. More importantly, these 3D hemispherical Au nanoparticle clusters are arranged in a well-ordered photonic crystal structure, which can improve the light interaction with matter and enhance the light utilization. This enhanced light utilization directly facilitates the coupling of light with Au nanoparticles, which in turn induced a much stronger electromagnetic field for improving the NIR-SERS activity.Conclusions
In summary, we proposed an effective route for the fabrication of a 2D Janus PS@Au nanoraspberry photonic-crystal array based on the electrostatic interactions between positively-charged Au nanoparticles and the 2D negatively-charged PS latex photonic crystal. This kind of 2D Janus PS@Au nanoraspberry array demonstrated a compelling NIR-SERS activity with an enhanced factor up to 1.44 × 10⁹. The strongly-enhanced NIR-SERS performance was contributed to the high density of hotspots formed in the unique Janus nanoraspberry structure and the enhanced light absorption originated from the photonic crystal structure. With the simplicity of the electrostatic self-assembly method and the uniformity and tunability of the NIR-SERS activity, we envision that this study not only provides an alternative way for the fabrication of NIR-SERS substrate, but also paves the way for bridging the light coupling with the matter, particularly in the NIR wavelength region.Conflicts of interest
There are no conflicts to declare.Acknowledgements
The authors acknowledge the financial support from the National Science Fund for Distinguished Young Scholars (Grant No. 51825103), the Natural Science Foundation of China (Grant No. 51861008, 52171232) and the National Key Research and Development Program of China (Grant No. 2017YFA0207101).Notes and references
- S. Schlücker, Angew. Chem., Int. Ed., 2014, 53, 4756–4795 Search PubMed.
- J. Langer, D. Jimenez de Aberasturi, J. Aizpurua, R. A. Alvarez-Puebla, B. Auguié, J. J. Baumberg, G. C. Bazan, S. E. J. Bell, A. Boisen, A. G. Brolo, J. Choo, D. Cialla-May, V. Deckert, L. Fabris, K. Faulds, F. J. García de Abajo, R. Goodacre, D. Graham, A. J. Haes, C. L. Haynes, C. Huck, T. Itoh, M. Käll, J. Kneipp, N. A. Kotov, H. Kuang, E. C. Le Ru, H. K. Lee, J.-F. Li, X. Y. Ling, S. A. Maier, T. Mayerhöfer, M. Moskovits, K. Murakoshi, J.-M. Nam, S. Nie, Y. Ozaki, I. Pastoriza-Santos, J. Perez-Juste, J. Popp, A. Pucci, S. Reich, B. Ren, G. C. Schatz, T. Shegai, S. Schlücker, L.-L. Tay, K. G. Thomas, Z.-Q. Tian, R. P. Van Duyne, T. Vo-Dinh, Y. Wang, K. A. Willets, C. Xu, H. Xu, Y. Xu, Y. S. Yamamoto, B. Zhao and L. M. Liz-Marzán, ACS Nano, 2019, 14, 28–117 Search PubMed.
- C. Zong, M. Xu, L.-J. Xu, T. Wei, X. Ma, X.-S. Zheng, R. Hu and B. Ren, Chem. Rev., 2018, 118, 4946–4980 Search PubMed.
- A.-I. Henry, B. Sharma, M. F. Cardinal, D. Kurouski and R. P. Van Duyne, Anal. Chem., 2016, 88, 6638–6647 Search PubMed.
- H. Li, Q. Yang, J. Hou, Y. Li, M. Li and Y. Song, Adv. Funct. Mater., 2018, 28, 1800448 Search PubMed.
- C. Xing, S. Zhong, J. Yu, X. Li, A. Cao, D. Men, B. Wu, W. Cai and Y. Li, J. Mater. Chem. C, 2020, 8, 3838–3845 Search PubMed.
- Y. Zhang, J. Qian, D. Wang, Y. Wang and S. He, Angew. Chem., Int. Ed., 2013, 52, 1148–1151 Search PubMed.
- S. Jeong, Y.-i. Kim, H. Kang, G. Kim, M. G. Cha, H. Chang, K. O. Jung, Y.-H. Kim, B.-H. Jun, D. W. Hwang, Y.-S. Lee, H. Youn, Y.-S. Lee, K. W. Kang, D. S. Lee and D. H. Jeong, Sci. Rep., 2015, 5, 9455 Search PubMed.
- W. Xie, C. Herrmann, K. Kömpe, M. Haase and S. Schlücker, J. Am. Chem. Soc., 2011, 133, 19302–19305 Search PubMed.
- K. Zhang, L. Yang, Y. Hu, C. Fan, Y. Zhao, L. Bai, Y. Li, F. Shi, J. Liu and W. Xie, Angew. Chem., Int. Ed., 2020, 59, 18003–18009 Search PubMed.
- Y. Zhou, G. Zhao, J. Bian, X. Tian, X. Cheng, H. Wang and H. Chen, ACS Appl. Mater. Interfaces, 2020, 12, 28532–28538 Search PubMed.
- C. Xing, D. Liu, J. Chen, Y. Fan, F. Zhou, K. Kaur, W. Cai and Y. Li, Chem. Mater., 2021, 33, 310–319 Search PubMed.
- C. Bi, J. Chen, Y. Chen, Y. Song, A. Li, S. Li, Z. Mao, C. Gao, D. Wang, H. Möhwald and H. Xia, Chem. Mater., 2018, 30, 2709–2718 Search PubMed.
- L. Xing, Y. Xiahou, P. Zhang, W. Du and H. Xia, ACS Appl. Mater. Interfaces, 2019, 11, 17637–17646 Search PubMed.
- Y. Cai, Y. Wu, T. Xuan, X. Guo, Y. Wen and H. Yang, ACS Appl. Mater. Interfaces, 2018, 10, 15412–15417 Search PubMed.
- T. Ding, D. O. Sigle, L. O. Herrmann, D. Wolverson and J. J. Baumberg, ACS Appl. Mater. Interfaces, 2014, 6, 17358–17363 Search PubMed.
- K. Esashika, R. Ishii, S. Tokihiro and T. Saiki, Opt. Mater. Express, 2019, 9, 1667–1677 Search PubMed.
- D. Liu, C. Li, F. Zhou, T. Zhang, G. Liu, W. Cai and Y. Li, Adv. Mater. Interfaces, 2017, 4, 1600976 Search PubMed.
- S. Pal, A. Dutta, M. Paul and A. Chattopadhyay, J. Phys. Chem. C, 2020, 124, 3204–3210 Search PubMed.
- S. S. Raja, C.-W. Cheng, Y. Sang, C.-A. Chen, X.-Q. Zhang, A. Dubey, T.-J. Yen, Y.-M. Chang, Y.-H. Lee and S. Gwo, ACS Nano, 2020, 14, 8838–8845 Search PubMed.
- Z. Wang, C. Zheng, P. Zhang, Z. Huang, C. Zhu, X. Wang, X. Hu and J. Yan, Nanoscale, 2020, 12, 4359–4365 Search PubMed.
- W. Zhao, Y. Zhang, J. Yang, J. Li, Y. Feng, M. Quan, Z. Yang and S. Xiao, Nanoscale, 2020, 12, 18056–18066 Search PubMed.
- K. Zhu, Z. Wang, S. Zong, Y. Liu, K. Yang, N. Li, Z. Wang, L. Li, H. Tang and Y. Cui, ACS Appl. Mater. Interfaces, 2020, 12, 29917–29927 Search PubMed.
- L. A. Lane, R. Xue and S. Nie, Curr. Opin. Chem. Biol., 2018, 45, 95–103 Search PubMed.
- S. Lin, W. Hasi, X. Lin, S. Han, T. Xiang, S. Liang and L. Wang, ACS Sens., 2020, 5, 1465–1473 Search PubMed.
- C.-H. Lai, G.-A. Wang, T.-K. Ling, T.-J. Wang, P.-K. Chiu, Y.-F. Chou Chau, C.-C. Huang and H.-P. Chiang, Sci. Rep., 2017, 7, 5546 Search PubMed.
- S. Park, J. Lee and H. Ko, ACS Appl. Mater. Interfaces, 2017, 9, 44088–44095 Search PubMed.
- S. Jeong, M.-W. Kim, Y.-R. Jo, N.-Y. Kim, D. Kang, S. Y. Lee, S.-Y. Yim, B.-J. Kim and J. H. Kim, ACS Appl. Mater. Interfaces, 2019, 11, 44458–44465 Search PubMed.
- T. Zhang, Y. Sun, L. Hang, H. Li, G. Liu, X. Zhang, X. Lyu, W. Cai and Y. Li, ACS Appl. Mater. Interfaces, 2018, 10, 9792–9801 Search PubMed.
- T. Zhang, F. Zhou, L. Hang, Y. Sun, D. Liu, H. Li, G. Liu, X. Lyu, C. Li, W. Cai and Y. Li, J. Mater. Chem. C, 2017, 5, 11039–11045 Search PubMed.
- W. Shen, M. Li, B. Wang, J. Liu, Z. Li, L. Jiang and Y. Song, J. Mater. Chem., 2012, 22, 8127 Search PubMed.
- X. Gan, R.-J. Shiue, Y. Gao, K. F. Mak, X. Yao, L. Li, A. Szep, D. Walker, J. Hone, T. F. Heinz and D. Englund, Nano Lett., 2013, 13, 691–696 Search PubMed.
- Z. Mu, X. Zhao, Y. Huang, M. Lu and Z. Gu, Small, 2015, 11, 6036–6043 Search PubMed.
- M. Fränzl, S. Moras, O. D. Gordan and D. R. T. Zahn, J. Phys. Chem. C, 2018, 122, 10153–10158 Search PubMed.
- J. A. Kraai, A. X. Wang and G. L. Rorrer, Adv. Mater. Interfaces, 2020, 7, 2000191 Search PubMed.
- E. Yablonovitch, Phys. Rev. Lett., 1987, 58, 2059–2062 Search PubMed.
- S. John, Phys. Rev. Lett., 1987, 58, 2486–2489 Search PubMed.
- K. Sivashanmugan, K. Squire, J. A. Kraai, A. Tan, Y. Zhao, G. L. Rorrer and A. X. Wang, Adv. Opt. Mater., 2019, 7, 1900415 Search PubMed.
- X. Zhou, M. Li, K. Wang, H. Li, Y. Li, C. Li, Y. Yan, Y. Zhao and Y. Song, ChemPhysChem, 2018, 19, 2101–2106 Search PubMed.
- D. Qi, L. Lu, L. Wang and J. Zhang, J. Am. Chem. Soc., 2014, 136, 9886–9889 Search PubMed.
- G. J. Chen, K. L. Zhang, B. B. Luo, W. Hong, J. Chen and X. D. Chen, Biosens. Bioelectron., 2019, 143, 111596 Search PubMed.
- G. Chen and W. Hong, Adv. Opt. Mater., 2020, 8, 2000984 Search PubMed.
- X. Li, T. Zhang, J. Yu, C. Xing, X. Li, W. Cai and Y. Li, ACS Appl. Mater. Interfaces, 2020, 12, 40702–40710 Search PubMed.
- D. Men, H. Zhang, L. Hang, D. Liu, X. Li, W. Cai, Q. Xiong and Y. Li, J. Mater. Chem. C, 2015, 3, 3659–3665 Search PubMed.
- D. Men, F. Zhou, L. Hang, X. Li, G. Duan, W. Cai and Y. Li, J. Mater. Chem. C, 2016, 4, 2117–2122 Search PubMed.
- S. Nishimura, N. Abrams, B. A. Lewis, L. I. Halaoui, T. E. Mallouk, K. D. Benkstein, J. van de Lagemaat and A. J. Frank, J. Am. Chem. Soc., 2003, 125, 6306–6310 Search PubMed.
- L.-S. Jiao, W. Zhijuan, N. Li, S. Jing, T.-Y. You, S.-J. Dong and A. Ivaska, J. Solid State Electrochem., 2006, 10, 886–893 Search PubMed.
- H. Sun, M. Yao, Y. Song, L. Zhu, J. Dong, R. Liu, P. Li, B. Zhao and B. Liu, Nanoscale, 2019, 11, 21493–21501 Search PubMed.
- K.-H. Yang, Y.-C. Liu and C.-C. Yu, Langmuir, 2010, 26, 11512–11517 Search PubMed.
Footnote |
| † Electronic supplementary information (ESI) available. See DOI: 10.1039/d1ma01033f |
| This journal is © The Royal Society of Chemistry 2022 |

