 Open Access Article
Electronic structure regulation of an ultra-thin MOF-derived NiSe2/NiS2@NC heterojunction for promoting the hydrogen evolution reaction†
Kebin
Lu‡
a,
Jianpeng
Sun‡
a,
Huakai
Xu
a,
Chuanhai
Jiang
a,
Weifeng
Jiang
a,
Fangna
Dai
 *a,
Hong
Wang
*b and
Hongguo
Hao
*c
aCollege of Science, School of Materials Science and Engineering, China University of Petroleum (East China), Qingdao, Shandong 266580, P. R. China. E-mail: fndai@upc.edu.cn
bA College of Materials Science and Engineering, Beijing University of Chemical Technology, Beijing, P. R. China. E-mail: wanghong@mail.buct.edu.cn
cShandong Provincial Key Laboratory of Chemical Energy Storage and Novel Cell Technology, School of Chemistry and Chemical Engineering, Liaocheng University, Liaocheng 252059, China. E-mail: hhg207@126.com
First published on 31st December 2021
Abstract
Transition metal selenides (TMSes) are considered promising electrocatalysts for the hydrogen evolution reaction (HER) due to their narrow bandgap, unique morphology and low cost. Herein, using a metal–organic framework (MOF) as a precursor, a NiSe2/NiS2@NC electrocatalyst with abundant heterogeneous interfaces was designed and synthesized through a simultaneous selenization/sulfurization process. The heterojunction could provide more catalytic sites, accelerate the transfer of ions/gas, and optimize the electronic structure of the interface, and then exhibit overpotentials of 188 mV and 211 mV at 10 mA cm−2 in acidic and alkaline media. The density functional theory (DFT) calculation results showed that the heterogeneous interface can optimize the electronic structure. Meanwhile, the Gibbs free-energy for H* adsorption  was reduced to −0.35 eV, which means that the interface can effectively accelerate the HER kinetics. This work provides a strategy for constructing heterojunction electrocatalysts and understanding the role of electronic structure in the HER.
Introduction
Hydrogen energy is an environmentally friendly, renewable, and high-energy-density new energy source, which has advantages in solving energy shortages and related environmental problems.1–5 The electrochemical hydrogen evolution reaction (HER) is considered to be an efficient and sustainable hydrogen production method. However, to achieve high efficiency hydrogen production, it is necessary to overcome a certain potential energy barrier, which places high demands on the catalyst.6–8Due to their narrow bandgap, unique morphology and low cost, transition metal selenides (TMSes) have been widely used as HER electrocatalysts in recent years.9–12 However, their performances are limited by low conductivity and the lack of effective active sites. Therefore, improving the electrocatalytic performance of TMSes is still a big challenge.13,14 The construction of heterojunctions and idiographic nano-interfaces can control the electronic structure and optimize the chemical adsorption of reaction intermediates to accelerate the electrocatalytic kinetics.15 In addition to metal doping,16,17 non-metal doping is also considered to be another promising strategy to construct heterojunctions. For instance, Guo et al. anchored CoS2 nanoparticles onto the surface of CoSe2/DETA (diethylenetriamine) and constructed a CoS2/CoSe2 hybrid material, which not only exhibits excellent catalytic activity but also has good mechanical properties.18 Wang et al. have synthesized a nickel foam-supported NiSe2–Ni2P heterojunction catalyst used in acidic solution, which improved the catalytic activity of the main catalyst through the coupling effect between NiSe2 and Ni2P.19 The above work has made certain improvements and obtained a heterojunction catalyst with good catalytic activity, but an in-depth study on the specific influence of the heterogeneous interface is severely lacking. Thus, it is essential to carry out systematic experimental and theoretical research for constructing non-metal doped heterojunction TMSes and understand the regulation of the electronic structure of the catalyst.
Based on the above considerations, we chose a Ni-MOF ([Ni(HBTC)(DABCO)]) (HBTC = trimesic acid, DABCO = 1,4-diazabicyclo [2.2.2] octane) nanosheet as the precursor, and successfully synthesized a NiSe2/NiS2@NC (NC = nitrogen-doped carbon matrix) heterojunction electrocatalyst after high-temperature carbonization and simultaneous selenization/sulfurization. Choosing a suitable precursor can not only simplify the preparation process, but also facilitate the introduction of heteroatoms.20–25 The MOF nanosheet as the preassembly platform is based on the following considerations:26–28 first, the MOF nanosheet could generate more vacancies after pyrolysis, thereby increasing the number of catalytic sites; second, the nanosheet will crimp naturally during the calcination process to form a stable NC protective layer to avoid corrosion by the acid–base electrolyte; third, a small amount of carbon layer derived from the MOF nanosheet can prevent the agglomeration of metal sites.29–35
In the synthesized heterojunction, a rich phase interface is formed. Therefore, the hybrid material has low overpotentials of 188 mV and 211 mV at 10 mA cm−2 and shows promising stability in acidic and alkaline electrolytes. Density functional theory (DFT) calculations show that the multiphase interface can adjust the electronic structure of NiSe2/NiS2@NC, thereby changing the Gibbs free energy of hydrogen-containing intermediates. After the interface engineering control, the  in the HER process decreases from −0.518 eV (NiSe2@NC) and −1.11 eV (NiS2@NC) to −0.35 eV (NiSe2/NiS2@NC). The combination of experimental and theoretical research proves that a distinctive two-phase interface is necessary to adjust the electronic structure and optimize the inherent HER performance of a TMSe electrocatalyst.
Experimental
Materials and methods
All the reagents were used as received without further purification. Nickel nitrate hexahydrate (Ni(NO3)2·6H2O), N,N-dimethylmethanamide (DMF) and methanol (MeOH) were purchased from Sigma-Aldrich (USA). 1,4-Diazabicyclo [2.2.2] octane (DABCO), trimesic acid (H3-BTC), and polyethylene pyrrolidone (PVP) were purchased from Energy-Chemicals. Selenium (Se) powder and sulfur (S) powder were purchased from Sinopharm Chemical Reagent Co. Ltd. The water used for experiments was deionized (DI) water.Preparation of ultrathin MOF nanosheets
The MOF nanosheets ([Ni(HBTC)(DABCO)]) used in this work were synthesized by a solvothermal method. First, 0.145 g (0.5 mmol) Ni(NO3)2·6H2O, 0.056 g (0.5 mmol) DABCO, 0.053 g (0.25 mmol) H3-BTC and 1 g PVP were dissolved in DMF (10 mL) solution. Then the resulting mixed solution was stirred at room temperature for 30 minutes, and finally the mixed solution was transferred to a 25 ml reactor, heated to 120 °C and kept for 24 hours. After being gradually cooled to room temperature, collected by centrifugation and washed with DMF and methanol three times, the final ultrathin MOF nanosheets were obtained after drying at 80 °C for 12 hours under vacuum conditions.Synthesis of Ni@NC
For the synthesis of Ni@NC nanomaterials, the MOF nanosheet was transferred to a square porcelain boat followed by placing it in a furnace. And the furnace was heated from room temperature to 600 °C for 2 hours with a heating rate of 5 °C min−1 under an argon atmosphere. The argon gas should flow for 30 minutes to ensure that the reaction is carried out in an argon atmosphere before heating.Synthesis of NiSe2@NC, NiS2@NC, and NiSe2/NiS2@NC
20 mg Ni@NC and 120 mg selenium powder (sulfur powder, 60 mg sulfur powder, and 60 mg selenium powder) were accurately weighed and placed in a square ceramic boat, which was then placed in the furnace. In an argon atmosphere, the furnace was heated from room temperature to 450 °C for 2 hours, and the heating rate was 5 °C min−1. The argon gas should flow for 30 minutes to ensure that the reaction is carried out in an argon atmosphere before heating.Materials characterization
The phase of electrocatalysts was characterized through X-ray diffraction (XRD, Bruker D2 PHASER). The nitrogen adsorption–desorption isotherms were obtained using a Bel Japan BELSORP-MINIII. The morphologies were obtained using a scanning electron microscope (SEM, HITACHI S-8200) and a transmission electron microscope (TEM, Hitachi JEM-2100F). X-ray photoelectron spectroscopy (XPS) spectra were recorded using a Thermo Scientific ESCALAB 250Xi.Electrochemical measurements
All HER tests in this article were performed with a typical three-electrode system (Gamry INTERFACE 1000 T) at room temperature. In the measurements, a three-electrode system was employed with a graphite carbon rod, a calomel electrode (SCE) and a glassy carbon electrode (GCE) as the counter electrode, reference electrode and working electrode, respectively. The details of the measurements are included in the ESI.†Density functional theory (DFT) calculations
Density functional theory (DFT) calculations were performed using the Vienna ab initio Simulation Package (VASP) with the generalized gradient approximation (GGA) parameterized by Perdew, Burke and Ernzerhof (PBE) for the exchange correlation functional. The details of the calculations are included in the ESI.†Results and discussion
The synthetic procedures of NiSe2/NiS2@NC are shown in Fig. 1a. The X-ray diffraction (XRD) pattern, FT-IR spectra (Fig. S1, ESI†) and Brunauer–Emmett–Teller (BET) measurements (Fig. S2, ESI†) of the MOF are consistent with the reported work,36 which proves that it has a high phase purity. Moreover, from the thermo-gravimetric analysis (TGA) curve (Fig. S5a, ESI†), the MOF framework has collapsed after 400 °C. Therefore, 600 °C is chosen as the carbonization temperature. The atomic force microscopy (AFM) image (Fig. S3, ESI†) shows the ultrathin MOF nanosheet with a thickness of 6 nm. From the structure diagram of the MOF (Fig. S4, ESI†), it can be considered that the number of MOF layers synthesized in this paper is 8 ± 1.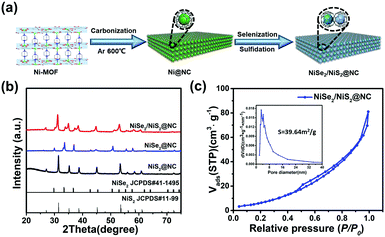 | ||
| Fig. 1 (a) Schematic illustration of the two-step synthetic procedures of NiSe2/NiS2@NC. (b) XRD patterns. (c) N2 adsorption–desorption isotherms (inset: pore size distribution curve). | ||
The Ni-MOF was transformed into Ni@NC through a two hour annealing step at 600 °C under an Ar atmosphere. The XRD peaks of Ni@NC (Fig. S6, ESI†) are consistent with the Ni@NC (JCPDS# 04-0850) standard pattern. Then, the NiSe2/NiS2@NC was prepared by simultaneously introducing S and Se in an Ar atmosphere at 450 °C. For comparison, NiSe2@NC and NiS2@NC were prepared by separately introducing selenium or sulfur. The XRD peaks of NiSe2@NC and NiS2@NC match well with NiSe2 (JCPDS# 41-1495) and NiS2 (JCPDS# 11-99) standard patterns (Fig. 1b). The XRD peaks of NiSe2/NiS2@NC show the combination of two types of peaks, which indicates the successful preparation of the NiSe2/NiS2@NC. NiSe2/NiS2@NC has a specific surface area of 39.64 m2 g−1 and larger N2 adsorption capacity (Fig. 1c) than NiS2@NC (Fig. S7, ESI†) and NiSe2@NC (Fig. S8, ESI†). Meanwhile, the inset in Fig. 1c also shows a mesoporous structure of 2–16 nm in NiSe2/NiS2@NC. Such a large pore size is sufficient to allow the generated hydrogen to pass through, thereby promoting the HER process and improving the catalytic activity of the catalyst.37
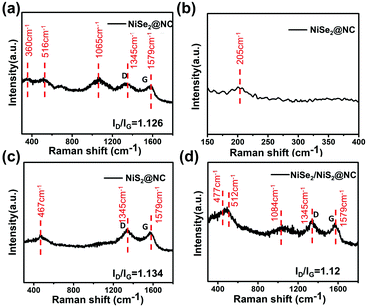
In order to further explore the composition of the synthesized material, the material was characterized by Raman spectroscopy. Fig. 2a and b show that the peaks at 205, 360, 516, and 1062 cm−1 can be labeled as nickel selenide according to previously reported articles.38,39 The observed peak in Fig. 2c at 467 cm−1 is the characteristic peak of the NiS2@NC crystal.40 From Fig. 2d, the peaks belonging to NiSe2@NC and NiS2@NC can be found, which further proves the successful preparation of NiSe2/NiS2@NC. In addition, the G band and D band are respectively related to the degree of graphitization of amorphous carbon. The peaks corresponding to the G band and D band of graphene layers located at 1345 and 1579 cm−1 can be observed in every spectrum, respectively, implying the presence of C in the composite. It is meaningful that the peak intensity ratio (ID/IG) can reflect the degree of defects on the surface of carbon materials and the degree of graphitization.41,42 The peak intensity ratio of NiSe2/NiS2@NC is slightly smaller, which indicates that it has a higher degree of graphitization and better conductivity.
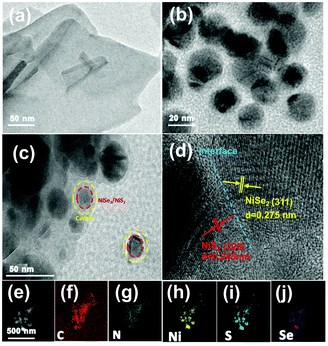
Transmission electron microscopy (TEM) can help us obtain the morphology of the sample, so TEM characterization of the material is carried out. During the calcination process of the Ni-MOF, Ni cations were reduced to Ni nanoparticles and organic ligands were pyrolyzed into N-doped graphene layers,43 forming core–shell Ni@NC nanomaterials (Fig. 3b). The TEM image (Fig. 3c) of NiSe2/NiS2@NC also shows that NiSe2/NiS2 nanoparticles are wrapped in a thin N-doped graphene layer. The high-resolution transmission electron microscopy (HRTEM) image (Fig. 3d) shows two lattice fringes, namely NiS2 (d = 0.245 nm) and NiSe2 (d = 0.275 nm) lattice fringes, corresponding to the NiS2 (220) facet and NiSe2 (311) facet. The clear phase boundary between the NiS2 and NiSe2 crystals in Fig. 3d indicates that the heterogeneous interface has been successfully constructed.44,45 The characteristic heterojunction can provide more active sites, and shorten the transport path of electrons. The mapping result shows the uniform distribution of C, N, Ni, S and Se elements in NiSe2/NiS2@NC in Fig. 3e–j.
In addition to the above characterization, this work also involved X-ray photoelectron spectroscopy (XPS). The XPS spectrum clearly reveals the main elements contained, including S, Se, Ni, C, N and O produced by inevitable oxidation (Fig. 4a).46 The Ni 2p spectra (Fig. 4b) display the same shape as previously reported.47 The two peaks at 854.1 eV and 870.8 eV prove the presence of Ni2+. The peaks at 856.2 eV and 875.4 eV indicate the presence of Ni3+, which can be attributed to the slight oxidation of the surface. The peaks near 860.5 eV and 880.6 eV are the satellites of Ni 2p3/2 and Ni 2p1/2, which are consistent with the results reported in the literature.48 The S 2p spectrum can be fitted into two peaks at binding energies of 163.7 and 162.7 eV (Fig. 4c), corresponding to the S 2p1/2 and S 2p3/2 of Ni–S bonding.49 In Fig. 4d, two peaks corresponding to Se 3d5/2 (54.7 eV) and Se 3d3/2 (55.8 eV) can be fitted, which proves the existence of the Se–Ni bond. And the peak at 59.1 eV is caused by the SeOx species due to the exposure to air.50 In addition, the C 1s spectra (Fig. 4e) can also be fitted into two peaks at 284.6 and 285.3 eV, which are ascribed to the C–C and C–N/C–O species, respectively.32 Based on the N 1s spectra (Fig. 4f), three peaks with binding energies of 398.6, 401.2 and 402.8 eV correspond to pyridinic-N, pyrrolic-N and graphitic-N, respectively. What's more, a peak at about 1.5 eV higher than pyridine-N binding energy was also found at 400.3 eV, which was classified as an M–Nx bond in some previous reports.51,52 Therefore, it can be considered that there is a strong Ni–Nx chemical bond between NiSe2/NiS2 and NC. The Ni–Nx bond not only greatly promotes the interface electron transfer, but also maximizes the synergistic effect induced.
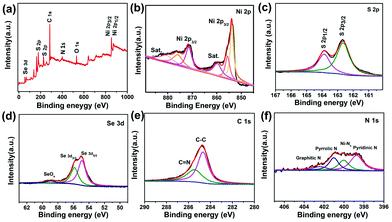 | ||
| Fig. 4 XPS spectra of NiSe2/NiS2@NC: (a) XPS spectra, (b) Ni 2p, (c) S 2p, (d) Se 3d, (e) C 1s, and (f) N 1s. | ||
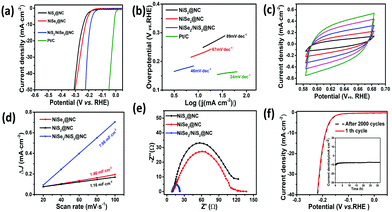
In order to reveal the influence of the electronic structure of the heterogeneous interface on the electrocatalytic performance, a standard three-electrode system was used to evaluate the HER activity in 0.5 M H2SO4 solution. First, NiSe2/NiS2@NC was synthesized at synthesis temperatures of 350 °C, 450 °C, and 550 °C, respectively, and the optimum synthesis temperature was investigated. The results manifest that when the synthesis temperature is 450 °C, the overpotential to reach −10 mA cm−2 is the smallest (Fig. S10, ESI†). What's more, for comparison, 20% Pt/C, NiSe2@NC and NiS2@NC were also evaluated. As expected, 20% Pt/C exhibited the best catalytic properties, and the HER activity of NiSe2/NiS2@NC (188 mV) was also better than those of NiSe2@NC (244 mV) and NiS2@NC (240 mV) (Fig. 5a).
The Tafel diagram derived from the polarization curve can help in further studying the reaction kinetics of the catalyst. When the current density increases, a smaller Tafel slope means higher HER efficiency. At the same time, the reaction mechanism of the HER in acidic electrolytes is divided into two main steps according to the Tafel diagram:53–55 Volmer (120 mV dec−1), Heyrovsky (40 mV dec−1) or Tafel (30 mV dec−1) steps. As seen in Fig. 5b, the Tafel slope of NiSe2/NiS2@NC (46 mV dec−1) is lower than those of NiSe2@NC (67 mV dec−1) and NiS2@NC (89 mV dec−1), indicating that NiSe2/NiS2@NC has higher HER efficiency, and the HER process should belong to the Volmer–Heyrovsky mechanism.
Besides the intrinsic activity of the catalyst, the HER catalytic performance of the material is also closely related to the actual electrochemical active surface area (ECSA). In the non-Faraday response region, the ECSA of the material can be estimated using the double-layer capacitance (Cdl). Therefore, we have explored the ECSA of NiSe2/NiS2@NC on the basis of the corresponding electrochemical Cdl. The Cdl values of the three materials can be calculated through the CV curves (Fig. S11 and Fig. 5c, ESI†). It can be seen from Fig. 5d that NiSe2/NiS2@NC has the highest Cdl value, which shows that its ECSA value is higher. After that, electrochemical impedance spectroscopy (EIS) was used to determine the electrode kinetics of NiSe2/NiS2@NC. As shown in Fig. 5e, NiSe2/NiS2@NC has the lowest charge transfer resistance, which makes the electron transfer speed in the HER faster. In addition, the stability of the catalyst is of great significance to its subsequent practical applications, for which we researched the electrochemical stability of NiSe2/NiS2@NC. The initial overpotential and current density did not change much after 2000 continuous CV cycles, as seen from the LSV curves (Fig. 5f). Meanwhile, in the stability test for 32 h, NiSe2/NiS2@NC also showed excellent stability.
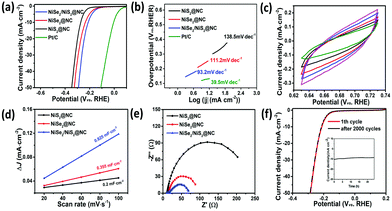
In addition, the catalytic effect of the catalyst in 1.0 M KOH solution was also explored (Fig. 6). NiSe2/NiS2@NC only requires 211 mV of overpotential at −10 mA cm−2, which is lower than those of NiSe2@NC (236 mV) and NiS2@NC (272 mV). In addition, the Tafel slope of NiSe2/NiS2@NC is also smaller, indicating that it has a higher HER efficiency. Simultaneously, the Tafel slope of 93.2 mV dec−1 indicates that the HER process should belong to the Volmer–Heyrovsky mechanism under alkaline conditions. The Cdl value of NiSe2/NiS2@NC is higher, which shows that it has a larger active area. Moreover, the charge transfer resistance of NiSe2/NiS2@NC is much smaller, which is more conducive to the progress of the HER. The cycling performance and long-term stability were verified using the polarization curve (1st and 2000th) and constant 24 h stability test. Besides, the HER performance of NiSe2/NiS2@NC was also investigated in neutral medium. According to the LSV curve, NiSe2/NiS2@NC shows a comparatively lower onset potential and overpotential at −10 mA cm−2 than those in acidic and alkaline media, owing to its sluggish reaction barriers under this condition. The corresponding Tafel slope is also calculated and is presented in Fig. S18 (ESI†).
After the electrocatalytic activity tests under acidic and alkaline conditions, the synthesized NiSe2/NiS2@NC heterojunction shows the expected HER electrocatalytic activity, which exceeds those of many reported materials (Tables S1 and S2, ESI†). In order to have a deeper understanding of the influence of the NiSe2/NiS2@NC heterojunction on the electrocatalytic performance, we conducted DFT calculations under acidic conditions and studied the interface charge behavior.
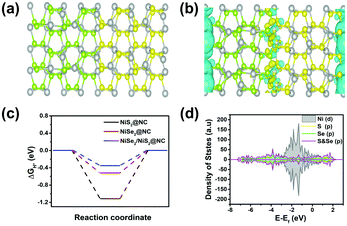
In order to analyze the differential charge density, a model of the NiSe2/NiS2@NC crystal structure as shown in Fig. 7a was constructed. The differential charge density shows that the electron density increases significantly near the two-phase interface (Fig. 7b), indicating the accumulation of electrons near the interface. In addition, the  on the catalyst surface is generally considered to be one of the keys to evaluating the activity of the catalyst. It is generally believed that the closer the absolute value of
  is to zero, the better the electrocatalytic activity. Therefore, we performed DFT calculations on the
  value. To simplify the calculation process, we have established a model of H atom adsorption on the surfaces of NiSe2, NiS2, and NiSe2/NiS2 (Fig. S13–S15, ESI†). The
  values of NiSe2@NC, NiS2@NC, and NiS2/NiS2@NC in Fig. 7c are approximately −0.518 eV, −1.11 eV and −0.35 eV. At the same time, the
  value of NiSe2/NiS2@NC is smaller than the
  values of NiSe2@NC (0.565 eV)56 and NiS2@NC (−1.2 eV)57 reported in the literature. The decrease of the
  value indicates that NiSe2/NiS2@NC not only has the lowest hydrogen adsorption energy, but also accelerates the proton/electron transport, thereby improving the intrinsic catalytic activity.58
To further explore its origin, the projected electronic density of states (PDOS) calculations are performed for NiSe2/NiS2@NC (Fig. 7d), respectively. Ni 3d band and the S/Se p band centers were obtained by integrating the PDOS. The smaller difference between the Ni 3d and Se/S p band centers indicates a lower charge transfer energy, indicating that the covalency between Ni and Se/S is stronger.59 It is worth noting that due to the moderate covalent properties, the interaction between the hydrogen containing intermediate and the Ni site is relatively suitable on NiSe2/NiS2@NC, indicating that the heterogeneous interface promotes the HER process to a certain extent.
Conclusions
In short, a Ni-MOF is used as the precursor to synthesize a NiSe2/NiS2@NC heterojunction with rich phase interfaces through the process of first carbonization and then simultaneous selenization/sulfurization. The heterojunction has more catalytic sites, and can accelerate the transfer of ions/gas, and regulate the electronic structure of the interface. In addition, the catalyst exhibits overpotentials of 188 mV and 211 mV at 10 mA cm−2 in acidic and alkaline media. Moreover, the DFT calculations show that the electron transfer at the heterogeneous interface can adjust the electronic structure of NiSe2/NiS2@NC and further change the . This work provides an inimitable strategy for exploring the construction of heterojunction electrocatalysts for the HER using MOFs as a template.
Author contributions
Kebing Lu and Jianpeng Sun: contributed equally to conceptualization, methodology, investigation, and writing – original draft. Weifeng Jiang, Chuanhai Jiang, and Huakai Xu: validation and writing – review & editing. Fangna Dai, Hong Wang and Hongguo Hao: resources, supervision, project administration, and funding acquisition.Conflicts of interest
There are no conflicts to declare.Acknowledgements
This work was supported by the National Natural Science Foundation of China (Grant No. 21771191), the Shandong Natural Science Fund (ZR2020KB010), the Fundamental Research Funds for the Central Universities (19CX05001A), the Postgraduate Innovation Project of China University of Petroleum (YCX2021133), the Liaocheng University Research Fund for Science and Technology (318011913), the Liaocheng University Start-up Fund for Doctoral Scientific Research (318050104) and the Youth Innovation Team of Shandong Colleges and Universities (2019KJC027).Notes and references
- S. Kang, J. Bang, K. Chung, C. Nandadasa, G. Han, S. Lee, K. Lee, K. Lee, Y. Ma, S. Oh, S. Kim, Y. Kim and S. Kim, Sci. Adv., 2020, 6, eaba7416 CrossRef CAS PubMed.
- A. Baroutaji, T. Wilberforce, M. Ramadan and A. G. Olabi, Renewable Sustainable Energy Rev, 2019, 106, 31–40 CrossRef CAS.
- X. Zou and Y. Zhang, Chem. Soc. Rev., 2015, 44, 5148–5180 RSC.
- A. Dhakshinamoorthy, Z. Li and H. Garcia, Chem. Soc. Rev., 2018, 47, 8134–8172 RSC.
- H. Ang, H. Wang, B. Li, Y. Zong, X. Wang and Q. Yan, Small, 2016, 12, 2859 CrossRef CAS PubMed.
- A. Indra, T. Song and U. Paik, Adv. Mater., 2018, 30, 1705146 CrossRef PubMed.
- X. Wang, B. Zheng, B. Yu, B. Wang, W. Hou, W. Zhang and Y. Chen, J. Mater. Chem. A, 2018, 6, 7842–7850 RSC.
- J. Ekspong, T. Sharifi, A. Shchukarev, A. Klechikov, T. Wåg-berg and E. Gracia-Espino, Adv. Funct. Mater., 2016, 26, 6766–6776 CrossRef CAS.
- T. Jaramillo, K. Jorgensen, J. Bonde, J. Nielsen, S. Horch and I. Chorkendorff, Science, 2007, 317, 100–102 CrossRef CAS PubMed.
- S. Anantharaj, S. Rao Ede, K. Sakthikumar, K. Karthick, S. Mishra and S. Kundu, ACS Catal., 2016, 6, 8069–8097 CrossRef CAS.
- Z. Zheng, L. Yu, M. Gao, X. Chen, W. Zhou, C. Ma, L. Wu, J. Zhu, X. Meng, J. Hu, Y. Tu, S. Wu, J. Mao, Z. Tian and D. Deng, Nat. Commun., 2020, 11, 3315 CrossRef CAS PubMed.
- K. Zhou, J. He, X. Wang, J. Lin, Y. Jing, W. Zhang and Y. Chen, Electrochim. Acta, 2017, 231, 626–631 CrossRef CAS.
- Y. Zhou, Y. Chen, M. Wei, H. Fan, X. Liu, Q. Liu, Y. Liu, J. Cao and L. Yang, CrystEngComm, 2021, 23, 69 RSC.
- K. Ao, J. Dong, C. Fan, D. Wang, Y. Cai, D. Li, F. Huang and Q. Wei, ACS Sustainable Chem. Eng., 2018, 6, 10952–10959 CrossRef CAS.
- Y. Li, Z. Yin, M. Cui, X. Liu, J. Xiong, S. Chen and T. Ma, J. Mater. Chem. A, 2021, 9, 2070 RSC.
- Y. Guan, Y. Feng, Y. Mu, H. Zhang and Y. Wang, Electrochim. Acta, 2017, 247, 435–442 CrossRef CAS.
- G. Zhao, K. Rui, S. Dou and W. Sun, Adv. Funct. Mater., 2018, 28, 1803291 CrossRef.
- Y. Guo, C. Shang and E. Wang, J. Mater. Chem. A, 2017, 5, 2504 RSC.
- P. Wang, Z. Pu, W. Li, J. Zhu, C. Zhang, Y. Zhao and S. Mu, J. Catal., 2019, 377, 600–608 CrossRef CAS.
- N. Li, Y. Zhang, M. Jia, X. Lv, X. Li, R. Li, X. Ding, Y.-Z. Zheng and X. Tao, Electrochim. Acta, 2019, 326, 134976 CrossRef CAS.
- N. Chen, Q. Mo, L. He, X. Huang, L. Yang, J. Zeng and Q. Gao, Electrochim. Acta, 2019, 299, 708–716 CrossRef CAS.
- X. Zhong, J. Tang, J. Wang, M. Shao, J. Chai, S. Wang, M. Yang, Y. Yang, N. Wang, S. Wang, B. Xu and H. Pan, Electrochim. Acta, 2018, 269, 55–61 CrossRef CAS.
- X. Chen, Z. Qiao, B. Hou, H. Jiang, W. Gong, J. Dong, H.-Y. Li, Y. Cui and Y. Liu, Nano Res., 2021, 14, 466–472 CrossRef CAS.
- F. Dai, X. Wang, Y. Wang, Z. Liu and D. Sun, Angew. Chem., Int. Ed., 2020, 5992, 22372–22377 CrossRef PubMed.
- Y.-B. Huang, J. Liang, X.-S. Wang and R. Cao, Chem. Soc. Rev., 2017, 46, 126 RSC.
- L. Huang, G. Gao, H. Zhang, J. Chen, Y. Fang and S. Dong, Nano Energy, 2020, 68, 104296 CrossRef CAS.
- X. Lu, Y. Fang, D. Luan and X. Lou, Nano Lett., 2021, 21, 1555 CrossRef CAS PubMed.
- Z. Huang, C. Feng, J. Sun, B. Xu, T. Huang, X. Wang, F. Dai and D. Sun, CCS Chem, 2020, 2, 2696–2711 Search PubMed.
- Y. Wang, Y. Pan, L. Zhu, H. Yu, B. Duan, R. Wang, Z. Zhang and S. Qiu, Carbon, 2019, 146, 671–679 CrossRef CAS.
- H.-F. Wang, L. Pang, S. Kaskel and Q. Xu, Chem. Soc. Rev., 2020, 49, 1414 RSC.
- B. Zhang, Y. Zheng, T. Ma, C. Yang, Y. Peng, Z. Zhou, M. Zhou, S. Li, Y. Wang and C. Cheng, Adv. Mater., 2021, 2006042 CrossRef CAS PubMed.
- T. Wang, X. Cao and L. Jiao, Small, 2021, 2004398 CrossRef CAS PubMed.
- W. Zhou, J. Lu, K. Zhou, L. Yang, Y. Ke, Z. Tang and S. Chen, Nano Energy, 2016, 28, 143–150 CrossRef CAS.
- X. Wu, S. Han, D. He, C. Yu, C. Lei, W. Liu, G. Zheng, X. Zhang and L. Lei, ACS Sustainable Chem. Eng., 2018, 6, 8672–8678 CrossRef CAS.
- J. Deng, J. Ren, D. Deng and X. Bao, Angew. Chem., Int. Ed., 2015, 127, 2128–2132 CrossRef.
- S. Jeong, D. Kim, X. Song, M. Choi, N. Park and M. Lah, Chem. Mater., 2013, 25, 1047–1054 CrossRef CAS.
- F.-X. Ma, C.-Y. Xu, F. Lyu, B. Song, S.-C. Sun, Y. Li, J. Lu and L. Zhen, Adv. Sci., 2019, 6, 1801490 CrossRef PubMed.
- W. Li, B. Yu, Y. Hu, X. Wang, D. Yang and Y. Chen, ACS Sustainable Chem. Eng., 2019, 7, 4351–4359 CrossRef CAS.
- P. Thangasamy, V. Maruthapandian, V. Saraswathy and M. Sathish, Catal. Sci. Technol., 2017, 7, 3591–3597 RSC.
- D. W. Bishop, P.-S. Thomas and A. S. Ray, Mater. Res. Bull., 2000, 35, 1123–1128 CrossRef CAS.
- B. Wang, Z. Wang, X. Wang, B. Zheng, W. Zhang and Y. Chen, J. Mater. Chem. A, 2018, 6, 12701–12707 RSC.
- J. Lin, J. He, Y. Chen, Q. Li, B. Yu, C. Xu and W. Zhang, Electrochim. Acta, 2016, 215, 667–673 CrossRef CAS.
- Y. Xu, W. Tu, B. Zhang, S. Yin, Y. Huang, M. Kraft and R. Xu, Adv. Mater., 2017, 29, 1605957 CrossRef PubMed.
- Y. Yang, Y. Kang, H. Zhao, X. Dai, M. Cui, X. Luan, X. Zhang, F. Nie, Z. Ren and W. Song, Small, 2020, 16, 1905083 CrossRef CAS PubMed.
- Z. Xue, X. Li, Q. Liu, M. Cai, K. Liu, M. Liu, Z. Ke, X. Liu and G. Li, Adv. Mater., 2019, 31, 1900430 CrossRef PubMed.
- L. Yang, W. Hong, Y. Zhang, Y. Tian, X. Gao, Y. Zhu, G. Zou, H. Hou and X. Ji, Adv. Funct. Mater., 2019, 29, 1903454 CrossRef CAS.
- Y. Guo, D. Guo, F. Ye, K. Wang and Z. Shi, Int. J. Hydrogen Energy, 2017, 42, 17038–17048 CrossRef CAS.
- P. Prieto, V. Nistor, K. Nouneh, M. Oyama, M. Abd-Lefdil and R. Díaz, Appl. Surf. Sci., 2012, 258, 8807–8813 CrossRef CAS.
- Y. Liang, Y. Yang, K. Xu, T. Yu, S. Yao, Q. Peng and C. Yuan, J. Catal., 2020, 381, 63–69 CrossRef CAS.
- J. Zhang, B. Jiang, J. Zhang, R. Li, N. Zhang, R. Liu, J. Li, D. Zhang and R. Zhang, Mater. Lett., 2019, 235, 53–56 CrossRef CAS.
- S.-L. Yang, T.-R. Zhang, G.-C. Li, L.-Q. Yang and J.-Y. Lee, Energy Storage Mater., 2017, 6, 140–148 CrossRef.
- H. Zhang, Y. Liu, T. Chen, J. Zhang, J. Zhang and X. Lou, Adv. Mater., 2019, 48, 1904548 CrossRef PubMed.
- Y.-H. Fang and Z.-P. Liu, ACS Catal., 2014, 4, 4364–4376 CrossRef CAS.
- X. Lu, S. Zhang, W. Sim, S. Gao and X. Lou, Angew. Chem., Int. Ed., 2021, 60, 22885 CrossRef CAS PubMed.
- M.-R. Gao, J.-X. Liang, Y.-R. Zheng, Y.-F. Xu, J. Jiang, Q. Gao, J. Li and S.-H. Yu, Nat. Commun., 2015, 6, 5982 CrossRef CAS PubMed.
- J. Lin, H. Wang, J. Cao, F. He, J. Feng and J. Qi, J. Colloid Interface Sci., 2020, 571, 260–266 CrossRef CAS PubMed.
- T. Wang, X. Guo, J. Zhang, W. Xiao, P. Xi, S. Peng and D. Gao, J. Mater. Chem. A, 2019, 7, 4971 RSC.
- X. Lv, W. Wei, H. Wang, B. Huang and Y. Dai, Appl. Catal., B, 2019, 255, 117743 CrossRef CAS.
- W. Hong, K. Stoerzinger, Y. L. Lee, L. Giordano, A. Grimaud, A. Johnson, J. Hwang, E. Crumlin, W. Yang and S. Yang, Energy Environ. Sci., 2017, 10, 2190 RSC.
Footnotes |
| † Electronic supplementary information (ESI) available: Characterization and additional figures. See DOI: 10.1039/d1ma01168e |
| ‡ These authors contributed equally. |
| This journal is © The Royal Society of Chemistry 2022 |

