 Open Access Article
Aluminum sheet-induced porous zinc oxide nanosheets decorated with silver nanoparticles for ultrasensitive SERS sensing of crystal violet†
Xuejuan
Chen
,
Qiuli
Wang
,
Lixia
Qin
*,
Xiaoxia
Liu
,
Shi-Zhao
Kang
 ,
Taiyang
Zhang
and
Xiangqing
Li
 *
*
School of Chemical and Environmental Engineering, Center of Graphene Research, Shanghai Institute of Technology, 100 Haiquan Road, Shanghai 201418, China. E-mail: xqli@sit.edu.cn; lxqin@sit.edu.cn; Fax: +86 21 64253317; Tel: +86 21 60873061
First published on 3rd February 2022
Abstract
In this work, porous zinc oxide (ZnO) nanosheets induced by Al sheets were fabricated (Al/ZnO) via a simple hydrothermal method for the first time. Subsequently, various sizes of silver nanoparticles (AgNPs) were in situ decorated on Al/ZnO and a highly sensitive surface enhancement Raman scattering (SERS) substrate Al/ZnO/Ag was prepared. The strong synergistic effect between AgNPs and Al/ZnO was confirmed by UV-vis diffuse reflectance and X-ray photoelectron spectroscopy (XPS). Interestingly, the substrate exhibited outstanding SERS response towards crystal violet (CV, a carcinogen used in external disinfectants) due to the high electromagnetic enhancement effect generated by AgNPs on the large amount of tip areas in Al/ZnO as well as the charge transfer among the components. The results showed that Al/ZnO/Ag (Ag content: 1.51 wt%) can detect the SERS signal of CV molecules at a low concentration of 1 × 10⁻¹³ mol L−1, and the analytical enhancement factors (AEF) can reach 2.45 × 10⁸. In addition, the Raman activity of Al/ZnO/Ag hardly changed within 42 days or after seven cycles. Moreover, the Al/ZnO/Ag substrate displayed high sensitivity, good uniformity and repeatability for the SERS detection of CV, and it showed good selectivity towards CV in actual water samples. The results demonstrate that the low-cost and portable Al/ZnO/Ag substrate has excellent practical ability for the trace detection of CV.
1. Introduction
As a typical veterinary drug, crystal violet (CV) is often used as a fungicide and antiparasitic drug in fish farming around the world.1,2 However, it is highly teratogenic, toxic and carcinogenic, which has a serious impact on the food chain, the ecosystem and human health. Therefore, it is vital to establish a sensitive and rapid method for the determination of CV in fishing waters.Surface enhancement Raman scattering (SERS) is a highly sensitive and effective analytical technology that can quickly identify various molecules.3,4 It is well known that Au or Ag have been constructed as nanostructures for SERS detection due to their stronger localized surface plasmon resonance (LSPR) characteristics.5–8 Specifically, the appropriate size of AgNPs can provide a higher SERS enhancement effect.9,10 However, the disadvantages of noble metal Ag substrates, such as high cost, poor stability and non-recyclability, limit their practical application.
Among the semiconductor SERS substrates, ZnO has been proven to be a promising candidate because of its structural versatility, tunable optical properties, efficient charge/energy-transfer processes with molecular structures, and so on.11–16 More importantly, by combining noble metal NPs with pure semiconductors, the LSPR absorption region of composite substrates can be expanded, which improves their SERS activity.17–19 Recently, a few Ag/ZnO-based nanocomposites have been constructed for SERS detection. For instance, three-dimensional ordered Ag/ZnO/Si hierarchical nanoflower arrays were fabricated, which showed an ultrasensitive detection limit for Rhodamine 6G (R6G) as low as 1 × 10⁻¹² mol L−1.20 Ag-coated flower-like ZnO nanorods arrays were prepared for the highly sensitive SERS detection of R6G at a low concentration of 1 × 10⁻¹⁴ mol L−1.21 ZnO nanosheets have proven to be effective in promoting SERS activity as their tip effects can provide more hot spots for AgNPs, which greatly enhances the electromagnetic (EM) enhancement effect of the ZnO nanosheet/Ag system.22,23 For example, ZnO–Ag hybrid mesoporous nanosheets grafted on ordered Si micropillar arrays were constructed for the sensitive SERS detection of explosives.24 Also, the 3D flexible substrate was designed via seeded ZnO nanosheets on aluminum foil by sputtering a layer of Au and deposited AgNPs, and numerous hot spots were established by Au and AgNPs on the substrate, which can be used for the sensitive detection of fungicide thiram (0.2 ng cm−2).25 However, the preparation method of the above substrates is relatively complex and costly, and also the detection sensitivity for environmental pollutants needs to be further improved. Therefore, the construction of ZnO nanosheets/Ag system with low cost, high sensitivity, and good recyclability is expected to be used for the SERS detection of trace CV in real environmental water samples.
In this work, aluminum (Al) sheet-induced porous ZnO nanosheets (Al/ZnO) with dense lamellar stack structure were prepared by a simple hydrothermal method. Subsequently, Al/ZnO decorated with different sizes of AgNPs (Al/ZnO/Ag) were constructed by the in situ reduction method. Interestingly, a strong electric field coupling effect was generated when AgNPs were loaded on large amounts of tip areas of ZnO in Al/ZnO. The relationship between the size of AgNPs and the SERS performance of CV on the Al/ZnO/Ag substrate was investigated in detail. In addition, the stability, uniformity, reproducibility, and selectivity of CV on the Al/ZnO/Ag substrate were further investigated.
2. Experimental section
2.1. Reagents
Al sheet (95% huaxin metal), sodium hydroxide (NaOH, 96%), hexamine (C6H12N4, 99.99%), zinc nitrate hexahydrate (Zn(NO3)2·6H2O, 99.99%), silver nitrate (AgNO3, AR), ascorbic acid (C6H8O6, AR), acetone (C3H6O, AR), and ethanol (C2H5OH, AR) were purchased from Sinopharm group chemical reagent Co. Ltd.2.2. Assembly of Al/ZnO/Ag substrates
Firstly, Al was sliced into 2 cm × 4 cm sheets, the stains on the surface were removed with detergent, etched in NaOH solution (0.5 mol L−1) for 5 min, and then washed three times with distilled water. Secondly, the etched Al sheets were soaked in a solution of Zn(NO3)2·6H2O (0.5 mol L−1) and C6H12N4 (0.5 mol L−1) with a molar ratio of 1![[thin space (1/6-em)]](https://www.rsc.org/images/entities/char_2009.gif) :
:![[thin space (1/6-em)]](https://www.rsc.org/images/entities/char_2009.gif) 1 in a water bath and reacted at 88 °C for 3 h. The Al/ZnO substrate was obtained by washing with distilled water and blow-drying. Thirdly, Al/ZnO was immersed in 30 mL AgNO3 solution (0.05 mol L−1) for 10 min. Under vigorous stirring, a certain amount of ascorbic acid solution was slowly added to reduce Ag+. When the reduction time was 5 min, the substrate was taken away, washed with distilled water, and air-dried. Using the same steps, Al/ZnO/Ag substrates with AgNPs of various sizes were prepared when the reduction time was 10 min, 15 min, 20 min, 25 min, and 30 min, respectively. For comparison, in the absence of ZnO, Al/Ag was also prepared according to the above method. Moreover, the ZnO and ZnO/Ag samples for TEM images were prepared by scraping off the surface of the Al/ZnO/Ag substrate.
1 in a water bath and reacted at 88 °C for 3 h. The Al/ZnO substrate was obtained by washing with distilled water and blow-drying. Thirdly, Al/ZnO was immersed in 30 mL AgNO3 solution (0.05 mol L−1) for 10 min. Under vigorous stirring, a certain amount of ascorbic acid solution was slowly added to reduce Ag+. When the reduction time was 5 min, the substrate was taken away, washed with distilled water, and air-dried. Using the same steps, Al/ZnO/Ag substrates with AgNPs of various sizes were prepared when the reduction time was 10 min, 15 min, 20 min, 25 min, and 30 min, respectively. For comparison, in the absence of ZnO, Al/Ag was also prepared according to the above method. Moreover, the ZnO and ZnO/Ag samples for TEM images were prepared by scraping off the surface of the Al/ZnO/Ag substrate.
2.3. Raman spectra measurement
20 μL of 1 × 10⁻⁷ mol L−1 CV solution was dropped onto the surface of the Al/ZnO/Ag sheet (2 cm × 4 cm) with a radius of 0.5 cm, and the Raman spectra of CV from multiple spots were collected by Raman spectroscopy (acquisition time: 20 s, excitation wavelength: 532 nm, and Raman laser spot radius: 2 mm). In addition, Raman signals of 1 × 10⁻⁷ mol L−1 CV on Al, Al/ZnO, ZnO/Ag, and Al/Ag substrates were also measured under the same conditions, respectively.The SERS measurement procedures of different concentrations were as follows: CV solutions of different concentrations (1 × 10⁻¹³ mol L−1 –1 × 10⁻⁷ mol L−1) were consecutively dropped onto the same batch of Al/ZnO/Ag substrates, and multiple points were selected on different substrates for the acquisition of Raman spectra. Moreover, the analytical enhancement factor (AEF) was calculated by the Raman intensity ratio of 1 × 10⁻⁷ mol L−1 CV on the Al/ZnO/Ag substrate to the 1 × 10⁻³ mol L−1 CV on the Al sheet.
2.4. The stability, uniformity, and repeatability of the Al/ZnO/Ag substrate
1 × 10⁻⁷ mol L−1 CV solution was dropped onto the Al/ZnO/Ag substrate and then was kept for 42 days. The stability of the Al/ZnO/Ag substrate was investigated by measuring the Raman signals of CV at different time periods. In addition, the newly prepared 1 × 10⁻⁷ mol L−1 CV solution was added into the Al/ZnO/Ag surface, and SERS signals of thirty-six different points on the substrate were collected to study the uniformity of the Al/ZnO/Ag substrate. After the Raman signal was collected in situ, the substrate was immersed in distilled water for 12 h and then dried. Then, CV solution (1 × 10⁻⁷ mol L−1) was dropped onto the substrate surface again, and the SERS signal was measured in situ. Next, the Raman signals of CV were collected seven times repeatedly to study the reproducibility of the Al/ZnO/Ag substrate.2.5. The selectivity of the Al/ZnO/Ag substrate for the SERS detection of CV
4-Thiophenol aminophenol (4-ATP), methylene blue (MB), thioglycolic acid (TA), malachite green (MG), and CV with the same concentration of 1 × 10⁻⁷ mol L−1 were added onto the surface of the Al/ZnO/Ag substrate for SERS detection, and all the SERS signals were collected, respectively. Also, in order to demonstrate the practical applicability of the substrate, the Raman spectrum of 1 × 10⁻⁷ mol L−1 CV spiked in real river water was measured.3. Results and discussion
3.1. Assembly process of the Al/ZnO/Ag substrates
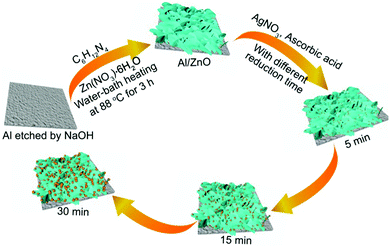
As shown in Scheme 1, firstly, the cleaned Al sheets (2 cm × 4 cm) were etched in NaOH solution for 5 min, and a large number of hydroxyl groups can be produced on Al sheets after the above process. Secondly, Al sheets were soaked in Zn(NO3)2·6H2O and C6H12N4 solution, and heated in a water-bath at 88 °C for 3 h, and the ZnO nanosheets were obtained on the surface of the Al sheet. After that, the obtained Al/ZnO was immersed in AgNO3 solution with the concentration of 0.05 mol L−1, and Ag+ was gradually reduced to AgNPs following the addition of ascorbic acid. By changing the reduction time, Al/ZnO/Ag substrates with the loading of various sizes of AgNPs were obtained.3.2. Morphological characterization of Al/ZnO and ZnO
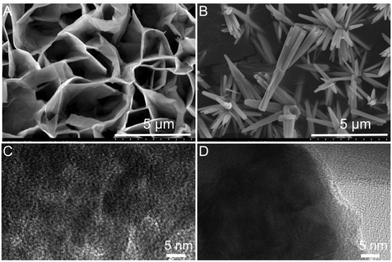
As shown in Fig. 1, the morphology of Al/ZnO and ZnO was characterized by the SEM and TEM images. As illustrated in Fig. 1A, obviously, the SEM image of Al/ZnO indicates that ZnO has a ridged lamellar structure on the Al sheet. Also, the surface layer of ZnO presents a dense porous structure on the Al sheet (Fig. 1C), and the pores are mainly focused at ∼ 3 nm and in the range of 12–35 nm (Fig. S1, ESI†). However, in the SEM (Fig. 1B) and TEM (Fig. 1D) images of ZnO without the induction of Al, it is evident that ZnO shows a shuttle-like structure with a smooth surface. Therefore, the Al sheet can be used as an excellent template to facilitate the formation of ZnO with a stacked lamellar structure, which would supply several active sites for the loading of AgNPs, and also its dense porous structure could adsorb more target molecules.3.3. Characterization of Al/ZnO/Ag
Fig. 2 show the SEM and TEM images of Al/ZnO/Ag and the corresponding size distribution of AgNPs in Al/ZnO/Ag at the reduction time of 15 min. As illustrated in Fig. 2A, obviously, most AgNPs are spherical, which adhere closely to the surface of Al/ZnO and mainly distribute on the tip regions and lamellas of ZnO. Additionally, the morphology and distribution state of Ag in Al/ZnO/Ag are characterized by the TEM image. As shown in Fig. 2B, it can be clearly observed that AgNPs exhibit uniform distribution on the surface of ZnO, and the size is concentrated on ∼99 nm. In addition, the SEM images of Al/ZnO/Ag with other reduction times of 5, 10, 20, and 30 min are also collected (Fig. S2, ESI†). Briefly, when the reduction time was 5 or 10 min, most of the AgNPs are irregular spheres (Fig. S2A and B, ESI†). It can be observed from Fig. S2B and C (ESI†) that as the reduction time increases from 20 min to 30 min, most AgNPs are aggregated significantly and the Ag nanoclusters are formed (Fig. S2D, ESI†). The above results clearly reveal that the AgNPs have good dispersion and uniform size distribution when the reduction time is 15 min (∼99 nm).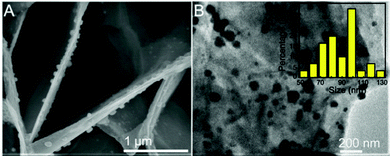 | ||
| Fig. 2 (A) SEM and (B) TEM images of Al/ZnO/Ag at a reduction time of 15 min; the inset in B is the corresponding size distribution of AgNPs in Al/ZnO/Ag. | ||
The possible explanations are as follows: firstly, the lamellar network structure of ZnO in the Al/ZnO substrates have proper geometric restrains on the anisotropic growth of AgNPs.26,27 Secondly, the homogeneous porous structure on the edge and surface of ZnO nanosheets in Al/ZnO provides more active sites for the growth of AgNPs. Therefore, the AgNPs are uniformly distributed on the lamellar edge and the homogeneous porous surface, and the size of AgNPs gradually increases until agglomeration is formed with the extension of the reduction time.
The morphology and phase of Al/ZnO and Al/ZnO/Ag were further characterized by TEM and XRD. As shown in Fig. 3A and B, clearly, the edges and surfaces of ZnO on the Al sheets have uniform porous structures, and the lattice spacings of 0.28 nm and 0.26 nm belonged to the crystal faces of ZnO(100) and (002), respectively.28 As illustrated in Fig. 3C and D, spherical AgNPs with uniform size can be observed on the surface of Al/ZnO, and the lattice distances of 0.204 nm and 0.123 nm are assigned to the crystal planes of Ag(220) and (311), respectively.29 As shown in Fig. 3E, 2θ values at 22.7°, 34.8°, and 61.4° can be observed in Al/ZnO (Fig. 3E-a) and Al/ZnO/Ag (Fig. 3E-b), which are ascribed to the crystal faces of ZnO(100), (002), and (103), respectively.30 Also, in the XRD pattern of Al/ZnO/Ag (Fig. 3E-b), two peaks at 64.4° and 77.3° are obviously observed, belonging to the (220) and (311) crystal faces of Ag, respectively,31 which are in good agreement with the TEM images. The above results indicate that the Al/ZnO/Ag substrate is successfully assembled.
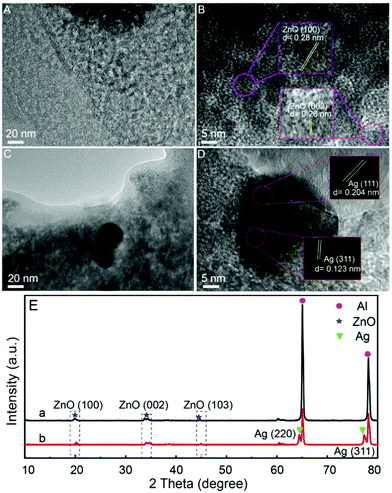 | ||
| Fig. 3 TEM images of (A) Al/ZnO and (C) Al/ZnO/Ag; HRTEM images of (B) Al/ZnO and (D) Al/ZnO/Ag; (E) XRD patterns of Al/ZnO (a) and Al/ZnO/Ag (b). | ||
Moreover, the distribution of various elements in Al/ZnO/Ag was measured by elemental mapping. As shown in Fig. S3B and E, (ESI†) the main distribution of Zn presents a multilayer nanosheet structure, and the elemental O from ZnO is uniformly distributed in the sample (Fig. S3C, ESI†). Also, the distribution of Ag element on the surface of ZnO lamellar array in Al/ZnO is obviously observed (Fig. S3D, ESI†). The overlay image of the elements shown in Fig. S3E (ESI†) corresponds to the SEM image of Al/ZnO/Ag (Fig. S3A, ESI†). As illustrated in Fig. S4, (ESI†) EDX analysis shows that the proportion of Ag is only 1.51 wt%. These results further confirm that the Al/ZnO/Ag substrate with low cost is successfully fabricated.
The Al/ZnO and Al/ZnO/Ag substrates were further characterized by XPS. In Fig. 4A-a, the peaks of Zn 2p3/2 and 2p1/2 in Al/ZnO are situated at 1021.1 eV and 1044.4 eV, respectively,32 which shift to 1021.8 eV and 1044.9 eV after the introduction of Ag in Al/ZnO (Fig. 4A-b). The results demonstrated that there is strong binding ability between ZnO and Ag. From the XPS spectrum of O 1s in Al/ZnO (Fig. 4B-a), it can be found that the spectral lines are asymmetrical, which can be decomposed into two peaks, i.e., 531.4 eV and 530.5 eV, respectively, indicating that there are two chemical states of O on the Al/ZnO surface. The peak at 531.4 eV is related to the O lattice of the ZnO phase, and the peak at 530.5 eV is relevant to the O binding hydroxide on the surface, which is perhaps due to the hydration or the defect sites of ZnO.33,34 When the AgNPs are decorated on the Al/ZnO surface, clearly, the peaks of O 1s shift to 531.5 eV and 532.4 eV (Fig. 4B-b), respectively, demonstrating that strong coupling occurs between AgNPs and ZnO in Al/ZnO.35 As illustrated in Fig. 4C, the peaks at 373.7 eV and 367.8 eV are attributed to Ag 3d3/2 and 3d5/2, respectively. The difference between the binding energies of Ag 3d3/2 and 3d5/2 is about 6.0 eV, which further proves that metal Ag exists in Al/ZnO/Ag.36
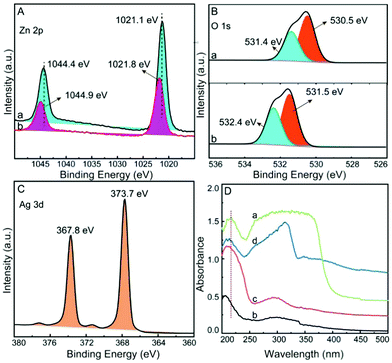 | ||
| Fig. 4 High-resolution XPS of Zn (A), O (B) and Ag (C), a: Al/ZnO, b: Al/ZnO/Ag; (D) solid diffuse reflectance UV-vis absorption spectra of ZnO (a), Al (b), Al/ZnO (c) and Al/ZnO/Ag (d). | ||
Solid diffuse reflectance UV-vis absorption spectra of ZnO (a), Al (b), Al/ZnO (c), and Al/ZnO/Ag (d) are measured. As illustrated in Fig. 4D-a, an absorption peak at 216 nm and the obvious UV-light absorption in the range of 250 nm–400 nm are clearly observed in the spectrum of ZnO.37 In comparison of ZnO (Fig. 4D-a) and Al sheet (Fig. 4D-b), the characteristic peak of ZnO in Al/ZnO shifts from 216 to 209 nm (Fig. 4D-c), indicating that there is strong coupling between the etched Al sheet and ZnO. Also, in the spectrum of Al/ZnO/Ag (Fig. 4D-d), an absorption peak at 400 nm corresponding to the plasma absorption of Ag is clearly observed,38 and the typical peak of ZnO in the Al/ZnO/Ag is shifted to 213 nm, demonstrating that there exists strong binding ability between Ag and ZnO in Al/ZnO. By means of SEM, TEM, XRD, XPS, and UV-vis absorption, it is confirmed that Al/ZnO/Ag is successfully fabricated by strong coupling among Al, ZnO, and Ag.
3.4. Raman response of different substrates with various reduction times
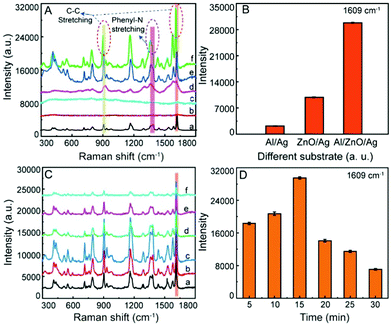
Moreover, with CV as a target molecule (its structure was shown in Fig. S5, ESI†), the SERS activity of the Al/ZnO/Ag substrates was evaluated. As illustrated in Fig. 5A-a, clearly, the typical Raman peaks of 1 × 10⁻³ mol L−1 CV at 910, 958, 1070, 1158, 1242, 1287, 1358, 1384, 1428, 1524, 1580, and 1603 cm−1 are observed on the Al sheet. However, there are no obvious characteristic Raman peaks for 1 × 10⁻⁷ mol L−1 CV on Al (b) and Al/ZnO (c), demonstrating that Al and Al/ZnO are insensitive to CV at lower concentrations. In addition, as illustrated in Fig. 5A-d, only weak SERS signals of 1 × 10⁻⁷ mol L−1 CV are observed on Al/Ag, and also, the SERS response of CV is enhanced on the ZnO/Ag substrate (Fig. 5A-e). Interestingly, the characteristic Raman peak of CV on the Al/ZnO/Ag substrate is significantly enhanced (Fig. 5A-f). As shown in Fig. 5B, the histogram of the SERS intensity of CV on Al/Ag, ZnO/Ag, and Al/ZnO/Ag is given based on the characteristic Raman peak of CV at 1609 cm−1. Clearly, the SERS intensity of CV on the Al/ZnO/Ag substrate is 5.6 and 9.75 times those on the ZnO/Ag and Al/Ag substrates, respectively, demonstrating that there is strong synergistic effect among Al, ZnO, and Ag. Also, the three dominant typical peaks of CV (1 × 10⁻³ mol L−1) at 1603 and 910 cm−1 on the Al sheet (Fig. 5A-a) shift to 1609 and 916 cm−1 on the Al/ZnO/Ag substrate (Fig. 5A-f), respectively. In addition, the two typical Raman bands of CV at 1358 and 1384 cm−1 belong to phenyl-N stretching, which shift to 1363 and 1378 cm−1 on the Al/ZnO/Ag substrate, respectively. The above results indicate that the strong binding of Ag in Al/ZnO/Ag and “N” in CV takes place via the Ag–N bond.In order to investigate the effect of the AgNPs’ size on the activity of the substrate, the SERS response of CV (1 × 10⁻⁷ mol L−1) on the Al/ZnO/Ag at different reduction times were collected. As shown in Fig. 5C and D, when the reduction time increases from 5 to 15 min (size of Ag: 44–99 nm), the SERS intensity of CV gradually increased (a–c), and the SERS activity reaches the maximum when the reduction time is 15 min (size of Ag: ∼99 nm). However, as the reduction time increases from 20 to 30 min (size of Ag: 100–110 nm), the SERS intensity of CV on the Al/ZnO/Ag substrate is greatly decreased. On the basis of the above results, we can conclude that the SERS activity of the Al/ZnO/Ag substrate is closely related to the size of the AgNPs and the intergranular space, and the SERS activity of the Al/ZnO/Ag substrate is the highest when the size of Ag is 99 nm, which generates strong LSPR. The difference in the activity of the SERS substrates could be attributed to the change in the amount and size of Ag in the substrate. In the initial stages of reduction (5 min), a small amount of AgNPs with small size (∼44 nm) appear on the Al/ZnO nanosheets, which gradually enhance the SERS signal of CV on the Al/ZnO/Ag substrate. As the reduction time is in the range of 10–15 min, the size of AgNPs gradually increases (75–99 nm), and more AgNPs are located on the surface and tip edges of the ZnO nanosheets, which significantly enhance the SERS activity of CV on the Al/ZnO/Ag substrate. However, as the reduction time continues to be prolonged, the size and amount of AgNPs increase, and the spacing between each AgNPs decrease sharply, leading to a great reduction in the SERS intensity of CV on the Al/ZnO/Ag substrate.
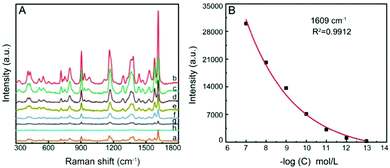
Fig. 6 shows the SERS spectra of CV on the Al/ZnO/Ag substrate at different concentrations. Clearly, the Raman response of CV is reduced gradually with the decrease in the CV concentration (b–h). When the concentration is 1 × 10⁻¹³ mol L−1, some characteristic peaks of CV can still be observed, indicating that this Al/ZnO/Ag substrate possesses a high SERS detection sensitivity toward CV. The relationship of SERS intensity at a typical band of 1609 cm−1 and different concentrations of CV is illustrated in Fig. 6B. The results present a good linear relationship within the concentration range of 1 × 10⁻⁷ –1 × 10⁻¹³ mol L−1. Also, the detection limit of the Al/ZnO/Ag substrate for CV can reach 3.6 × 10⁻¹⁴ mol L−1. It is indicated that the high SERS sensitivity is ascribed to the effective hot spots generated on the lamellar structure of ZnO nanosheets, which make AgNPs mainly distributed at the tip edges of the ZnO nanosheets, thus generating strong electromagnetic enhancement effect and enhancing the SERS signals. In addition, the analytical enhancement factor (AEF) of the substrate is estimated to be 2.45 × 10⁸ for Al/ZnO/Ag (details in the ESI†). The high AEF indicates that the Al/ZnO/Ag substrate can be used for the highly sensitive detection of environmental pollutants. As shown in Table S1, (ESI†) it is found that the constructed Al/ZnO/Ag substrate exhibits a more sensitive SERS response toward CV, and the content of Ag in this substrate is relatively small (only about 1.51 wt%), indicating that the cost of the substrate is lower, which is competitive in practical application.
3.5. Stability, uniformity, and repeatability of the substrate
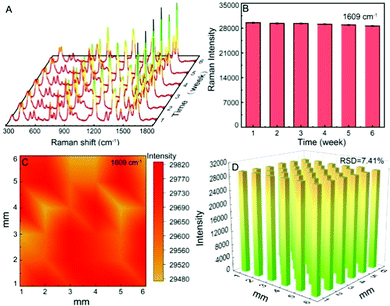
In actual analysis and detection, the stability, uniformity, and repeatability of the SERS substrate are also vital parameters. In order to study the stability of the substrate, the SERS spectra of CV on the same Al/ZnO/Ag substrate are collected at different weeks (Fig. 7A), and the corresponding SERS intensity at 1609 cm−1 is illustrated in Fig. 7B. Obviously, the SERS intensities are hardly changed at different storage times (1–6 weeks), indicating that the Al/ZnO/Ag substrate has excellent stability under air conditions due to the stacked lamellar structure of ZnO, which can protect AgNPs from being oxidized in air. Also, the strong synergistic effect among Al, ZnO, and Ag could enhance the stability of Al/ZnO/Ag during long-term storage.In addition, the Raman mapping of CV (1 × 10⁻⁷ mol L−1) on the Al/ZnO/Ag substrate was conducted with a selected area of 60 × 60 μm2. Obviously, it can be seen from Fig. 7C that the substrate has a high uniformity. Besides, the SERS intensity of CV at 1609 cm−1 with thirty-six randomly selected points is almost unchanged over the entire mapping area (Fig. 7D), and the relative standard deviation (RSD) is 7.41%, indicating that this substrate is well distributed. It should be noted that the most important cause of this superior performance is the even distribution of AgNPs on the lamellar structure of Al/ZnO, and a strong coupling effect between ZnO and AgNPs in the substrate.
Moreover, the repeatability of the Al/ZnO/Ag substrate is evaluated by collecting all the SERS spectra of CV after several cycles (Fig. S6A, ESI†), and the SERS intensity of CV at the band of 1609 cm−1 was plotted (Fig. S6B, ESI†). The results demonstrate that the SERS response of CV on the Al/ZnO/Ag substrate is almost unchanged after six cycles, and the relative SERS intensity is slightly decreased, indicating that the Al/ZnO/Ag substrate has good repeatability. Therefore, these results demonstrated that the Al/ZnO/Ag substrate can be used for highly sensitive SERS detection with excellent stability, uniformity, and reproducibility.
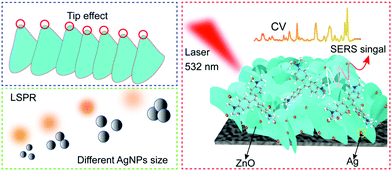
According to the above results, the highly sensitive SERS response of the Al/ZnO/Ag substrate was attributed to the electromagnetic mechanism and chemical mechanism (Scheme 2). Firstly, the Al/ZnO surface provides dense lamellar porous structure with more tip areas, which generate abundant active sites for the growth of AgNPs. When appropriate amount and size of AgNPs are uniformly distributed on the tip regions of the Al/ZnO lamellar structure,39 strong LSPR of AgNPs is generated,40 which corresponded to electromagnetic enhancement. Secondly, the outstanding SERS response of CV on the Al/ZnO/Ag substrate is also attributed to the strong synergistic effect among Al, ZnO, and Ag. Thirdly, Al/ZnO/Ag can absorb more CV molecules due to the strong binding of Ag in Al/ZnO/Ag and “N” in CV via the Ag–N bond, which make CV molecules close to the hot spots generated by the highly active AgNPs; thus, the SERS signals are significantly enhanced. Meanwhile, the appropriate amount and size of AgNPs on the tip regions of Al/ZnO possess high intensity of SPR, which can impel several “hot electrons” from ZnO to the CV molecules; hence, the excited-state charge transfer can easily be conducted, which is assigned to chemical enhancement.19 Thus, the dense lamellar porous structure of Al/ZnO not only promotes AgNPs to produce high SERS enhancement effect but also facilitates the charge transfer process, and thus the SERS signals are significantly enhanced.
3.6. Selectivity of the Al/ZnO/Ag substrate for the SERS detection of CV in spiked water samples
Moreover, the selectivity of the Al/ZnO/Ag substrate for the detection of CV was evaluated. Fig. 8A displays the Raman response of 4-ATP, TA, MB, MG, and CV at the same concentration of 1 × 10⁻⁷ mol L−1 on the Al/ZnO/Ag substrate. The SERS spectrum of 4-ATP (a), TA (b), MB (c), and MG (d) is shown in Fig. 8A; clearly, only very weak peaks are observed for each molecule. Interestingly, the strong typical SERS peaks of CV are observed under the same conditions, which exhibit the highest SERS intensity on the Al/ZnO/Ag substrate. The above results clearly demonstrated that the Al/ZnO/Ag substrate shows high selectivity for the SERS detection of CV even at a low concentration. Moreover, in order to demonstrate the practicability of the Al/ZnO/Ag substrate for the SERS detection of CV, 1 × 10⁻⁷ mol L−1 CV was spiked in river water (Fig. 8B-b) and deionized water (Fig. 8B-c) for SERS analysis. Obviously, all the characteristic peaks of CV were clearly visible compared to that in unspiked river water (Fig. 8B-a). Importantly, 1 × 10⁻⁷ mol L−1 CV in the real river water still exhibits strong SERS response with the same concentration in deionized water on the Al/ZnO/Ag substrate (Fig. 8C). The results further confirm that the Al/ZnO/Ag substrate can be used for the highly sensitive SERS detection of CV with good selectivity in real-sample analysis.4. Conclusions
In summary, Al sheet-induced stacked ZnO nanosheet structure was synthesized by a simple hydrothermal method (Al/ZnO). Subsequently, AgNPs were in situ decorated on the Al/ZnO surface, and a sensitive, cheap, and recyclable SERS substrate of Al/ZnO/Ag was prepared. The results indicated that there was a strong coupling effect between AgNPs and ZnO in Al/ZnO, and AgNPs were mainly distributed on the tip edges of the ZnO lamellar structure, and thus the effect of electromagnetic field is significantly enhanced. This substrate can be used for highly sensitive and selective SERS detection of CV molecules, and the limit of detection can reach 3.6 × 10⁻¹⁴ mol L−1. In addition, the Al/ZnO/Ag substrate showed continuous stability, high uniformity, and good reproducibility. Therefore, the prepared Al/ZnO/Ag substrate with superior performance has potential application prospects in the SERS detection of environmental pollutants.Conflicts of interest
There are no conflicts to declare.Acknowledgements
This work was financially supported by Scientific Research Project of Shanghai Municipal Science and Technology Commission (No. 19090503700), the National Natural Science Foundation of China (No. 21771125, 21301118 and 21305092).References
- H. P. Fu, J. M. Chen, L. J. Chen, X. Zhu, Z. L. Chen, B. Qiu, Z. Y. Lin, L. H. Guo and G. N. Chen, Microchim. Acta, 2019, 186, 64–70 CrossRef PubMed.
- Y. Z. Zhu, M. Tian, Y. Chen, Y. J. Yang, X. P. Liu and S. Y. Gao, Nano Energy, 2021, 83, 105824–105833 CrossRef CAS.
- Q. Q. Peng, N. Wang, Y. Zhu, J. Hu, H. Q. Peng, L. Li, B. Z. Zheng, J. Du and D. Xiao, J. Mater. Chem. C, 2019, 7, 10465–10470 RSC.
- C. C. Li, Y. M. Huang, X. Y. Li, Y. R. Zhang, Q. L. Chen, Z. W. Ye, Z. Alqarni, S. E. J. Bell and Y. K. Xu, J. Mater. Chem. C, 2021, 9, 11517–11552 RSC.
- Y. T. Long, H. Li, Z. J. Du, M. M. Geng and Z. R. Liu, J. Colloid Sci., 2021, 581, 698–708 CrossRef CAS PubMed.
- A. D. Chowdhury, F. Nasrin, R. Gangopadhyay, A. B. Ganganboina, K. Takemura, I. Kozaki, H. Honda, T. Hara, F. Abe, S. Park, T. Suzuki and E. Y. Park, Biosens. Bioelectron., 2020, 170, 112657–112666 CrossRef CAS PubMed.
- S. Yang, X. Dai, B. B. Stogin and T. S. Wong, Proc. Natl. Acad. Sci. U. S. A., 2016, 113, 268–273 CrossRef CAS PubMed.
- T. Zhang, Y. Sun, L. Hang, H. Li, G. Liu, X. Zhang, X. Lyu, W. Cai and Y. Li, ACS Appl. Mater. Interfaces, 2018, 10, 9792–9801 CrossRef CAS PubMed.
- Z. Y. Cao, P. He, T. Huang, S. W. Yang, S. C. Han, X. Y. Wang and G. Q. Ding, Chem. Mater., 2020, 32, 3813–3822 CrossRef CAS.
- K. G. Stamplecoskie, J. C. Scaiano, V. S. Tiwari and H. Anis, J. Phys. Chem. C, 2011, 115, 1403–1409 CrossRef CAS.
- V. Consonni, J. Briscoe, E. Karber, X. Li and T. Cossuet, Nanotechnology, 2019, 30, 362001–362012 CrossRef CAS PubMed.
- L. Roza, V. Fauzia and M. Y. Abd Rahman, Appl. Surf. Sci., 2019, 15, 117–124 CAS.
- T. Dutta, D. Bagchi, A. Bera, S. Das, T. Adhikari and S. K. Pal, ACS Sustainable Chem. Eng., 2019, 7, 10920–10932 CrossRef CAS.
- E. Proniewicz, A. Tata, M. Starowicz, A. Szkudlarek, J. Pacek, M. Molenda and P. Kustrowski, Spectrochim. Acta, 2019, 215, 24–33 CrossRef CAS PubMed.
- C. Liu, Q. Song, J. Chen, X. Li, J. Cai, Z. Lu, W. Li, N. X. Fang and S. P. Feng, Adv. Mater. Interfaces, 2019, 6, 1900534–1900545 CrossRef.
- Y. Quan, J. Yao, S. Yang, L. Chen, J. Li, Y. Liu, J. Lang, H. Shen, Y. Wang, Y. Wang, J. Yang and M. Gao, Microchim. Acta, 2019, 186, 593–601 CrossRef PubMed.
- X. L. Zheng, H. L. Guo, Y. Xu, J. L. Zhang and L. Z. Wang, J. Mater. Chem. C, 2020, 8, 13836–13842 RSC.
- L. Zhou, H. Zhang, H. Bao, G. Liu, Y. Li and W. Cai, J. Phys. Chem. C, 2018, 122, 8628–8636 CrossRef CAS.
- J. Zhou, J. Zhang, H. Yang, Z. Wang, J. A. Shi, W. Zhou, N. Jiang, G. Xian, Q. Qi, Y. Weng, C. Shen, Z. Cheng and S. He, Nanoscale, 2019, 11, 11782–11788 RSC.
- S. J. Li, N. N. Zhang, N. M. Zhang, D. D. Lin, X. F. Hu and X. J. Yang, Sens. Actuators, B, 2020, 321, 128519–128528 CrossRef CAS.
- Q. Sun, Q. Y. Zhang, N. Zhou, L. Y. Zhang and Z. Yi, Appl. Surf. Sci., 2020, 526, 146565–146574 CrossRef CAS.
- X. Wang, W. Shi, Z. Jin, W. Huang, J. Lin, G. Ma, S. Li and L. Guo, Angew. Chem., Int. Ed., 2017, 56, 9851–9855 CrossRef CAS PubMed.
- J. Lin, J. Yu, O. U. Akakuru, X. T. Wang, B. Yuan, T. X. Chen, L. Guo and A. G. Wu, Chem. Sci., 2020, 11, 9414–9420 RSC.
- X. He, Y. Liu, Y. Liu, S. Cui, W. Liu and Z. B. Li, CrystEngComm, 2020, 22, 776–785 RSC.
- Y. Wang, X. F. Yu, Y. H. Chang, C. L. Gao, J. Chen, X. L. Zhang and J. H. Zhan, Microchim. Acta, 2019, 186, 458–466 CrossRef PubMed.
- L. Q. Kong, Y. J. Ji, Z. Z. Dang, J. Q. Yan, P. Li, Y. Y. Li and S. Z. Liu, Adv. Funct. Mater., 2018, 28, 1800668–1800677 CrossRef.
- Y. N. Xia, P. D. Yang, Y. G. Sun, Y. Y. Wu, B. Mayers, B. Gates, Y. D. Yin, F. Kim and H. Q. Yan, Adv. Mater., 2003, 15, 353–389 CrossRef CAS.
- Y. Cheng, W. Z. Wang, L. Z. Yao, J. Wang, H. S. Han, T. Y. Zhu, Y. J. Liang, J. L. Fu and Y. N. Wang, Colloids Surf., A, 2020, 607, 125507–125516 CrossRef CAS.
- Z. M. Zhang, J. Hu, Y. Y. Wang, R. C. Shi, Y. W. Ma, H. L. Huang, H. Wang, J. X. Wei and Q. J. Yu, Corros. Sci., 2021, 184, 109393–109404 CrossRef CAS.
- F. Lu, J. Wang, Z. Chang and J. Zeng, Mater. Des., 2019, 14, 108069–108081 CrossRef.
- S. Shao, X. Chen, Y. Chen, L. Zhang, H. W. Kim and S. S. Kim, ACS Appl. Nano Mater., 2020, 3, 5220–5230 CrossRef CAS.
- Q. C. Li, D. Chen, J. M. Miao, S. J. Lin, Z. X. Yu, D. X. Cui, Z. Yang and X. P. Chen, Sens. Actuators, B, 2021, 326, 128952–128961 CrossRef CAS.
- H. H. Yu, Q. L. Liao, Z. Kang, Z. Y. Wang, B. S. Liu, X. K. Zhang, J. L. Du, Y. Ou, M. Y. Hong, J. K. Xiao, Z. Zhang and Y. Zhang, Small, 2020, 26, 2005520–2005529 CrossRef PubMed.
- B. P. Zhang, D. J. Yang, X. Q. Qiu, Y. Qian, H. Wang, C. H. Yi and D. Q. Zhang, Carbon, 2020, 162, 256–266 CrossRef CAS.
- C. D. Wang, X. H. Xu, G. Y. Qiu, W. C. Ye, Y. M. Li, R. A. Harris and C. Y. Jiang, Anal. Chem., 2021, 93, 3403–3410 CrossRef CAS PubMed.
- J. M. Chen, Z. R. Shen, S. M. L. K. Shen, R. F. Wu, X. F. Jiang, T. Fan and J. Y. Chen, J. Mater. Chem. A, 2018, 6, 19631–19642 RSC.
- H. Mou, C. Song, Y. Zhou, B. Zhang and D. Wang, Appl. Catal., B, 2018, 221, 565–573 CrossRef CAS.
- A. A. Vinotha, D. Tushar, N. Chandrasekaran and M. Amitava, Anal. Chim. Acta, 2021, 1142, 73–83 CrossRef PubMed.
- L. Zhang, X. D. Li, Y. Y. Jin, Y. L. Zhang, X. M. Liu, Y. L. Chang, L. J. Xu, H. Y. Zhao, L. P. Tu, D. Wang, X. G. Kong and B. Xue, Appl. Surf. Sci., 2019, 493, 423–430 CrossRef CAS.
- T. Wang, Y. Huang, Z. Liu and N. R. Barveen, J. Alloys Compd., 2021, 864, 158120–158130 CrossRef CAS.
Footnote |
| † Electronic supplementary information (ESI) available. See DOI: 10.1039/d1ma01181b |
| This journal is © The Royal Society of Chemistry 2022 |

