 Open Access Article
Borate polyanions tuning persistent luminescence in Eu and Dy co-doped strontium aluminate†
Arzu
Coşgun Ergene
 a,
Sirous
Khabbaz Abkenar
 a,
Ece
Deniz
 a and
Cleva W.
Ow-Yang
 *ab
*ab
aMaterials Science and Nano-Engineering Program, Sabanci University, Orta Mah. Universite Cad. No 27, 34956 Tuzla/Istanbul, Turkey. E-mail: cleva@sabanciuniv.edu
bNanotechnology Research and Application Center, Sabanci University, Orta Mah. Universite Cad. No 27, 34956 Tuzla/Istanbul, Turkey
First published on 22nd February 2022
Abstract
Although the longest duration of persistent luminescence in Eu and Dy co-doped strontium aluminate (S4A7ED) is obtained by processing with 30 mol% B2O3 (S4A7EDB), this composition does not contain the highest amount of the long persistence phase. To elucidate how the structural arrangement of atoms in S4A7EDB induced by synthesis using 30–40 mol% B2O3 yields the longest persistence, the crystal environment of B in S4A7ED is evaluated by using micro-Raman and FTIR spectroscopy. Polyatomic vibration modes containing B–O are revealed, in forms of metaborate and other borate polyanions. Based on these results, we propose a structural model for S4A7EDB, in which B introduces non-bridging oxygen, which offers excess negative charge and enlarged adjacent Sr sites, both of which enable Eu and Dy dopant clustering that yields extreme persistent luminescence.
Introduction
Eu2+, Dy3+ and B co-doped Sr4Al14O25 (S4A7EDB) is well known to exhibit persistent luminescence. Boron oxide, initially used as a sintering flux agent to facilitate synthesis at lower temperatures and stoichiometric grain growth, was noted to extend persistent luminescence in Eu and Dy co-doped SrAl2O4 (SAED) and S4A7ED from ca. 10 minutes to longer than 10 h.1–3 Understanding the exact role of B in forming the crystal structure has motivated investigations into its location and crystal environment.4–6 Nag had reported the existence of BO4 units, which were revealed by NMR and FTIR,5 and which was confirmed by spatially resolved analysis of the B–K ionization edge energy loss near-edge structure (ELNES).4 Boron incorporation in RE co-doped S4A7 was also associated with a blue shift in emission at 400 nm, which was attributed to lattice shrinkage.6 Additional peaks were observed in the photoluminescence (PL) and thermoluminescence (TL) spectra, which were interpreted as additional traps due to the incorporation of B into the SAED crystal structure,7 while B modification of trap depth and density has been reported in other persistent afterglow compounds as well.8,9 To explain the role of boron, theoretical studies suggested the clustering of the point defects, Eu+2, Dy+3, B, and oxygen vacancies.10 In nano-S4A7 produced by a microemulsion method, 15–20 mol% has been reported as the optimum boric acid concentration for the maximum intensity and duration of the persistent luminescence.11B2O3 is known to serve as a network former in oxide glasses, where it forms polyhedral units due to being covalently bonded with charge-screening oxygen.12,13 Each oxygen is saturated, i.e., bonded to 2 cations. Network modifiers, on the other hand, contribute non-bridging oxygens to the network. Because they do not completely link the maximum number of polyhedral units—i.e., 2 units per oxygen—their presence lowers the network connectivity, resulting in more open networks. Alkaline oxides and alkali earth oxides are common modifiers, and the presence of their cations provides local electrical charge neutrality.14,15 Network intermediates act as glass formers or modifiers, depending on the local network structure and composition.12,14 The structure of boron oxide consists of corner-sharing triangular polyhedra. Vitreous boron oxide has planar six-membered boroxyl rings containing trigonal uncharged [BØ3], where Ø indicates bridging oxygen, and O indicates non-bridging oxygen.16 Combinations of basic borate structural units form superstructural units, such as borate rings, diborates, metaborate ring-chains, pyroborate dimers, etc.13,17,18
Cation additions can change the oxide network character. For example, B2O3 incorporation into alumina glass induces changes in the types and connectivity of borate and aluminate structural units. Boron oxide functions as both a former and modifier in alumino–borate (Al2O3–B2O3) networks, depending on their relative concentration ratio.19
The change in the structural function of boron oxide is commonly referred to as the boron anomaly. With the addition of modifier oxides, planar trigonal charge-neutral [BØ3] triangles initially transform to negatively charged, tetrahedral [BO4]− of 3-D character. Upon increasing the amount of modifier added to Al2O3–B2O3, the number of non-bridging oxygens increases, breaking up the oxide network connectivity.16,19,20 Above a critical modifier concentration, the coordination number of boron converts back from four to three, in the form of complex triangular moieties—the ones with non-bridging oxygen on meta [BØ2O]−, pyro [BØO2]2− and finally ortho [BO3]3− units.13,21 Thus, while boron effectively densifies the alumina polyhedral network at low modifier concentrations, the increase in non-bridging oxygen yields increased free volume in the network at elevated modifier concentrations. The structural connectivity of borate-containing glass can be quantified by the relative amount of 3- and 4-coordinated boron, with the relative ratio being defined as N4 = (B4/(B3 + B4)). This metric facilitates the correlation of the structure with optical and thermal properties.
The role of oxides in the complex strontium aluminate SrO–Al2O3–B2O3 network depends on the composition. Al+3 ions can be either a network former in Al2O3, forming AlO4 tetrahedra, or a network modifier, by contributing non-bridging oxygen in the formation of AlO6 octahedra.19,22,23 Sr+2 ions are network modifiers in SrO, where they break up the network and provide charge compensation in interstitial sites.24 B2O3 can provide charge compensation to stabilize Al polyhedra.19
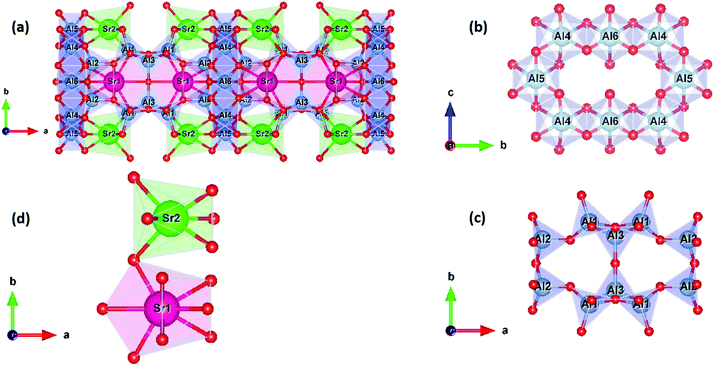
The crystal structure of Sr4Al14O25 is shown in Fig. 1a. Sr4Al14O25 crystallizes in the orthorhombic space group Pmma with unit cell parameters of a = 24.785 Å, b = 8.487 Å, and c = 4.886 Å; V = 1027.772 Å3; and α =β = γ = 90°. A network of corner- and edge-sharing alumina polyhedra defines a scaffold, i.e., chains of octahedra (Fig. 1b), sharing a single edge, defines the scaffold columns, while chains of corner-sharing tetrahedra bridge the columns (Fig. 1c). Sr2+ cations provide charge compensation in large interstitial cavities in two crystallographically non-equivalent sites: Sr1 coordinated by 10 oxygen and of Wyckoff symmetry 4j and Sr2 coordinated by 7 oxygen and of Wyckoff symmetry 4i (Fig. 1d).
Previous work in our group revealed the significant and multi-functional role of boron in the structural evolution of S4A7EDB during Pechini processing. Boron was associated with RE incorporation into adjacent Sr2+ sites in S4A7,25 as well as with a more uniform distribution of RE dopants in Sr2+ sites across the microstructure by nanoCL analysis.3 The boron-rich intergranular phase enabled tuning of the RE dopant concentration in S4A7 grains to reach their solubility limits, to avoid concentration quenching.4 In addition, trigonally coordinated boron was observed in the intergranular phase, while it was primarily of tetrahedral coordination in the S4A7 grains.4 We also observed that processing with boron oxide not only lowered the temperature needed for the crystal structure of S4A7 to form, but also modified the diffusion kinetics of Eu and Dy in playing a role in extending the afterglow persistence in S4A7EDB.3,4,25 Finally, the amount of boron oxide used in Pechini processing of S4A7EDB influenced the duration of persistent luminescence, with the longest in compounds containing 30–40 mol% B2O3. Interestingly, the total amount of the long afterglow phase was not at the maximum when this amount of B2O3 is used.26
In previous studies, vibration spectroscopy techniques have proved useful in determining the structure and local environment in polymorphic crystal structures and glassy ones, as well as those of borates. The Raman modes of SrAl2O4 (SA) have also been considered in several studies.27–29 Meanwhile, crystal structure changes due to dopant and impurity incorporation have been studied with Raman spectroscopy.30 Raman and infrared spectroscopy are commonly used as complementary techniques for elucidating the local structure in modified glass and crystalline structures.31–37 Keiner and co-workers demonstrated the use of micro-Raman and FTIR to correlate spatially resolved information about molecular and network structures.38
In this work, to understand how the B2O3 content tunes the structure and luminescence behavior of S4A7ED, we synthesized S4A7EDB by Pechini processing using different amounts of B2O3; analyzed the phase composition and changes in the atomic arrangements in the crystal structure by XRD, the crystal environment of B by micro-Raman and FTIR spectroscopy; and measured the duration of persistent luminescence by afterglow decay.
Experimental methods
Sr4Al14O25 compound doped with 1 at % Eu, 1 at % Dy and 0 ≤ x ≤ 60 mol% B2O3 was synthesized by a sol–gel Pechini process as described by Inan Akmehmet et al.3 The raw materials were aluminum nitrate nonahydrate [Al(NO3)3·9H2O], strontium nitrate anhydrous [Sr(NO3)2], europium nitrate hexahydrate [Eu(NO3)3·6H2O], dysprosium nitrate pentahydrate [Dy(NO3)3·5H2O], boron oxide (B2O3), chelating agent citric acid monohydrate (C6H8O7), and the gelling agent ethylene glycol (C2H6O2). The amorphous powder precursors were calcined at 600 °C for 6 h and then 1150 °C for 10 hours in air. The mixtures were then ground and reduced at 1150 °C for 4 h under a reducing atmosphere (96% Ar, 4% H2).The finely ground powder is used in all measurements. The afterglow persistence of S4A7EDxB samples (0 ≤ x ≤ 60 mol% B2O3) was collected by using a custom-built optical bench photoluminescence system consisting of a photomultiplier tube (H7421; Hamamatsu Photonics Deutschland GmbH, Herrsching, Germany) coupled with a photon counting unit (C-8855, Hamamatsu Photonics Deutschland GmbH), after illuminating the powder with a 365 nm UV light source for 10 minutes, and then recorded for up to 14 h.
Crystal structure analysis and phase identification were performed by XRD (Bruker AXS, D8 Advance: Cu-Kα source (λ = 1.54056 Å), scanning rate 1 s per step, 0.02° increment, over a 2θ range of 10° to 90°). Initial phase analysis of the diffraction patterns performed by search/match from the International Centre for Diffraction Data (ICDD) database in the DIFRACT.SUITE EVA software (Bruker AXS, Germany). Match ICDD files: Orthorhombic Sr4Al14O25 (S4A7) PDF No. 74-1810, monoclinic SrAl4O7 (SA2) PDF No. 70-1479, hexagonal SrAl12O19 (SA6) PDF No. 70-0947, monoclinic SrAl2O4 (SA) PDF No. 74-0794, orthorhombic SrB2O4 (SB) PDF No. 84-2175 and orthorhombic Sr2B2Al2O8 (SAB) PDF No. 77-0402. The DiffracPlus TOPAS 4.2 software package (Bruker AXS, Karlsruhe, Germany)39 was used for the structural analysis by the X-ray Rietveld refinement method with the corresponding crystallographic information file (CIF) of the identified phases collected from the Inorganic Crystal Structure Database (ICSD; FIZ Karlsruhe 2019, version 4.2.0)40 and FindIT crystal database software. VESTA41 was used for viewing crystal structures—reference ones and refined data—, and DIFRACT.SUITE EVA (Bruker AXS, Germany) was used for determining the percent crystallinity.
Fourier transform infrared (FTIR) spectra were collected using a Nicolet IS10 FT-IR spectrometer (Thermo Scientific, USA) in ATR mode in the range of 4000 to 525 cm−1 with a resolution of 4 cm−1 at 128 scans. Spectral processing and analysis were performed using the program Omnic (Thermo Scientific) program42 and the software program Fityk® version 1.3.1 for spectral deconvolution.43
Micro-Raman analysis was performed on polished sintered ceramic pellets with using a Raman system (Renishaw inVia) mounted on a confocal microscope: 0.05 mW diode laser, λex = 532 nm, 1 s exposure, 1 cm−1 spectral resolution; 856 nm diameter focused laser spot at 50×; system calibrated to 520 nm−1 of Si. A representative dataset was ensured via measuring at 5 different locations. The manufacturer provided WiRE 3.4 software application was used for data acquisition and analysis by multivariate curve resolution-alternating least squares (MCR-ALS) method using Empty Modelling™. The baseline correction was performed with a 5th order polynomial, and spectral deconvolution analysis was performed using Fityk®.43
Results
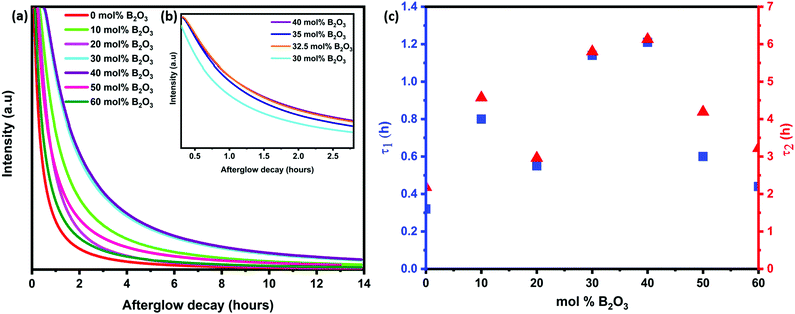
The afterglow decay lifetime of S4A7EDxB, where 0 ≤ x ≤ 60 mol% B2O3, was recorded for 14 hours under ambient conditions after being illuminated with a UV light source (λex = 365 nm) for 10 minutes, and the decay curves are summarized in Fig. 2a. All S4A7 powders exhibited persistent luminescence, regardless of the B2O3 content. The longest persistence luminescence was observed in x = 30 mol% B2O3 and 40 mol% B2O3 compounds. Fig. 2b shows the afterglow decay curves for S4A7EDxB (30 ≤ x ≤ 40 mol% B2O3). The two-slope behavior in the decay curves indicated 2 independent de-trapping mechanisms, corresponding to τ1 and τ2, respectively, which was obtained from the decay-curve fitting equation:α1 and α2 are constants, τ1 and τ2 are the decay lifetimes times, as shown in Fig. 2c. The two different lifetimes, τ1 and τ2, indicate the rapid and slow components of radiative relaxation. The S4A7EDxB compound with the x = 30 mol% B2O3 doped composition had τ1 = 1.14 h, τ2 = 5.8 h, while the x = 40 mol% B2O3 doped one showed τ1 = 1.21 h and τ2 = 6.13 h.
To determine the phase composition of S4A7EDxB, where 0 ≤ x ≤ 60 mol% B2O3, all samples were analyzed using XRD (Fig. 3). Calibration of the instrument was performed using a corundum standard. The evolution of the main (421) diffraction peak with the B2O3 content is shown in Fig. 3b, across the entire composition range studied, with an emphasis on peak shifts in the 20 ≤ x < 40 mol% B2O3 compositions in Fig. 3c. The main diffraction peaks corresponding to the crystallographic planes (421), (021), and (420) shifted from the reference positions with the addition of B2O3 for 0 < x < 40 mol%. In S4A7EDxB compounds with 20 ≤ x < 40 mol% B2O3, the (421) shifted toward a lower d-spacing (Fig. 3b and c).
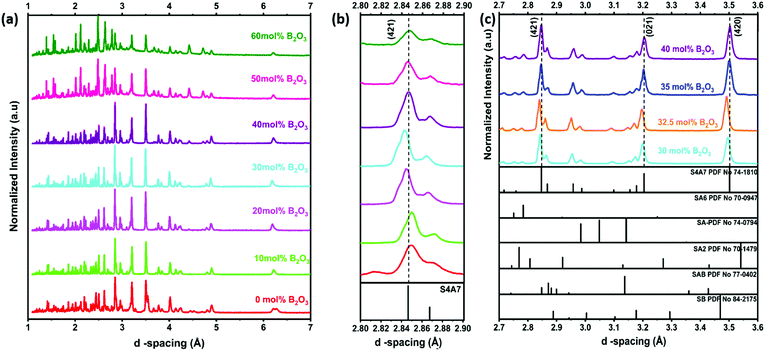 | ||
| Fig. 3 X-ray diffractograms of S4A7EDxB (0 ≤ x ≤ 60 mol% B2O3) (a) full range; (b) magnified around the (421) diffraction peak; and (c) diffractograms for S4A7EDxB (30 ≤ x ≤ 40 mol% B2O3). | ||
The presence of an amorphous phase was revealed by quantifying the relative amount of crystalline phase in Fig. 4a and Table S1 (ESI†). The results of Rietveld quantitative phase analysis are shown in Fig. 4b and Fig. S1 (ESI†) shows the results of the XRD patterns of S4A7EDxB samples (0 ≤ x ≤ 60 mol% B2O3), while Table S2 (ESI†) summarizes the results of quantitative analysis of XRD data. The sample prepared without B2O3 was 83.3% crystalline and was multi-phase, being dominated by the S4A7 phase (72.8%), along with SA2 (14.85%), SA6 (6.38%) and SA (5.9%) as the minor strontium aluminate phases. The maximum amount of phases exhibiting room temperature persistent luminescence, S4A7 and SA, was found in the 10 mol% B2O3 compound, which was of 93.3% S4A7 phase (and negligible SA content).
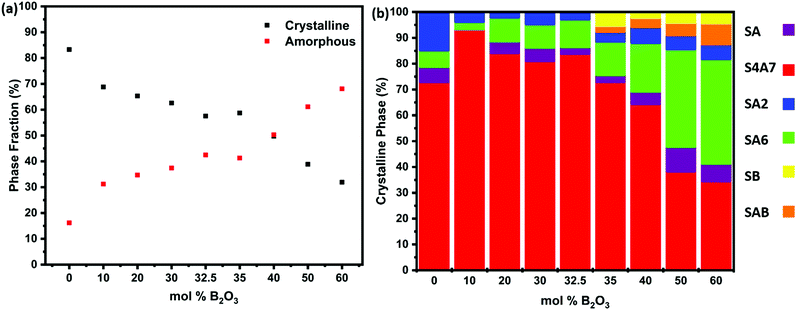 | ||
| Fig. 4 (a) Percent crystallinity and amorphous phase fraction determined from the XRD data of S4A7EDxB (0 ≤ x ≤ 60 mol% B2O3) samples; (b) phase distribution revealed by Rietveld phase analysis of the diffractograms shown in Fig. 3. | ||
S4A7EDxB for x = 30 mol% B consisted of 81.02% S4A7, 5.15% SA, 9.09% SA6 and 4.74% SA2 phases. A similar result was obtained for the compound prepared with 32.5 mol% B2O3. Increasing the B2O3 content to 35 mol% led to a significant drop in the S4A7 content, which decreased further upon increasing the B2O3 content, whereas the amount of SA6 phase increased. The diffractogram of S4A7EDxB for x = 40 mol% B showed additional peaks, indicating the presence of SrB2O4 (SB) and Sr2B2Al2O8 (SAB) phases along with S4A7, SA6, SA2 and SA phases. Further addition of B2O3 resulted in the dominance of SA6 over all other crystalline strontium aluminate phases. When S4A7EDxB was processed with 60 mol% B2O3, the amorphous content reached 68%. In the remaining crystalline material, SA6 dominated the multi-phase distribution, along with substantial amounts of SB and SAB phases.
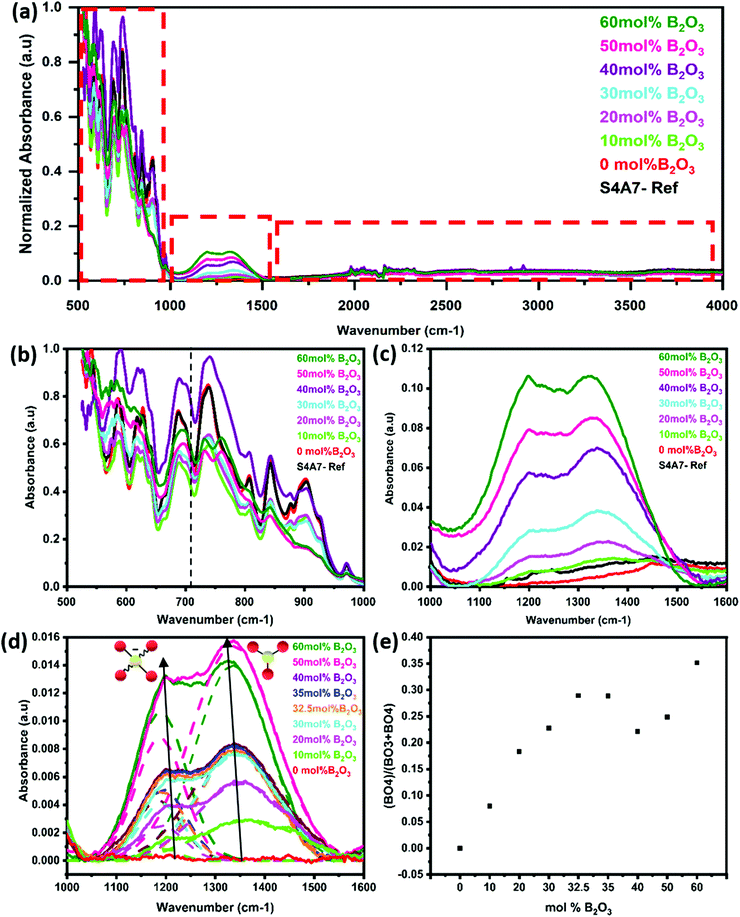
The FTIR spectra were analyzed to identify the structural changes in strontium aluminate compounds arising from the different amounts of B2O3. The FTIR spectra of S4A7EDxB, where 0 ≤ x ≤ 60 mol% B2O3, are shown for the region 500–4000 cm−1 in Fig. 5a. No peak was detected above 1500 cm−1. The region 500–1000 cm−1 showed vibrations related to the alumina scaffold of the S4A7 crystal structure in Fig. 5b. In this region, the characteristic vibrations of O–Al–O were observed in the phase-pure, undoped S4A7 reference spectra (Fig. S2a, ESI†).
Absorption bands were observed for Al–O features, both anti-symmetric stretching (700–1000 cm−1 region) and anti-symmetric bending (550–650 cm−1). When the B2O3 content exceeded 40 mol%, the intensity decreased for some vibrations in the 800–1000 cm−1 range (in the FTIR spectra); meanwhile, the increase in the shoulder indicating enhanced absorption at around 710 cm−1 suggested the bending vibrations of B–O–B linkages in the borate network. No absorption peak was detected in the 1000–1600 cm−1 range for the reference (undoped) and the x = 0 mol% B2O3 compounds. With the addition of B2O3, two distinct absorption profiles were observed in the range of 1180–1200 cm−1 and 1330–1370 cm−1, as shown in Fig. 5c. These two isolated bands became apparent when deconvoluted by assuming Gaussian profiles (Fig. 5d). The absorption band at 1180–1200 cm−1 corresponded to asymmetric B–O stretching vibrations of BO4 units and the absorption at 1330–1370 cm−1 was assigned to B–O stretching vibrations of BO3 groups.21,44,45 Using the integrated area beneath these 2 vibration peaks, we determined the relative change in N4 = (B4/(B3 + B4)) as a function of the B2O3 content (Fig. 5e).
The intensity of these bands increased in a linear manner with the B2O3 content, until reaching 30 mol% B2O3. Across the range 30 ≤ x ≤ 40 mol% B2O3, the N4 ratio reached a maximum value in the 32.5–35 mol% B2O3 compounds, and then declined in the 40 mol% B2O3 one.
When the B2O3 content exceeded 50 mol% B2O3, we observed a sharp increase in peak intensities, concurrent with the amorphous content.
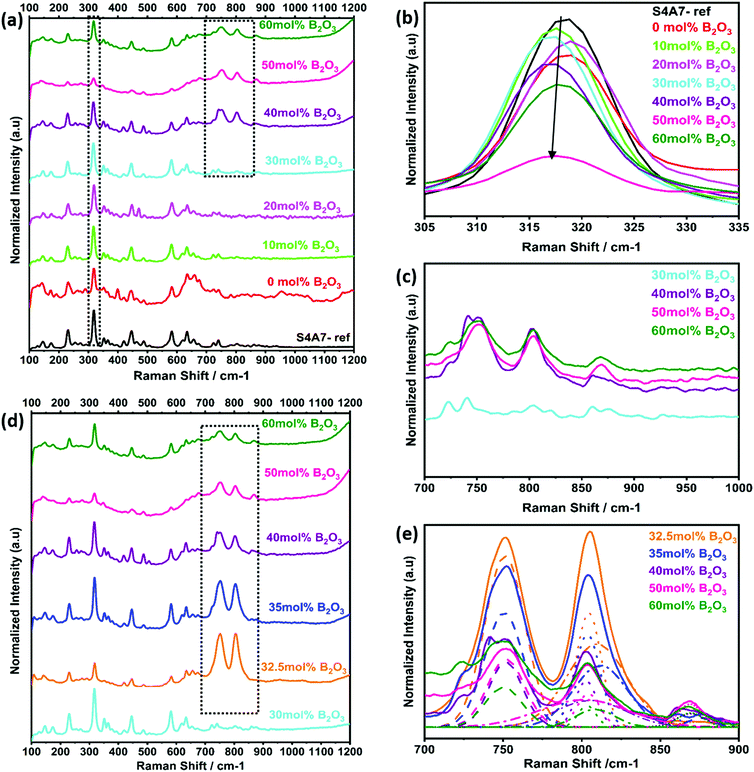
The changes in the vibrational modes of crystalline S4A7 caused by the incorporation of B2O3 into the crystal structure were also investigated by using Raman spectroscopy analysis. The phase-pure, orthorhombic S4A7 compound was characterized to serve as a reference fingerprint (Fig. S2b, ESI†). The Raman spectra of S4A7EDxB, where 0 ≤ x ≤ 60 mol% B2O3, are summarized in Fig. 6a. With an increase in B2O3, we observed a weakening in the intensity of the main 318 cm−1 peak, accompanying a shift toward shorter wavelengths (Fig. 6b). Furthermore, the appearance of additional peaks in the range of 700–900 cm−1 was observed in S4A7EDxB (30 ≤ x ≤ 60 mol% B2O3), which largely accounted for the boron-related structural groups (Fig. 6c). Fig. 6d shows the evolution in the Raman shift within 700–900 cm−1 for the S4A7EDxB compounds with 30 ≤ x ≤ 60 mol% B2O3, correlated with the deconvolution analysis of these peaks in Fig. 6e.
The BØ3 unit has a D3h symmetry point group symmetry and has  , in which R and IR represent Raman and infrared activity. These vibration modes are symmetric stretching
  , out-of-plane bending
  , asymmetric stretching ν3(E′), and in-plane bending ν4(E′) modes. The replacement of bridging oxygen (Ø) by a non-bridging one (O−) reduces the symmetry to C2V from D3h, while the doubly degenerate (E′) asymmetric stretching mode will split into two IR-active components of A1 and B2 symmetry.46–49
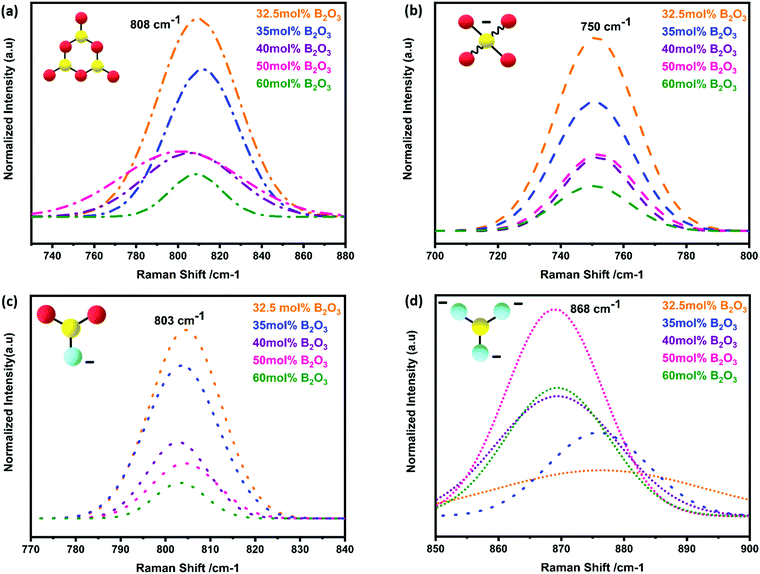
The strongest peak at 808 cm−1 was assigned to the symmetric breathing vibration of BØ3 boroxyl rings, reflecting the presence of vitreous B2O3 compounds (Fig. 7a).13,44 The second strongest peak at 750 cm−1 was assigned to the symmetric breathing vibration of 6-membered rings, containing one BØ3 triangle replaced by one BØ4 tetrahedron (Fig. 7b).18,44 The band at 803 cm−1 was assigned to metaborate BØ2O− units (Fig. 7c). Additional evidence of metaborate formation was provided by the weaker bands at around the 640 cm−1 symmetric stretch of B–O–B rings.17,50 With elevated B2O3 content, the formation of orthoborate monomers at 868 cm−1 was observed, reflecting the depolymerization of boroxyl rings and rings with BO4 tetrahedral units to orthoborate monomers (Fig. 7d).16,21 Both Raman and IR spectroscopic techniques were applied in a complementary way to reveal the formation and changes of complex boron units.
Raman mapping was performed on sintered polished pellets of S4A7EDxB compounds of x = 30 mol% B2O3 and 40 mol% B2O3. To analyze the hyperspectral Raman dataset, we applied a multivariate curve resolution-alternating least squares (MCR-ALS) method. The spectral data matrix was analyzed in the Wire 3.4 environment using the MCR-ALS module, in which the data matrix was decomposed into spectral profiles (“Loadings”) and concentration profiles (“Scores”).
In the x = 30 mol% B2O3 data set, three physically significant MCR-ALS components were observed; and a good correlation was obtained between the identified loadings of the reference spectra from pure S4A7, B2O3 powder, and epoxy. Fig. S3a (ESI†) shows the visible-light image of the region of interest for Raman spectral imaging for the x = 30 mol% B2O3 S4A7EDxB specimen. Fig. S3b (ESI†) shows the scan area at a higher magnification. The hyperspectral image of the first component is shown in Fig. S3c (ESI†), which is related to the S4A7 grains. Both overlay and color-coded (Fig. S3d, ESI†) images show the spatial distribution of S4A7 grains. The representative Raman spectrum from component 2, shown in green, is consistent with the reference Raman spectrum obtained from neat epoxy (Fig. S3e, ESI†). Since the pellet was necessarily embedded in an epoxy mold for polishing, the observation of epoxy at the surface was not surprising (Fig. S3f, ESI†). The last component appearing was attributed to B2O3, which is shown in blue (Fig. S3g, ESI†). Color-coded images formed by boron units revealed the distribution of boron units around the S4A7 grains (Fig. S3h, ESI†). In Fig. S3i (ESI†) the corresponding Raman spectra of the 3 components compared to the reference Raman spectra of pure S4A7, B2O3 and the epoxy are shown.
MCR-ALS analysis of Raman shift hyperspectral maps of x = 40 mol% B2O3 S4A7EDxB are shown in Fig. S4 (ESI†). There were four components, which were consistent with the reference spectra collected from phase pure S4A7, SA6, B2O3 powder, and the epoxy. The distribution of complex phases was color-coded in the MCR score—i.e., concentration profile—plot shown. The multi-phase region was selected for mapping to analyze the distribution of crystalline and amorphous components (Fig. S4a and b, ESI†). The first component originated from the epoxy, as was observed in the pellet of x = 30 mol% B2O3 (Fig. S4c and d, ESI†). The hyperspectral image that was color-coded red had correlated with large S4A7 grains (Fig. S4e and f, ESI†). The presence of small SA6 grains in the scan area resulted from the third component, which was colored green (Fig. S4g and h, ESI†) and was consistent with the reference spectrum of SA6. Component 4 reflected the presence of polyborate units and their spectral distributions across the mapped region (Fig. S4i and j, ESI†). This component appeared to be superposed with the characteristic vibrations of S4A7, which is due to the borate-rich glassy phase being adjacent to S4A7 grains. In Fig. S4k (ESI†) representative Raman spectra of the 4 components compared to the reference Raman spectra of B2O3, epoxy, pure S4A7, and pure SA6 are shown.
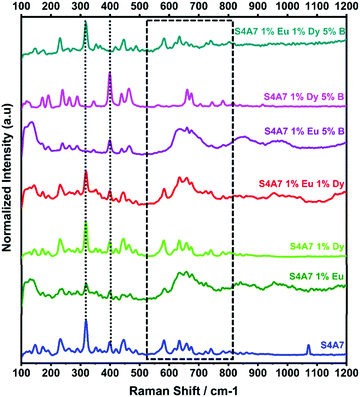
Fig. 8 shows the effect of individual rare earth dopants on the S4A7 unit cell. The S4A7 unit cell doped with only Eu exhibited distortion in the Raman shift spectrum especially in the region 550–850 cm−1, while doping with only Dy did not generate such a distortion. This observation can be attributed to the difference in size between Eu and Dy ions, the latter of which, being larger, is more prone to segregate out of the grain above the solubility limit;4 as a result, S4A7 doped only with Dy exhibited similar Raman spectra with the non-doped sample. The compound co-doped with Eu and Dy showed a spectrum with high intensity and narrow bands consistent with S4A7 doped only with Eu.
It should be noted that in S4A7 containing 1 at% Eu 5 mol% B2O3 and S4A7 1 at% Dy and 5 mol% B2O3, neither compound exhibited the vibration modes of S4A7. The Raman shift spectrum of S4A7 1 at% Eu and 5 mol% B2O3 had wider and weaker Raman bands and was missing the shift at 318 cm−1. Meanwhile, the spectrum of S4A7 1 at% Dy and 5 mol% B2O3 had Raman bands similar to those of SA2. The changes induced in the Raman spectra suggest that the presence of boron affects the atomic arrangements in each compound differently, which may also differentiate their incorporation into the Sr sub-lattice sites in the unit cell. Finally, the Raman spectra of S4A7EDxB with x = 5 mol% B2O3 contained known vibrational modes that were observed in other S4A7EDxB compounds, the ones containing S4A7 as a major phase.
Discussion
The optimal B2O3 composition for the Pechini-processed S4A7EDxB compound was determined to lie in the range 30 mol% B2O3 ≤ x ≤ 40 mol% B2O3. De-trapping from both shallow-trap and deep-trap states, as extrapolated from the afterglow decay curves, was of the longest duration within this range of boron content and correlated with persistent luminescence of the longest duration. The introduction of B2O3 into the S4A7 unit cell appears to be associated with increasing the depth of both types of trap centers, leading to a slower decay rate than that observed in other B2O3-doped compositions.The variation in strontium aluminate phase distribution was observed with the addition of boron oxide in samples prepared with identical synthesis and heat treatment conditions (Fig. 4b). We focused our analysis on the atomic positions in the target persistent luminescence phase, S4A7EDxB, where 0 ≤ x ≤ 60 mol% B2O3, by performing Rietveld structural refinement analysis on the XRD data. As shown in Fig. 9, the refined unit-cell parameters revealed the most significant shrinkage in the S4A7 crystal lattice dimensions (a, b, c, and volume) starting from 30 mol% B2O3 and extending to 40 mol% B2O3 (Table S3, ESI†). These parameters were compared against those of the pure S4A7 reference. The reason for this apparent change in the unit cell parameters appears to be induced by the presence of borate structures in the lattice.
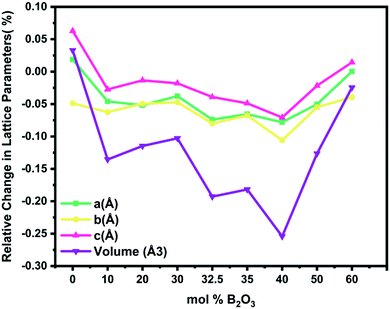 | ||
| Fig. 9 Changes in the unit cell dimensions of S4A7 with an increase in the B2O3 content during Pechini processing. | ||
The effect of B2O3 incorporation on the crystalline S4A7 unit cell was visualized with the help of Vesta, using the atomic positions determined by Rietveld refinement analysis (Fig. S5, ESI†). The S4A7 unit cell contains 6 different crystallographically non-equivalent Al sites, and these Al sites are coordinated with 4 or 6 oxygen atoms. The Al1, Al2 and Al3 form AlO4 tetrahedra, while Al4, Al5 and Al6 form AlO6 octahedra. The interconnected network of these alumina polyhedra forms a rigid 3-D scaffold, with large cavities filled by Sr cations, providing electrical charge balance. There are two nonequivalent Sr sites: Sr1 coordinated by 10 oxygens (Wyckoff 4j) and Sr2 coordinated by 7 oxygens (Wyckoff 4i) (Fig. 1).
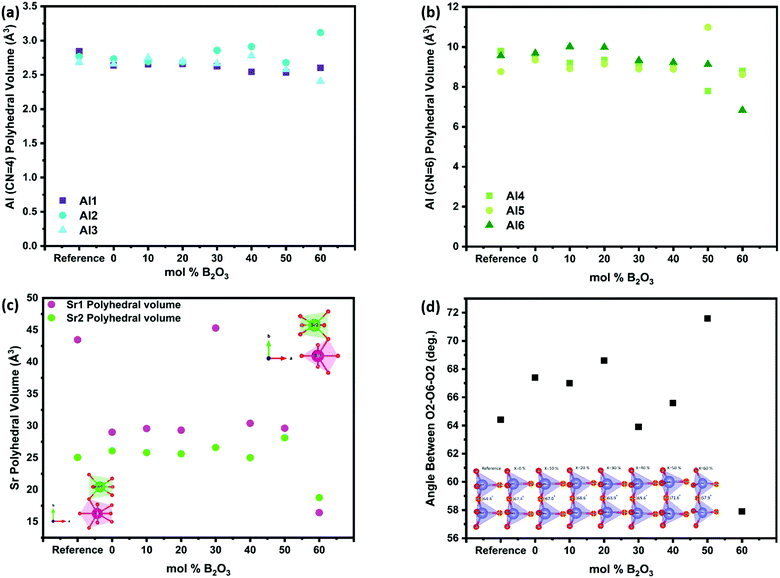
The change in the polyhedral volume of each of the AlO4 tetrahedra is shown in Fig. 10a. Within the compositional range S4A7EDxB x = 30–40 mol% B2O3 the volume of the sites Al2 and Al3 increased, while that of Al1 did not change significantly (Fig. S6, ESI†). With the further addition of up to 60 mol% B2O3, the Al2 polyhedral volume increased by ca. 12.6%. Boron appeared not to have caused a significant change in the octahedral AlO6 chains in the x = 30–40 mol% B2O3 range, when compared to the reference sample (Fig. 10b). The overall decrease in the AlO6 polyhedra correlated with an increase in the B2O3 content (Fig. S7, ESI†).
The incorporation of Eu into Sr sites has already been demonstrated earlier by our group using AR-STEM imaging.25 In this work, the results of our analyses revealed that both types of Sr sites investigated in compounds containing 30–40 mol% B2O3 showed localized expansion of their volume, particularly in the Sr1 polyhedral volume (Fig. 10c and Table S4, ESI†). Sr1 (CN = 10) has lower covalency compared to Sr2 (CN = 7). This expansion would have altered the crystal field coordination environment around the Eu2+ ions, resulting in changes to the electronic structure of Eu2+ that control the persistent luminescence.
With Sr1 located in the large interstitial cavities of the alumina scaffold, any expansion of their polyhedral volume would deform the scaffold structure (Fig. 10d) (Table S5, ESI†). The angle between the neighboring Al2 tetrahedra within the x = 30–40 mol% B2O3 compositional range showed values closest to the undoped reference spectra. In addition, the expansion in Sr sites pushed the 4-coordinated alumina polyhedra towards each other. This observation may explain the decreased d421-spacing between the main (421) planes within the compositional range of 30 ≤ x ≤ 40 mol% B2O3.
Our material system had crystallized directly from an amorphous precursor, the one in which multiply connected and isolated borate units were present throughout the microstructural evolution. Mid-infrared transmission and micro-Raman spectra revealed that S4A7EDxB (0 ≤ x ≤ 60 mol% B2O3) compositions contained polyborate supramolecular arrangements like neutral trigonal BØ3 units, charged BØ4− tetrahedra, metaborate BØ2O−, and orthoborate (BO3)3−. The red-shift in the 1000–1600 cm−1 absorption band envelope has been reported for other highly modified borate glasses.17,18 For the compositions of S4A7EDxB with 10 ≤ x ≤ 40 mol% B2O3, the progressive red-shift of the 1342–1370 cm−1 peak frequency was attributed to the formation of metaborate triangles BØ2O− that were manifested by the deconvoluted Gaussian BO3 component. Changes in the number of B–O− and B–Ø bonds undergoing stretching vibrations in BØ2O− and BØ3 units resulted in the red-shift and asymmetry of these bands.18,49 In particular, the red-shift suggests stronger interactions between the non-bridging oxygens and other cations—Sr2+, Al3+, Eu2+, and Dy3+—that consequently result in weaker B–O− bonding.49
For the S4A7EDxB compositions of 40 ≤ x ≤ 60 mol% B2O3, these trends continued in the 1335–1342 cm−1 spectral shift range, which was attributed to the progressive depolymerization in the borate network in superstructural units transforming into metaborate (BØ2O)− and then into orthoborate (BO3)3− monomers. The peak at around 710 cm−1 indicated an out-of-plane bending mode of borate (BO3)3− triangular units. It should be noted that this mode was only present in compositions of x > 40 mol% B2O3, indicating that orthoborate units of (BO3)3− were present significantly in these compositions. In addition, the absorption bands at around 800–1000 cm−1 had weakened, which was indicative of vibration modes dampened by the presence of other cations in the structure. The absorption peak component related to BO4 units (1189–1198 cm−1) did not show a pronounced overall red-shift compared to that of BO3 (1335–1370 cm−1).
The Raman spectra had also showed the characteristic vibrations of boron units, but additionally revealed deeper insight into the polyborate suprastructures. At shift frequencies < 750 cm−1, there were strong lattice vibrations from the different phases of strontium aluminate, which generally obscured the ν4 in-plane bending mode of orthoborate units that appears at around 625 cm−1. When S4A7EDxB contained 30–40 mol% B2O3, the simultaneous occurrence of bands at around 808 cm−1, 750 cm−1, and 803 cm−1 in the Raman spectra suggested the presence of polymeric polyborate groups in the orthorhombic S4A7 crystal structure. Deconvolution analysis of the 700–900 cm−1 band revealed not only the presence of planar BØ3 rings (808 cm−1 band), but also the symmetric breathing vibration of the six-membered ring one replaced by BØ4− (750 cm−1 band). The presence of such rings suggests an interconnected network of borate units in the 32.5 mol% B2O3 and 35 mol% B2O3 compounds. These spectral changes are consistent with the transformation of BØ3 units into BØ4− tetrahedra, as revealed by FTIR spectra (Fig. 5d and e). The maximum N4 value was attained by processing S4A7EDxB with 32.5–35 mol% B2O3, which indicated the conversion of boroxyl rings to BØ4− tetrahedra groups in compounds of this composition range.
Furthermore, the co-existence of metaborate suprastructural units—resonance at 803 cm−1 and 640 cm−1—with BØ4− ones, suggests equilibrium between the isomeric trigonal 2BØ2O− and charged tetrahedral units within S4A7EDxB (30 ≤ x ≤ 40 mol% B2O3):
| 2(BØ4) − ↔ 2BØ2O− |
As the B2O3 concentration was increased, the borate backbone became further de-polymerized. The number of non-bridging oxygen ions increased with the formation of orthoborate units, as revealed by the Raman peak at 868 cm−1. De-polymerization resulted in the break-up of the B–O–B linkages and an increase in the free volume within the scaffold of coordination polyhedra.
In S4A7EDxB compounds of >40 mol% B2O3, the intensity decreased for the bands at 808 cm−1, 803 cm−1 and 750 cm−1, while the intensity of that at 868 cm−1 (ortho) increased. Such a spectral evolution indicates that the number of bridging oxygen per boron decreased, resulting in a dampening and red-shift of the vibration of B–Ø bonds in the BØ3, BØ2O−, and BØ4− units. The frequency of the B–O− stretching in orthoborate triangles BO33− was observed to increase with an increase in the non-bridging oxygen content. Meanwhile, the lower intensity and red-shift of the main vibration at 318 cm−1 and the distortion in phonon vibrations in the Raman spectra indicated that the covalent nature of Al–O bonding was affected by an increase in non-bridging oxygen.
In compositions with the B2O3 content in excess of that with the longest persistent luminescence duration (30–40 mol% B2O3), the electron density of the boron ions had increased as a consequence of depolymerization of the boroxyl network, which increased the non-bridging oxygen content. As a consequence, the change in the proportion of different borate units perturbed localized electrical charge distribution within the crystal unit cell, which would in turn modify the luminescence duration. Because the compounds of optimal luminescence contained connected planar triangular units and tetrahedral units, along with metaborate units, these results suggest that the formation of polymerized borate groups from BO3 triangles and BO4 tetrahedra contributes to the persistence behavior by stabilizing the Eu3+ and Dy2+ in the S4A7 unit cell. The coordination environment around the Eu and Dy ions, i.e. the crystal field around them, was affected by changes in the polyborate supramolecular structures. After all, the B–O network is known to act as an electron trapping center, which may serve as additional trap centers.51
The fraction and arrangement of polyborate groups depend not only on the concentration of B incorporated into the crystal structure but also the type of modifier cation, which will affect the structure and optical properties of the overall network. Sr plays a dual role as a network modifier and electrical charge compensator as a function of the SrO![[thin space (1/6-em)]](https://www.rsc.org/images/entities/char_2009.gif) :
:![[thin space (1/6-em)]](https://www.rsc.org/images/entities/char_2009.gif) Al2O3 ratio.52 There was a competition between Al and B as network formers for bonding with the oxygen ions, which also contributed to different numbers of bridging oxygens. When there was a coexistence of aluminum and boron oxides, the resulting glass was characterized predominantly by the formation of AlO4 tetrahedra.20 In a low glass and crystalline system rich in Al3+ modifier, AlO6 formed for charge compensation.19
Al2O3 ratio.52 There was a competition between Al and B as network formers for bonding with the oxygen ions, which also contributed to different numbers of bridging oxygens. When there was a coexistence of aluminum and boron oxides, the resulting glass was characterized predominantly by the formation of AlO4 tetrahedra.20 In a low glass and crystalline system rich in Al3+ modifier, AlO6 formed for charge compensation.19
The amount of B2O3 used determined the way B interacts with the ions in the amorphous pre-ceramic, and consequently the evolution in the crystal structure. Evaluation of the crystal structure of S4A7 revealed that boron incorporation had altered the lattice parameters, to a degree correlated with the amount of B2O3 used during synthesis. The integrity of the unit cell was maintained within the S4A7EDxB composition optimal for extreme persistent luminescence—30 ≤ x ≤40% mol B2O3—although some cation coordination polyhedra underwent deformation, particularly the Sr1 polyhedra and the AlO4 tetrahedra: Al1, Al2, and Al3.
For 30 ≤ x ≤ 40 mol% B2O3, there was increased free volume around Sr2+ and BØ2O− structures present in the crystal structure, suggesting that the polyhedral scaffold changes around Sr2+ may be attributed to the BØ2O− inducing AlOx polyhedral rotation. The longest afterglow microstructure existed in this composition range, in which there was a transition in the interaction between BO3 units and the alumina polyhedra in the aluminoborate melt. Three-fold boron coordinated with oxygen from alumina polyhedra and the conversion from three- to four-coordinated boron induced a volume change in the alumina polyhedra. It appears that the boron structural anomaly in this composition range was related to the alumina polyhedral rotation.
For x > 40 mol% B2O3, the BO3/BO4 ratio defined the network character. Strontium metaborate (SrB2O4) precipitated, with Sr2+ providing charge compensation for the excess non-bridging oxygen. Because Sr2+ was occupied in SrB2O4, the stoichiometry of Sr:Al in the melt changed. The Al-rich regions precipitated as SA6, consistent with the increased SA6 content revealed by Rietveld phase fraction analysis.
To summarize, the results presented in this work show a strong correlation between the duration of persistent luminescence in S4A7EDxB (Fig. 2) with the B2O3 content during Pechini processing and with the metaborate content (Fig. 5 through 7) appearing in the crystal structure of Sr4Al14O25. Our analysis of these results reveals new details in the state-of-the-art structural model of long afterglow S4A7EDxB, suggesting that metaborate induces the clustering of optically active ionic point defects, which support persistent luminescence.
Conclusions
The longest persistent luminescence in S4A7EDxB compounds synthesized by Pechini processing was observed in compounds prepared with 30–40 mol% B2O3. Micro-Raman analysis of S4A7EDxB grains revealed the presence of borate supramolecular structures in their orthorhombic Sr4Al14O25 crystal structure as BØ3, BØ2O−, and BØ4− units, with an equilibrium between BØ2O− and BØ4− units. BØ4− units replaced BØ3 ones in the network of polymerized BØ3/BØ2O− groups and induced deformation in the scaffold of interconnected AlO4 polyhedra that led to increased Sr2+ site volume. These results suggest that the enlarged Sr sub-lattice sites neighboring the negatively charged non-bridging oxygen accommodate Eu and Dy dopant incorporation, giving rise to clustering of ionic point defects that support persistent luminescence.Author contributions
A. C. E.: investigation, methodology, visualization, writing—original draft; S. K.: investigation and methodology; E. D. investigation; C. O.: conceptualization, funding acquisition, resources, methodology, writing—review & editing.Conflicts of interest
There are no conflicts to declare.Acknowledgements
The authors acknowledge fruitful discussions with Richard Bormett, Zeki Semih Pehlivan for his assistance with the afterglow decay measurements, and Ahmet Alper Özkan for developing a visualization app for Raman spectral mapping. Sabanci University is acknowledged for funding from the Internal Research Grant #I.A.CF-18-01887.References
- I. C. Chen and T. M. Chen, J. Mater. Res., 2001, 16, 644–651 CrossRef CAS.
- A. Nag and T. R. N. Kutty, J. Alloys Compd., 2003, 354, 221–231 CrossRef CAS.
- G. Inan Akmehmet, S. Šturm, L. Bocher, M. Kociak, B. Ambrožič and C. W. Ow-Yang, J. Am. Ceram. Soc., 2016, 99, 2175–2180 CrossRef CAS.
- S. Khabbaz Abkenar, A. Kocjan, Z. Samardžija, M. Fanetti, A. Coşgun Ergene, S. Šturm, M. Sezen and C. W. Ow-Yang, J. Eur. Ceram. Soc., 2020, 40, 4129–4139 CrossRef CAS.
- A. Nag and T. R. N. Kutty, Mater. Res. Bull., 2004, 39, 331–342 CrossRef CAS.
- C. K. Chang, L. Jiang, D. L. Mao and C. L. Feng, Ceram. Int., 2004, 30, 285–290 CrossRef CAS.
- J. Bierwagen, T. Delgado, G. Jiranek, S. Yoon, N. Gartmann, B. Walfort, M. Pollnau and H. Hagemann, J. Lumin., 2020, 222, 117113 CrossRef CAS.
- S. Wang, Z. Song, Y. Kong, S. Zhang, Z. Xia and Q. Liu, J. Lumin., 2018, 204, 36–40 CrossRef CAS.
- D. Zhou, Z. Wang, Z. Song, F. Wang, S. Zhang and Q. Liu, Inorg. Chem., 2019, 58, 1684–1689 CrossRef CAS PubMed.
- F. Clabau, X. Rocquefelte, S. Jobic, P. Deniard, M. H. Whangbo, A. Garcia and T. Le Mercier, Chem. Mater., 2005, 17, 3904–3912 CrossRef CAS.
- N. Thompson, P. Murugaraj, C. Rix and D. E. Mainwaring, J. Alloys Compd., 2012, 537, 147–153 CrossRef CAS.
- J. E. Shelby, Introduction to Glass Science and Technology, Royal Society of Chemistry, 1997, 2nd edn, 2007 Search PubMed.
- A. C. Wright, Int. J. Appl. Glass Sci., 2015, 6, 45–63 CrossRef.
- H. Scholze, Glass: nature, structure, and properties, Springer, New York, 1st edn, 1992 Search PubMed.
- Y.-M. Chiang, D. P. Birnie and W. D. Kingery, Physical Ceramics: Principles for Ceramic Science and Engineering, Wiley, 1996 Search PubMed.
- B. N. Meera and J. Ramakrishna, J. Non-Cryst. Solids, 1993, 159, 1–21 CrossRef CAS.
- D. Möncke, E. I. Kamitsos, D. Palles, R. Limbach, A. Winterstein-Beckmann, T. Honma, Z. Yao, T. Rouxel and L. Wondraczek, J. Chem. Phys., 2016, 145, 124501 CrossRef PubMed.
- A. Winterstein-Beckmann, D. Möncke, D. Palles, E. I. Kamitsos and L. Wondraczek, J. Phys. Chem. B, 2015, 119, 3259–3272 CrossRef CAS PubMed.
- B. C. Bunker, R. J. Kirkpatrick, R. K. Brow, G. L. Turner and C. Nelson, J. Am. Ceram. Soc., 1991, 74, 1430–1438 CrossRef CAS.
- A. A. Osipov, V. E. Eremyashev, A. S. Mazur, P. M. Tolstoi and L. M. Osipova, Glass Phys. Chem., 2016, 42, 230–237 CrossRef CAS.
- Y. D. Yiannopoulos, G. D. Chryssikos and E. I. Kamitsos, Phys. Chem. Glasses, 2001, 42, 164–172 CAS.
- M. S. Bødker, R. Christensen, L. G. Sørensen, M. B. Østergaard, R. E. Youngman, J. C. Mauro and M. M. Smedskjaer, J. Non-Cryst. Solids, 2020, 544, 120099 CrossRef.
- J. D. Musgraves, J. Hu and L. Calvez, Handbook of Glass, Springer International Publishing, Switzerland, 2019 Search PubMed.
- M. R. Ahmed and M. Shareefuddin, SN Appl. Sci., 2019, 1, 1–10 Search PubMed.
- G. Inan Akmehmet, S. Šturm, M. Komelj, Z. Samardžija, B. Ambrožič, M. Sezen, M. Čeh and C. W. Ow-Yang, Ceram. Int., 2019, 1–5 Search PubMed.
- G. Inan Akmehmet, PhD thesis, Sabancı University, 2015.
- P. Escribano, M. Marchal, M. Luisa Sanjuán, P. Alonso-Gutiérrez, B. Julián and E. Cordoncillo, J. Solid State Chem., 2005, 178, 1978–1987 CrossRef CAS.
- A. Dias and R. L. Moreira, J. Raman Spectrosc., 2018, 49, 1514–1521 CrossRef CAS.
- R. E. Rojas-Hernandez, F. Rubio-Marcos, R. H. Gonçalves, M. Á. Rodriguez, E. Véron, M. Allix, C. Bessada and J. F. Fernandez, Inorg. Chem., 2015, 54, 9896–9907 CrossRef CAS PubMed.
- D. Tuschel, Spectroscopy, 2017, 32, 13–19 Search PubMed.
- T. Schmid, N. Schäfer, S. Levcenko, T. Rissom and D. Abou-Ras, Sci. Rep., 2015, 5, 1–7 Search PubMed.
- J. Partyka and M. Leśniak, Spectrochim. Acta, Part A, 2016, 152, 82–91 CrossRef CAS PubMed.
- A. M. Efimov, J. Non-Cryst. Solids, 1999, 253, 95–118 CrossRef CAS.
- G. Hu, Y. Zhou, R. Liu, C. Li, L. Liu, H. Lin, F. Zeng and Z. Su, Opt. Mater., 2020, 106, 110025 CrossRef CAS.
- Q. Jiao, X. Yu, X. Xu, D. Zhou and J. Qiu, J. Solid State Chem., 2013, 202, 65–69 CrossRef CAS.
- C. Gautam, A. K. Yadav and A. K. Singh, ISRN Ceram., 2012, 2012, 1–17 CrossRef.
- A. V. Redkov, A. A. Lipovskii, D. K. Tagantsev and B. Groth, J. Am. Ceram. Soc., 2016, 99, 2558–2560 CrossRef CAS.
- R. Keiner, T. Frosch, S. Hanf, A. Rusznyak, D. M. Akob, K. Küsel and J. Popp, Anal. Chem., 2013, 85, 8708–8714 CrossRef CAS PubMed.
- Bruker-AXS, DIFFRACPlus TOPAS: TOPAS 4.2 Technical Reference, 2008.
- Inorganic Crystal Structure Database, https://www.fiz-karlsruhe.de/de/produkte-und-dienstleistungen/inorganic-crystal-structure-database-icsd.html, [FIZ Karlsruhe: Karlsruhe, Germany, 2019].
- K. Momma and F. Izumi, J. Appl. Crystallogr., 2011, 44, 1272–1276 CrossRef CAS.
- R. J. Meier, Vib. Spectrosc., 2005, 39, 266–269 CrossRef CAS.
- M. Wojdyr, J. Appl. Crystallogr., 2010, 43, 1126–1128 CrossRef CAS.
- E. I. Kamitsos and G. D. Chryssikos, J. Mol. Struct., 1991, 247, 1–16 CrossRef CAS.
- S. Zhang, R. Pang, D. Li, J. Fu, Y. Jia, H. Li, W. Sun, L. Jiang and C. Li, Dalton Trans., 2015, 44, 17916–17919 RSC.
- T. W. Bril, PhD thesis, Technische Hogeschool Eindhoven, 1976.
- G. Simon, B. Hehlen, R. Vacher and E. Courtens, Phys. Rev. B: Condens. Matter Mater. Phys., 2007, 76, 1–12 Search PubMed.
- C. P. Varsamis, E. I. Kamitsos and G. D. Chryssikos, Phys. Rev. B: Condens. Matter Mater. Phys., 1999, 60, 3885–3898 CrossRef CAS.
- C. P. E. Varsamis, N. Makris, C. Valvi and E. I. Kamitsos, Phys. Chem. Chem. Phys., 2021, 23, 10006–10020 RSC.
- Y. K. Voronko, A. A. Sobol and V. E. Shukshin, Inorg. Mater., 2012, 48, 732–737 CrossRef CAS.
- J. Qiu and K. Hirao, Solid State Commun., 1998, 106, 795–798 CrossRef CAS.
- R. El Hayek, F. Ferey, P. Florian, A. Pisch and D. R. Neuville, Chem. Geol., 2017, 461, 75–81 CrossRef CAS.
Footnote |
| † Electronic supplementary information (ESI) available: Phase compositions, crystallographic parameters, cation coordination polyhedral data, FTIR and Raman reference spectra, MCR-ALS analysis outputs of Raman data, and visualization of crystal structure changes. See DOI: 10.1039/d1ma01234g |
| This journal is © The Royal Society of Chemistry 2022 |

