 Open Access Article
Preparation of highly crosslinked polyvinylpyrrolidone–polydivinylbenzene adsorbents based on reinitiation of suspended double bonds to achieve excellent blood compatibility and bilirubin removal
Zuojin
Kou
 and
Chunhong
Wang
*
Key Laboratory of Functional Polymer, Ministry of Education, Institute of Polymer Chemistry, Nankai Univesity, Tianjin 300071, China
First published on 11th April 2022
Abstract
Excess bilirubin in the body will lead to a series of damage to tissues and organs. At present, hemoperfusion is used to remove excess bilirubin. However, commercial adsorbents have the disadvantages of low adsorption capacity and poor blood compatibility. The adsorbents reported in the existing literature have the disadvantages of small particle size, rough surface, low strength and complex synthesis. Based on the structural characteristics of bilirubin, we introduced hydrophilic polyvinylpyrrolidone (PVP) chain segments into hydrophobic polydivinylbenzene (PDVB) frameworks by reinitiation of suspended double bonds. A class of adsorbents (DP adsorbents) with a large particle size, smooth surface, uniform distribution of functional groups, highly crosslinked structure and high specific surface area were synthesized. Bilirubin is adsorbed by a DP adsorbent through hydrophobic–hydrogen bond synergy. The adsorption properties of the DP adsorbent with different skeleton structures for bilirubin and anti-nonspecific protein adsorption were investigated, and the best adsorbent DP-4 was selected. Compared with commercial adsorbent BL-300, the free bilirubin adsorption performance of DP-4 was 3.6 times that of BL-300, and the bilirubin adsorption performance of DP-4 in the presence of albumin was 4.4 times that of BL-300. The results of protein adsorption, the blood coagulation experiment, platelet adhesion, hematological evaluation and the hemolysis test showed that DP-4 had good blood compatibility without any treatment.
1. Introduction
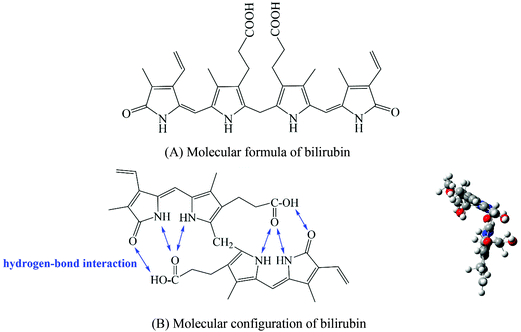
Bilirubin (Fig. 1A) is a metabolite of heme produced in aging red blood cells in the human body and can act as an effective antioxidant at physiological concentrations in the human body.1 However, when excess bilirubin is produced or the uptake, transformation or excretion of bilirubin by liver cells is blocked, hyperbilirubinemia occurs, resulting in a series of damage to tissues and organs.2 The main treatment methods for hyperbilirubinemia are liver transplantation,3 hemodialysis,4 and hemoperfusion,5 the cost of liver transplantation is high, and hemodialysis cannot effectively remove medium-size and macromolecular blood toxins. Hemoperfusion is simple and effective, with low toxicity and few side effects, and is widely used in the treatment of hyperbilirubinemia.6 Hemoperfusion is based on the principle of adsorption separation, in which blood or plasma enters a device containing adsorbents and toxins are removed by the adsorbents.7 The key to a hemoperfusion method is to prepare adsorption materials with excellent blood compatibility, high adsorption capacity and high selectivity.In the existing literature, the adsorbents used for bilirubin removal are mainly divided into activated carbon,8 chitosan composites,9,10 molecular imprinting materials,11–13 graphene composites,14 MOF composites15 and resins. As a hemoperfusion adsorbent, human blood should be able to pass through quickly in practical applications, and the adsorbent should have a certain strength, and there is no risk of material falling off. Therefore, the hemoperfusion adsorbent used to remove bilirubin is generally a spherical material with good strength, spherical appearance and large particle size. And these conditions directly limit the ability of the above materials other than resins for use in practical applications, so resins have an absolute advantage in the current market of hemoperfusion adsorbents for removing bilirubin. According to the adsorption mechanism, resins can be divided into ion exchange resins and adsorption resins.16,17 Ion exchange resins rely on electrostatic interaction to adsorb bilirubin. In the actual perfusion process, some anticoagulant ions will be adsorbed, leading to coagulation,18 and the ion balance of blood will be seriously disturbed.19 Adsorption resins depend on the hydrophobic effect to adsorb bilirubin. During the actual perfusion process, a large amount of protein was adsorbed, resulting in poor blood compatibility.20,21 The currently widely used hemoperfusion resins have poor blood compatibility and require a series of treatments before whole blood perfusion. Therefore, it is of great significance to prepare a non-ionic adsorbent with high adsorption capacity for bilirubin, good blood compatibility and practical application ability for the treatment of hyperbilirubinemia.
Due to the formation of intramolecular hydrogen bonds, bilirubin exhibits a ridge-tile conformation (Fig. 1B) and shows high hydrophobicity in a physiological environment.22 Therefore, in order to ensure the adsorption capacity of the bilirubin adsorbent, a hydrophobic PDVB framework is a necessary choice. However, only hydrophobic adsorbents have poor blood compatibility, so we need to improve the blood compatibility of adsorbents. In the existing literature, the methods to improve the blood compatibility of the adsorbent can be divided into coating,23,24 grafting of bioactive substances,25,26 and hydrophilic modification of the material surface.27,28 Coating refers to coating a layer of hydrophilic material on the surface of the adsorbent, which will result in a higher cost of the adsorbent and lower adsorption capacity of bilirubin. Grafting of bioactive substances means that an anticoagulant such as heparin is immobilized on the adsorbent by some means. This method is suitable for ionic adsorbents, and not suitable for non-ionic adsorption resins. Hydrophilic modification of the material surface refers to introducing some specific hydrophilic chain segments into the adsorbent through some methods. The increase of hydrophilicity will also lead to a decrease in the adsorption capacity of bilirubin. According to Fig. 1, the existence of carboxyl groups on bilirubin suggests that we can introduce a chain segment that can not only improve the hydrophilicity of the material, but also interact with the carboxyl groups, so as to solve the problem of decreasing the adsorption capacity of the adsorbent for bilirubin caused by decreased hydrophobicity.
Polyvinylpyrrolidone (PVP) is a kind of non-ionic hydrophilic polymer compound with excellent biocompatibility.29 Moreover, PVP can form hydrogen bonds with carboxyl groups on bilirubin. A kind of non-ionic adsorbent with high adsorption capacity for bilirubin and good blood compatibility can be synthesized by introducing PVP into the hydrophobic PDVB framework. In order to ensure that the PDVB framework and PVP chain segment can play a good hydrophobic–hydrogen bond synergistic effect, the adsorbent should have a uniform distribution of functional groups. In order to ensure the adsorption capacity of bilirubin, the adsorbent should have a high specific surface area and functional group content. In the existing literature, according to the reaction mechanism, the methods of introducing hydrophilic PVP chain segments into the hydrophobic PDVB framework can be divided into swelling polymerization,30 copolymerization31,32 and surface grafting,33–35 which respectively result in poor skeleton stability, uneven distribution of functional groups and low specific surface areas. Therefore, the challenge of this paper is how to introduce a large number of hydrophilic PVP chain segments into the hydrophobic PDVB framework, while ensuring that the adsorbent has characteristics such as uniform functional group distribution, high specific surface area and highly crosslinked structure.
When styrene and divinylbenzene are copolymerized and the content of divinylbenzene exceeds 40%, the resulting polymer will leave some randomly distributed double bonds that can be reinitiated, called suspended double bonds.36,37 Based on this, we first synthesized the PDVB matrix with a large number of suspended double bonds, and then reinitiated the uniformly distributed suspended double bonds in the state of sufficient swelling of the matrix, thus introducing PVP chain segments into the matrix. At the same time, the reaction conditions are controlled so that PVP chain segments exist in the matrix in the form of crosslinked bridges. A class of adsorbents with a hydrophobic–hydrophilic framework, uniform distribution of functional groups, high specific surface area and highly crosslinked structure were synthesized. The bilirubin removal capacity and anti-nonspecific protein adsorption capacity of adsorbents with different skeleton structures were investigated, and the best adsorbents were selected. The bilirubin adsorption performance of the best adsorbent was compared with that of the commercial adsorbent, and the blood compatibility of the best adsorbent was investigated.
2. Experimental
2.1. Materials and reagents
Divinylbenzene (DVB, purity of 80%), polyvinyl alcohol (PVA), dibenzoyl peroxide (BPO, recrystallized) and azodiisobutyronitrile (AIBN, recrystallized) were received from Sunresin New Materials Co., Ltd (Shanxi, China). Toluene (AR), N,N-dimethylformamide (DMF, AR), liquid paraffin (AR) and vinyl pyrrolidone (NVP, purity of 99%) were purchased from Meryer Chemical Technology Co., Ltd (Shanghai, China). Bilirubin (purity of 98%) was purchased from Meryer Chemical Technology Co., Ltd (Shanghai, China). Bovine serum albumin (BSA, BR), human serum albumin (HSA, BR), and human fibrinogen (Fg, BR) were purchased from Yuanye Bio-Technology Co., Ltd (Shanghai, China). Phosphate buffer solution is prepared in the laboratory. Anion exchange resin BL-300 was purchased from Kuraray Co., Ltd (Osaka, Japan). The plasma used in the blood compatibility test is from Oci Medical Devices Co., Ltd (Chengdu, China). The hydrophilic cross-linked PVP (PVP-1) adsorbent was made in the laboratory.2.2. Preparation of the adsorbents
The water phase composed of PVA (polymer dispersion stabilizer, 1% of the water phase mass) and distilled water was added into a three-necked bottle; after the water phase was evenly mixed, the oil phase composed of DVB (monomer), toluene (porogen) and BPO (initiator) was added. The stirring speed was adjusted to make the oil droplet size appropriate (0.4–0.8 mm), followed by heating. After the polymerization was complete, the PVA was removed with hot water, the polymer was packed into a column, the porogen was removed with ethanol, and the ethanol was removed with deionized water, and then the sample was dried to obtain a highly crosslinked PDVB macroporous adsorbent, named DV.DV was fully swelled in a toluene–DMF mixed solution with a mass ratio of 8![[thin space (1/6-em)]](https://www.rsc.org/images/entities/char_2009.gif) :
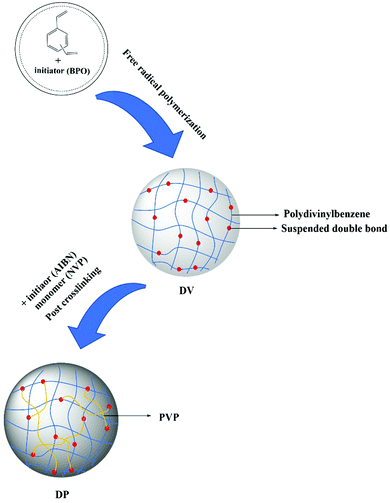
:![[thin space (1/6-em)]](https://www.rsc.org/images/entities/char_2009.gif) 2 (swelling agent), quantitative NVP (the input amount is 100%, 160%, 200%, and 260% of the DV mass) and AIBN (initiator, 5% of the DV mass). Then liquid paraffin was added and heated up. After the reaction was complete, post-treatments such as the removal of the swelling agent and the vinylpyrrolidone homopolymer were carried out to obtain the DP adsorbent. The synthesis process is shown in Fig. 2. Corresponding to the change in the NVP feed rate, the DP adsorbents were named DP-1, DP-2, DP-3, and DP-4.
2 (swelling agent), quantitative NVP (the input amount is 100%, 160%, 200%, and 260% of the DV mass) and AIBN (initiator, 5% of the DV mass). Then liquid paraffin was added and heated up. After the reaction was complete, post-treatments such as the removal of the swelling agent and the vinylpyrrolidone homopolymer were carried out to obtain the DP adsorbent. The synthesis process is shown in Fig. 2. Corresponding to the change in the NVP feed rate, the DP adsorbents were named DP-1, DP-2, DP-3, and DP-4.
2.3. Characterization of adsorbents
where a is the moisture content (%), W0 is the wet adsorbent weight (g), and W1 is the dry adsorbent weight (g).
2.4. Bilirubin adsorption experiment
All adsorption experiments were performed three times.Bilirubin–albumin mixed solution: 30 mg of bilirubin was measured and placed in a 100 ml brown volumetric flask, dissolved in 5 ml of 0.1 mol L−1 NaOH solution and a small amount of Na2CO3, and then 0.568 g of BSA was added, and 300 mg L−1 total bilirubin solution was prepared with 0.1 mol L−1 phosphate buffer solution (pH = 7.4). The preparation process is strictly protected from light.
where Qe is the adsorption capacity (mg g−1), C0 is the initial concentration (mg L−1) and Ce is the equilibrium concentration (mg L−1), w is the quality of the wet adsorbent (g) and V is the solution volume (L), and a is the moisture content of the wet adsorbent (%).
2.5. Blood compatibility test
Hemocompatibility was tested by Oci Medical Devices Co., Ltd (Chengdu, China) according to the ISO 10993-4:2017 standard.where H is the hemolysis rate (%), X1 is the absorbance of the sample, X2 is the absorbance of the positive reference substance, and X3 is the absorbance of the negative reference substance. This test should be repeated three times.
3. Results and discussion
3.1. Characterization of the DP adsorbent
In order to investigate the effects of different functional group contents on the pore structure and adsorption performance of adsorbents, we synthesized adsorbents with different PVP segment contents by changing the NVP feed amount. The physical parameters of the PDVB spheres (DV) and the DP adsorbent are shown in Table 1.| Adsorbent | Structure | Feed ratioa (w/w) | Particle size distribution (mm) | Nitrogen content (wt%) | Moisture content (wt%) | Average pore size (nm) |
|---|---|---|---|---|---|---|
| a Feed ratio refers to the proportion of weight of DV to NVP. | ||||||
| DV | Poly(DVB) | 10![[thin space (1/6-em)]](https://www.rsc.org/images/entities/char_2009.gif) : :![[thin space (1/6-em)]](https://www.rsc.org/images/entities/char_2009.gif) 0 0 |
0.4–0.8 | 0 | 71.5 | 7.4 |
| DP-1 | Poly(DVB-g-NVP) | 10![[thin space (1/6-em)]](https://www.rsc.org/images/entities/char_2009.gif) : :![[thin space (1/6-em)]](https://www.rsc.org/images/entities/char_2009.gif) 10 10 |
0.4–0.8 | 2.8 | 70.1 | 8.2 |
| DP-2 | Poly(DVB-g-NVP) | 10![[thin space (1/6-em)]](https://www.rsc.org/images/entities/char_2009.gif) : :![[thin space (1/6-em)]](https://www.rsc.org/images/entities/char_2009.gif) 16 16 |
0.4–0.8 | 3.7 | 67.4 | 9.3 |
| DP-3 | Poly(DVB-g-NVP) | 10![[thin space (1/6-em)]](https://www.rsc.org/images/entities/char_2009.gif) : :![[thin space (1/6-em)]](https://www.rsc.org/images/entities/char_2009.gif) 20 20 |
0.4–0.8 | 4.4 | 67.8 | 10.1 |
| DP-4 | Poly(DVB-g-NVP) | 10![[thin space (1/6-em)]](https://www.rsc.org/images/entities/char_2009.gif) : :![[thin space (1/6-em)]](https://www.rsc.org/images/entities/char_2009.gif) 26 26 |
0.4–0.8 | 5.2 | 68.2 | 10.8 |
In Table 1, the particle size distribution of all adsorbents is the same, because in the post-processing of the adsorbents, we use screens with different apertures to screen the adsorbents. Table 1 shows that the nitrogen content of the DP adsorbent gradually increased upon increasing the NVP feeding, which preliminarily indicates that an increasing number of PVP chain segments entered DV. The moisture content of the DP adsorbent basically did not decrease, and the average pore size also did not decrease, which preliminarily indicated that the introduction of the PVP segment did not block the pores of the adsorbent.
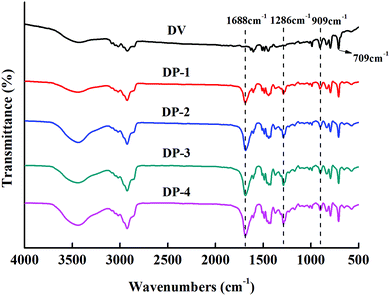
To further prove the synthesis of the DP adsorbent, we determined the infrared spectra of DV and the DP adsorbent, and the results are shown in Fig. 3.
In Fig. 3, 709 cm−1 is the C–H characteristic peak in the double bond connecting benzene ring, which is not affected by the introduction of functional groups. Therefore, it can be used as an internal standard peak to compare the differences between various adsorbents. The DP adsorbent produced two peaks, at 1688 cm−1 (C![[double bond, length as m-dash]](https://www.rsc.org/images/entities/char_e001.gif) O characteristic peak) and 1286 cm−1 (C–N characteristic peak), that were different from those produced by DV. At 909 cm−1 (the peak characteristic of suspended double bonds), the peak area decreased significantly. This indicates that the hydrophilic PVP chain segments entered the hydrophobic DV through the reinitiation of suspended double bonds. It can also be seen from Fig. 3 that from DP-1 to DP-4, the peak values of C
O characteristic peak) and 1286 cm−1 (C–N characteristic peak), that were different from those produced by DV. At 909 cm−1 (the peak characteristic of suspended double bonds), the peak area decreased significantly. This indicates that the hydrophilic PVP chain segments entered the hydrophobic DV through the reinitiation of suspended double bonds. It can also be seen from Fig. 3 that from DP-1 to DP-4, the peak values of C![[double bond, length as m-dash]](https://www.rsc.org/images/entities/char_e001.gif) O and C–N gradually increased, indicating that from DP-1 to DP-4, the content of the functional groups of the adsorbents gradually increased.
O and C–N gradually increased, indicating that from DP-1 to DP-4, the content of the functional groups of the adsorbents gradually increased.
Subsequently, we measured the water contact angles of DV and the DP adsorbent to illustrate the improvement of hydrophilicity of the DP adsorbent, the result is shown in Fig. 4.
As can be seen from Fig. 4, from DV on the left to DP-4 on the right, the water contact angle of the adsorbent gradually decreases, indicating that with the introduction of the PVP chain segment, the hydrophilicity of the DP adsorbent gradually increases.
The macrostructures of DV and the DP adsorbent were investigated by optical microscopy, and the results are shown in Fig. 5.
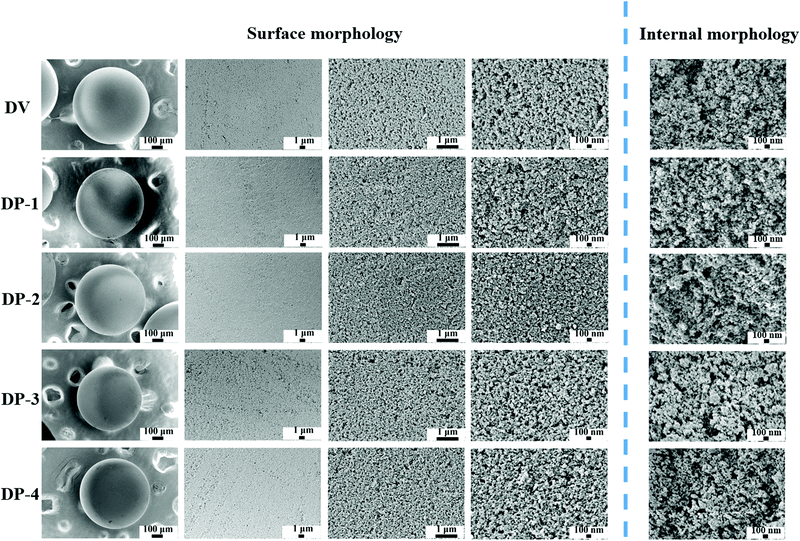
In Fig. 5, the macrostructures of DV and the DP adsorbent are not much different; both are complete spheres with a particle size of 0.4–0.8 mm. Therefore, there will not be difficult blood flow and material shedding problems in the actual hemoperfusion process. This also indicates that the DP adsorbent has the basic conditions as the hemoperfusion adsorbent. The porous structure on the surface of and inside the adsorbent is the basis of mass transfer and adsorption. The surface and internal morphologies of all adsorbents were investigated by SEM, and the results are shown in Fig. 6.
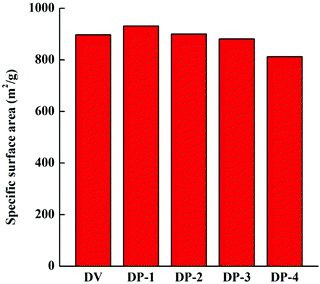
In Fig. 6, both DV and the DP adsorbent are spheres with smooth surfaces in the macroscopic state, and as the magnification increases, porous structures can be observed on the surfaces of DV and the DP adsorbent. At the same time, we can also observe that the interior of the DP adsorbent has a porous structure, which is crucial for bilirubin diffusion in the adsorbent channel to reach the adsorption site, so that the adsorbent has better adsorption kinetics. In order to further illustrate the pore structure of the DP adsorbent, we measured the specific surface area data of DV and the DP adsorbent, and the results are shown in Fig. 7.
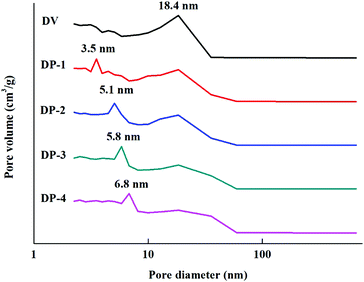
As shown in Fig. 7, with the introduction of hydrophilic PVP chain segments, the specific surface area of the adsorbent first increased and then decreased. At the same time, even the lowest specific surface area of DP-4 is as high as 812 m2 g−1. This indicates that unlike copolymerization and graft reaction, the DP adsorbent synthesized by reinitiation of suspended double bonds introduces a large number of hydrophilic chain segments while maintaining a high specific surface area. This is because the uncontrollable characteristics of free radical polymerization lead to different lengths of PVP chain segments introduced into the PDVB skeleton. Moreover, the mode of connection with the PDVB skeleton may be the initiation of suspended double bonds and then grafting onto a PVP chain segment, or a PVP crosslinking bridge may be formed between two suspended double bonds. The former, due to the presence of a large number of PVP chain segments in the form of a graft, will seriously block the pores of the adsorbent, resulting in a serious reduction of the specific surface area. The latter PVP chain segment exists in the form of a crosslinked bridge, which improves the strength of the adsorbent and increases the specific surface area of the adsorbent. The results in Fig. 7 preliminarily indicate that a large number of PVP chain segments in the DP adsorbent mainly exist in the form of crosslinking. To illustrate this point more clearly, pore distribution data for DV and the DP adsorbent were obtained and the results are shown in Fig. 8.
A large number of porogens are added in the preparation process of conventional polystyrene (PSt) macroporous resins, and they are filled in the PSt framework. When the porogen is removed, the highly cross-linked structure of PSt ensures that the polymer chain will not collapse, which is the main process for the formation of macroporous resin pores.36 However, in this work, during the polymerization of DVB, due to incomplete initiation of double bonds, there will be some residual double bonds that have not been initiated, which leads to the incomplete cross-linking structure in DV.37 Before testing the DV pore distribution data, it is necessary to remove the porogen and measure it in a dry state. This part of the DVB framework with an incomplete cross-linked structure will collapse, resulting in the DV being concentrated in the 18.4 nm pore distribution. When the polymerization was initiated again, DV was swollen in the toluene–DMF solution, and a PVP polymer was formed between the double bonds, which played a very effective supporting role, which we called the formation of a new cross-linking bridge. Secondary initiation is still based on ordinary free radical polymerization, which is not controllable. In the confined environment of the adsorbent framework, it is difficult for free radicals to contact each other, and the bi-radical termination reaction is difficult to occur. Therefore, a relatively short polymer chain is formed, and the chain growth is quickly terminated due to the termination characteristics of the free radical polymerization reaction, and a short cross-linking bridge is formed. Before the measurement of the DP pore structure, although the removal of the swelling agent and drying were also performed, this part of the polymer skeleton did not collapse, and a new pore distribution was formed in the micropore part.
The DP adsorbent has a large particle size and complete spherical shape, which meets the basic conditions of a hemoperfusion adsorbent. The crosslinking structure of the hydrophobic skeleton and hydrophilic chain segments makes DP adsorbents have a uniform distribution of functional groups, highly crosslinked structure and high specific surface area. These characteristics ensure that the DP adsorbent has good strength, synergistic adsorption of bilirubin, fast adsorption kinetics and good blood compatibility.
3.2. Effect of the adsorbent structure on adsorption performance
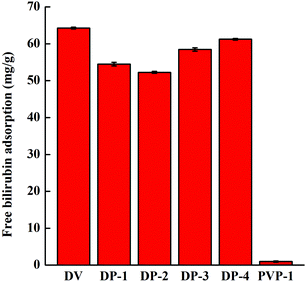
The adsorption of the DP adsorbent for free bilirubin showed a trend of decrease first and then increase. This is because bilirubin is a hydrophobic molecule, and when fewer PVP chain segments were introduced into the DP adsorbent, the hydrogen bonding between the adsorbent and bilirubin was not sufficient to compensate for the decrease in bilirubin adsorption due to a decrease in hydrophobic interactions between the adsorbent and bilirubin (as in the adsorption behavior of DV, DP-1 and DP-2). However, with an increase in PVP chain segments in the DP adsorbent, more PVP chain segments formed hydrogen bonds with bilirubin, and the adsorption capacity of bilirubin by the adsorbent increased (as in the adsorption behavior of DP-2, DP-3 and DP-4). PVP-1 has no adsorption capacity for bilirubin, and this is because PVP-1 is too hydrophilic and can only provide hydrogen bonding. During the adsorption experiment, due to the interference of water molecules in the adsorption solution, it is difficult for the PVP-1 to generate hydrogen bonds with bilirubin.
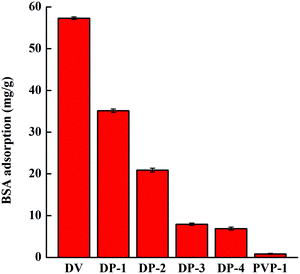
As shown in Fig. 10, with an increase of hydrophilicity of the adsorbent, the adsorption amount of BSA decreases, indicating that the improvement of hydrophilicity enhances the anti-nonspecific protein adsorption performance of the adsorbent. Compared with DV, the anti-nonspecific protein adsorption performance of DP-4 increased by nearly 90%. The protein adsorption capacity of DP-3 and DP-4 is similar, indicating that under these conditions, the anti-nonspecific protein adsorption performance of the adsorbent was not significantly improved by introducing a PVP chain segment. The only hydrogen bonding of PVP-1 is broken by water molecules, so PVP-1 has no adsorption capacity for proteins.
In conclusion, DP-4 has the highest free bilirubin adsorption capacity and the best anti-nonspecific protein adsorption performance. Therefore, we selected DP-4 as the best adsorbent to further investigate its performance.
3.3. DP-4 performance evaluation
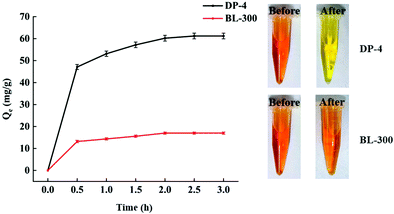
As seen in Fig. 11, DP-4 and BL-300 almost reach adsorption equilibrium at 2 h. The bilirubin adsorption capacity of DP-4 is significantly higher than that of BL-300, and its 2 h adsorption capacity reaches 60 mg g−1, which is 3.6 times that of the commercial adsorbent BL-300 under the same conditions.
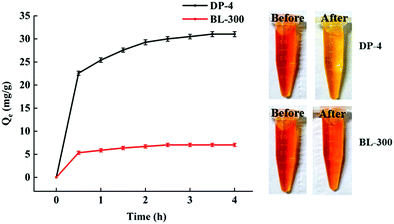
Bilirubin usually binds to albumin in the blood to form a bilirubin–albumin complex.41 The blood of patients with hyperbilirubinemia not only contains free bilirubin, but also contains a certain bilirubin–albumin complex. Therefore, we investigated the adsorption performance of the adsorbent in the presence of albumin, and the results are shown in Fig. 12.
As shown in Fig. 12, the adsorption capacity of DP-4 and BL-300 is inferior to that of free bilirubin shown in Fig. 11. This is because the adsorbent adsorbs not only free bilirubin, but also the bilirubin–albumin complex. After bilirubin binds to albumin, on the one hand, the hydrophilicity of albumin makes the complex more hydrophilic than bilirubin. On the other hand, the molecular size of BSA in aqueous solution is about 8.6 nm,42 and DP-4 has a large number of micropores, so after DP-4 adsorbs the complex, part of the pores will be blocked. These two aspects make the adsorption capacity of DP-4 for complexes lower than that for bilirubin. As we can also see from Fig. 12, the bilirubin adsorption capacity of DP-4 is still significantly higher than that of BL-300. Under the same adsorption conditions, the bilirubin adsorption capacity of DP-4 is 4.4 times that of BL-300.
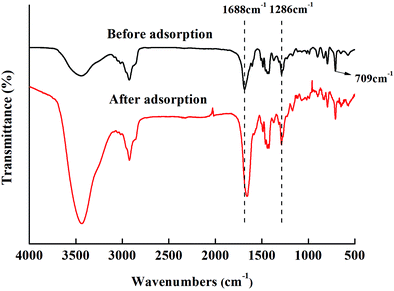
When the group forms hydrogen bonds, the infrared characteristic peak of the group will move to the lower wavenumber direction.43 From Fig. 13, we can see that after DP-4 adsorbs bilirubin, the C![[double bond, length as m-dash]](https://www.rsc.org/images/entities/char_e001.gif) O peak at 1688 cm−1 obviously shifts to a low wavenumber. Meanwhile, the characteristic peaks of other groups on DP-4 did not show any shift. This indicates that the carbonyl group of the PVP segment in DP-4 forms a hydrogen bond with bilirubin. The adsorption results of the PVP-1 indicated that the hydrophobic interaction between DP-4 and bilirubin was the main binding force between them. Based on the infrared spectra before and after the adsorption of DP-4 and the molecular structure of bilirubin, we speculated that DP-4 might adsorb bilirubin through the mechanism shown in Fig. 14.
O peak at 1688 cm−1 obviously shifts to a low wavenumber. Meanwhile, the characteristic peaks of other groups on DP-4 did not show any shift. This indicates that the carbonyl group of the PVP segment in DP-4 forms a hydrogen bond with bilirubin. The adsorption results of the PVP-1 indicated that the hydrophobic interaction between DP-4 and bilirubin was the main binding force between them. Based on the infrared spectra before and after the adsorption of DP-4 and the molecular structure of bilirubin, we speculated that DP-4 might adsorb bilirubin through the mechanism shown in Fig. 14.
As shown in Fig. 14, the hydrophobic skeleton of DP-4 can interact with bilirubin, making bilirubin molecules close to DP-4. The multiple hydrogen bonds provided by the PVP segments on DP-4 make the intramolecular hydrogen bonds of bilirubin difficult to support. The intramolecular hydrogen bonds of bilirubin are broken and stronger hydrogen bonds are formed with the PVP segment. Finally, DP-4 adsorbed bilirubin through hydrophobic–hydrogen bond synergy.
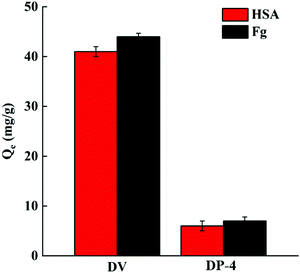
3.3.3.1. Protein adsorption. Human blood contains a variety of proteins, among which HSA is the most abundant. When the material is in contact with human blood, the adsorption of HSA and Fg on the material surface has an important influence on the formation of thrombosis.44 The adsorption performance of DP-4 on HSA and Fg was investigated and compared with that of unmodified DV. The results are shown in Fig. 15.
As seen in Fig. 15, the adsorption capacities of DP-4 on HSA and Fg are 6 mg g−1 and 7 mg g−1, respectively. Compared with DV without hydrophilic modification, the adsorption capacity of HSA and Fg of DP-4 decreased by 85% and 84%, respectively. These results indicate that DP-4 has good anti-nonspecific protein adsorption performance and has the potential for good blood compatibility.
3.3.3.2. Blood coagulation experiment. Blood coagulation refers to the process of blood changing from a flowing liquid state to a non-flowing gel state. If coagulation occurs during hemoperfusion, it is very dangerous for patients. The coagulation pathway includes the endogenous pathway, exogenous pathway and endogenous and exogenous co-coagulation pathway. Thrombin is then produced and activates the formation of fibrin, which leads to coagulation.45–47 Activated partial thromboplastin time (APTT) reflecting the endogenous coagulation pathway, prothrombin time (PT) reflecting the exogenous coagulation pathway, and thrombin time (TT) reflecting the common coagulation pathway were measured. Fibrinogen (FIB) is a soluble plasma glycoprotein that is converted into fibrin by thrombin during blood clot formation. Therefore, the FIB content also needs to be determined. The results are listed in Table 2.
| Test | After adding adsorbent | Negative control | Rate of change (%) | ||
|---|---|---|---|---|---|
| DV | DP-4 | DV | DP-4 | ||
| APTT (s) | 11.2 ± 0.11 | 14.3 ± 0.05 | 14.2 ± 0.01 | 21.1 ± 0.76 | <0.5 |
| PT (s) | 5.1 ± 0.05 | 6.8 ± 0.03 | 6.7 ± 0.02 | 24.0 ± 0.84 | <0.5 |
| TT (s) | 21.4 ± 0.21 | 17.9 ± 0.01 | 18.2 ± 0.01 | 17.6 ± 0.91 | <0.5 |
| FIB (g L−1) | 7.4 ± 0.07 | 6.6 ± 0.06 | 6.7 ± 0.02 | 10.3 ± 0.96 | <0.5 |
The rate of change refers to the percentage of difference between the results of the blood sample and the negative control after adding the adsorbent to the results of the negative control.
As can be seen from Table 2, compared with the negative control, the APTT, PT, TT and FIB test results of DV were all different by more than 10%. In contrast, there was no significant difference in the test results of blood samples after the addition of DP-4 compared with the negative control, indicating that there was no risk of coagulation in whole blood perfusion with DP-4.
3.3.3.3. Platelet adhesion. Platelets are closely related to thrombosis and can promote thrombosis by adhesion and releasing factors or aggregation.48 For adsorbents in direct contact with blood, platelet adhesion rate is an important indicator. The platelet adhesion test results of DP-4 are listed in Table 3.
| Test | After adding adsorbent | Negative control | Rate of change (%) | ||
|---|---|---|---|---|---|
| DV | DP-4 | DV | DP-4 | ||
| Platelet (109 L−1) | 392 ± 2 | 437 ± 1 | 438 ± 1 | 10.5 ± 0.66 | <0.5 |
As seen in Table 3, after the addition of DV, the platelet content in the samples decreased by 10.5%. In contrast, there was no significant difference in platelet levels in the blood samples with adsorbents compared with the negative control. This indicates that few platelets adhere to DP-4 after contact with blood.
3.3.3.4. Hematological evaluation. The main visible components of blood are blood cells, including erythrocytes, leukocytes and platelets, which play an important role in maintaining nutrient and oxygen levels, inflammation and clotting, respectively. As a whole blood perfusion adsorbent, it is necessary to investigate the effect of DP-4 on blood cells. The results of the hematological evaluation of DP-4 are listed in Table 4.
| Test | After adding adsorbent | Negative control | Rate of change (%) | ||
|---|---|---|---|---|---|
| DV | DP-4 | DV | DP-4 | ||
| Erythrocytes (1012 L−1) | 1.7 ± 0.03 | 2.0 ± 0.02 | 2.0 ± 0.01 | 15.0 ± 1.04 | <0.5 |
| Leukocytes (109 L−1) | 1.8 ± 0.04 | 2.1 ± 0.01 | 2.1 ± 0.02 | 14.3 ± 1.08 | <0.5 |
| Platelets (109 L−1) | 395 ± 1 | 436 ± 1 | 438 ± 1 | 9.8 ± 0.03 | <0.5 |
As shown in Table 4, after the addition of DV, the erythrocyte, leukocyte and platelet contents in the blood samples were lost by 15%, 14.3% and 9.8%, respectively. In contrast, after adding DP-4, the content of erythrocytes, leukocytes and platelets in the blood samples had no significant difference compared with the negative control, indicating that DP-4 had minimal effect on blood cells when it came into contact with blood.
3.3.3.5. Hemolysis test. The hemolysis rate is a very important indicator of the blood compatibility of a material, which represents the damage degree of the material to erythrocytes when the material is in contact with blood. According to the ASTM standard (ASTM F756-13),49 the material should have a hemolysis rate of less than 5%. The hemolysis rate test results of DP-4 are listed in Table 5.
| After adding adsorbent (OD) | Negative control (OD) | Positive control (OD) | Hemolysis rate (%) | ||
|---|---|---|---|---|---|
| DV | DP-4 | DV | DP-4 | ||
| OD refers to the absorbance value of the sample. | |||||
| 0.063 ± 0.001 | 0.027 ± 0.002 | 0.017 ± 0.001 | 0.852 ± 0.001 | 5.50 ± 0.19 | 1.36 ± 0.30 |
As can be seen from Table 5, the hemolysis rate of DV was higher than 5%. In contrast, the hemolysis rate of DP-4 was 1.36%, which was less than 5%.
In conclusion, compared with DV, the blood compatibility improvement effect of DP-4 is very obvious. DP-4 has good blood compatibility without coating and other treatments, and has potential for direct application in whole blood perfusion.
4. Conclusion
In summary, we introduced hydrophilic PVP chain segments into hydrophobic PDVB frameworks by reinitiation of suspended double bonds. A class of nonionic adsorbents with a “hydrophobic–hydrophilic” structure, uniform distribution of functional groups, highly cross-linked structure and high specific surface characteristics were synthesized. The introduction of PVP, on the one hand, increased the anti-nonspecific protein adsorption performance of the adsorbent and, on the other hand, the adsorbent adsorbed bilirubin through hydrophobic–hydrogen bond synergy, so as to maintain the adsorption capacity of bilirubin. The bilirubin adsorption capacity of the best adsorbent DP-4 was compared with that of commercial adsorbent BL-300. The results showed that the free bilirubin adsorption capacity of DP-4 was 3.6 times that of BL-300, and the bilirubin adsorption capacity of DP-4 was 4.4 times that of BL-300 in the presence of albumin. Blood compatibility test results show that DP-4 has good blood compatibility without any treatment. More importantly, DP-4 has characteristics such as large particle size, smooth surface, good strength, simple synthesis process and low cost, with practical application ability in the treatment of hyperbilirubinemia.Conflicts of interest
There are no conflicts to declare.References
- R. Stocker, Y. Yamamoto, A. Mcdonagh, A. Glazer and B. Ames, Science, 1987, 126, 1043–1046 CrossRef
.
- S. Kikuchi, M. Hata, K. Fukumoto, Y. Yamane, T. Matsui, A. Tamura, S. Yonemura, H. Yamagishi, D. Keppler and S. Tsukita, Nat. Genet., 2002, 31, 320–325 CrossRef CAS
.
- N. C. Fisher, P. G. Nightingale, B. K. Gunson, G. W. Lipkin and J. M. Neuberger, Transplantation, 1998, 66, 59 CrossRef CAS PubMed
.
- A. Postiglione, F. Faccenda, G. Gallotta, P. Rubba and S. Federico, Stroke, 1991, 22, 1508 CrossRef CAS PubMed
.
- T. Chandy and C. P. Sharma, Artif. Organs, 2010, 16, 568–576 CrossRef
.
- R. Senf, R. Klingel, S. Kurz, S. Tullius, I. Sauer, U. Frei and R. Schindler, Int. J. Artif. Organs, 2004, 27, 717–722 CrossRef CAS PubMed
.
- J. L. Lin and P. S. Lim, Blood Purif., 1994, 12, 121–127 CrossRef CAS PubMed
.
- M. Chen, M. Pan, Y. Chong, J. Wang and D. Long, Carbon, 2018, 130, 782–791 CrossRef CAS
.
- H. Wei, L. Han, Y. Tang, J. Ren, Z. Zhao and L. Jia, J. Mater. Chem. B, 2015, 3, 1646 RSC
.
- X. Xu, Y. Wang, B. Duan, S. Wu and L. Zhang, J. Mater. Chem. B, 2017, 5, 2952 RSC
.
- K. Wu, W. Yang, Y. Jiao and C. Zhou, J. Mater. Chem. B, 2017, 5, 5763 RSC
.
- S. Huang, J. Zheng, Y. Zhang, J. Zheng, Z. Zheng, Q. Yang, F. Wang, G. Chen, S. Huang and G. Ouyang, J. Mater. Chem. B, 2020, 8, 290 RSC
.
- S. Yin, Y. Xu, Z. Wang, Z. Wei, T. Xu, W. Zhao and C. Zhao, J. Mater. Chem. B, 2022, 10, 2534–2543 RSC
.
- Y. Yang, S. Yin, C. He, X. Wu, J. Yin and J. Zhang, J. Mater. Chem. B, 2020, 8, 1960 RSC
.
- N. Gan, Q. Sun, L. Zhao, S. Zhang, Z. Suo, X. Wang and H. Li, J. Mater. Chem. B, 2021, 9, 5628 RSC
.
- C. R. Davies, P. S. Malchesky and G. M. Saidel, Artif. Organs, 2010, 14, 14–19 CrossRef
.
- V. Davankov, L. Pavlova, M. Tsyurupa, J. Brady and E. Yousha, J. Chromatogr. B: Biomed. Sci. Appl., 2000, 739, 73–80 CrossRef CAS
.
- B. K. I. Meijers, P. Verhamme, F. Nevens, M. F. Hoylaerts, B. Bammens, A. Wilmer, J. Arnout, Y. Vanrenterghem and P. Evenepoel, Am. J. Transplant., 2010, 7, 2195–2199 CrossRef PubMed
.
- J. Nordmann, R. Nordmann and O. Gauchery, Ann. Biol. Clin., 1953, 11, 30–36 CAS
.
- M. B. Gorbet and M. V. Sefton, Biomaterials, 2004, 25, 5681–5703 CrossRef CAS PubMed
.
- S. P. Jackson, W. S. Nesbitt and S. Kulkarni, J. Thromb. Haemostasis, 2010, 1, 1602–1612 CrossRef
.
- R. Bonnett, E. D. John and M. B. Hursthouse, Nature, 1976, 327, 8 Search PubMed
.
- F. P. Seib, M. Herklotz, K. A. Burke, M. F. Maitz, C. Werner and D. L. Kaplan, Biomaterials, 2014, 35, 83–91 CrossRef CAS
.
- Z. Chang, J. Jing, Z. Jie, J. Wei and J. Yin, Colloids Surf., B, 2013, 102, 45–52 CrossRef PubMed
.
- I. K. Kang, O. H. Kwon, M. K. Kim, Y. M. Lee and K. S. Yong, Biomaterials, 1997, 18, 1099–1107 CrossRef CAS
.
- Y. J. Kim, I. K. Kang, M. W. Huh and S. C. Yoon, Biomaterials, 2000, 21, 121–130 CrossRef CAS
.
- H. Chen, Z. Zhang, Y. Chen, M. A. Brook and H. Sheardown, Biomaterials, 2005, 26, 2391–2399 CrossRef CAS PubMed
.
- Z. Jie, S. Qiang, L. Yin, S. Luan, H. Shi, L. Song, J. Yin and P. Stagnaro, Appl. Surf. Sci., 2010, 256, 7071–7076 CrossRef
.
- H. Wang, Y. Tian, C. Zhao and Q. Du, Fibers Polym., 2009, 10, 1–5 CrossRef
.
-
L. Zhou, H. W. Wang and Q. J. Wang, China, Util. Pat., CN102382226 B, 2012 Search PubMed
.
- M. B. Huglin and K. S. Khairou, Eur. Polym. J., 1988, 24, 239–243 CrossRef CAS
.
-
Q. Zhou, Z. Yao, A. Li, W. Jiao and C. Shuang, China, Util. Pat., CN109942737 B, 2020 Search PubMed
.
-
F. Dong and H. Dai, China, Util. Pat., CN105561950 B, 2018 Search PubMed
.
- J. Zheng, L. Wang, X. Zeng, X. Zheng and Y. Zhang, ACS Appl. Mater. Interfaces, 2016, 8, 18684–18692 CrossRef CAS
.
-
L. Wang and C. Tao, China, Util. Pat., CN111957304 B, 2020 Search PubMed
.
- B. Ooa, Prog. Polym. Sci., 2000, 25, 711–779 CrossRef
.
- X. Zeng, T. Yu, W. Peng, R. Yuan, Q. Wen, Y. Fan, C. Wang and R. Shi, J. Hazard. Mater., 2010, 177, 773–780 CrossRef CAS
.
-
F. Puoci, Advanced polymers in medicine, Springer, 2014 Search PubMed
.
- S. Nakaji and N. Hayashi, Ther. Apheresis Dial., 2003, 7, 98–103 CrossRef CAS
.
- J. Chen, W. Han, J. Chen, W. Zong, W. Wang, Y. Wang, G. Cheng, C. Li, L. Ou and Y. Yu, Regener. Biomater., 2017, 1, 31–37 CrossRef PubMed
.
- Y. Takenaka, Ther. Apheresis Dial., 1998, 2, 129–133 CrossRef CAS
.
- S. Wang, K. Chen, L. Li and X. Guo, Biomacromolecules, 2013, 14, 818–827 CrossRef CAS PubMed
.
- A. Witkowski and M. Wójcik, Chem. Phys., 1973, 1, 9–16 CrossRef CAS
.
-
B. D. Ratner, A. S. Hoffman, F. J. Schoen and J. E. Lemons, Biomaterials science: an introduction to materials in medicine, Elsevier, 2004 Search PubMed
.
- M. Levi, C. H. Toh, J. Thachil and H. G. Watson, Br. J. Haematol., 2009, 145, 24–33 CrossRef CAS PubMed
.
- W. C. Lin, T. Y. Liu and M. C. Yang, Biomaterials, 2004, 25, 1947–1957 CrossRef CAS
.
- R. K. Kainthan, J. Janzen, E. Levin, D. V. Devine and D. E. Brooks, Biomacromolecules, 2006, 7, 703–709 CrossRef CAS PubMed
.
- Y. Chang, W. J. Chang, Y. J. Shih, T. C. Wei and G. H. Hsiue, ACS Appl. Mater. Interfaces, 2011, 3, 1228–1237 CrossRef CAS PubMed
.
- ASTM F756-13, 2008.
| This journal is © The Royal Society of Chemistry 2022 |

